Back to Journals » Clinical Ophthalmology » Volume 14
Epithelial Remodeling Following Phacoemulsification in Diabetic Patients Using Anterior-Segment Optical Coherence Tomography: A Comparative Study
Authors Elmekawey H ![]() , Abdelaziz M, El Baradey M, Kotb M
, Abdelaziz M, El Baradey M, Kotb M ![]()
Received 6 June 2020
Accepted for publication 27 July 2020
Published 26 August 2020 Volume 2020:14 Pages 2515—2523
DOI https://doi.org/10.2147/OPTH.S266464
Checked for plagiarism Yes
Review by Single anonymous peer review
Peer reviewer comments 2
Editor who approved publication: Dr Scott Fraser
Hany Elmekawey, Magda Abdelaziz, Mohamed El Baradey, Mohamed Kotb
Ophthalmology, Kasr Alainy Faculty of Medicine, Cairo University, Cairo, Egypt
Correspondence: Mohamed Kotb 3 Montaser Housing, Elharam, Giza, Egypt
Tel +20 2 12263-56283
Email [email protected]
Purpose: To compare the effect of phacoemulsification on corneal epithelial thickness in diabetic and nondiabetic cataract patients.
Methods: Fifty eyes with cataracts were enrolled in a prospective comparative interventional study. They were divided into two groups: group A (diabetics) and group B (nondiabetics) and underwent uneventful phacoemulsification. Epithelial thickness was assessed in the central, paracentral, and peripheral cornea on the first day and at 1 week, 1 month, and 3 months postoperatively using spectral-domain ocular coherence tomography.
Results: A significant increase in the first-day postoperative central epithelial thickness was noticed in both groups (57.16± 3.5 μm and 55.96± 2.81 μm in groups A and B, respectively), with increased baseline epithelial thickness of 3.8± 2.1 μm and 3.4± 2.14 μm in groups A and B, respectively (P< 0.001). A significant decrease in epithelial thickness was noticed in both groups after 1 week (− 2.40± 3.1 μm and − 2.76± 2.71 μm in group A and B, respectively). No further significant change was noticed in the nondiabetic group at 1 month; however, significant reductions in for central epithelial thickness were found in the diabetic group up to the first month (− 0.80± 1.9 μm, P=0.05). Central corneal thickness followed the same pattern of change as the epithelium. A nonsignificant delay in visual acuity improvement was noticed in diabetic patients.
Conclusion: Phacoemulsification induces a temporary increase in corneal and epithelial thickness that should resolve by the first week postoperatively. However, diabetic patients had slower epithelial recovery that took up to 1 month, which could be reflected in delayed visual recovery with no effect on the final visual outcome.
Keywords: cornea, epithelial thickness, phacoemulsification, diabetics, ocular coherence tomography
Introduction
Phacoemulsification is considered nowadays the surgery of choice for cataract removal worldwide.1 Corneal endothelial changes after phacoemulsification have been thoroughly assessed in different studies.2–5 Also, corneal epithelial thickness changes have been mapped following cataract-removal surgery in a normal population using anterior-segment optical coherence tomography (AS-OCT).6,7
Spectral-domain OCT (SD-OCT) has proven to be a better tool for examining the corneal epithelium than time-domain OCT, because of its better resolution and ability to solve the problem of artifacts associated with eye movement during examination due to its higher imaging speed.8 Multiple studies have proven its reliability and repeatability in measuring epithelial thickness.9–11 AS-OCT has been used in multiple studies to assess the epithelial thickness of normal healthy subjects and changes in relation to diurnal variation,12 dry-eye syndrome,10 keratoconus,13 and ectasia,14 and also in diabetics.15
Diabetes causes a series of changes on the ocular surface and the cornea.16 The corneal epithelium has been found to decrease in thickness in diabetic patients versus the normal population in some reports,15 while it showed no change from that of nondiabetics in other studies.17 Also, since many diabetic patients fall in the same age-group as those at risk of senile cataracts (>50 years), this puts them at higher risk of developing those changes. Almost 20% of patients undergoing cataract surgery are diabetics.18 To date, no studies have been done to compare the effect of phacoemulsification on the corneal epithelium in diabetic and nondiabetic populations. In our study, we used SD-OCT to assess corneal epithelial changes in diabetic and nondiabetic cataract patients after phacoemulsification.
Methods
Fifty eyes of 50 patients were enrolled in this prospective nonrandomized interventional study. Patients were admitted to the Ophthalmology Department of Kasr Alainy Faculty of Medicine, Cairo University hospital through outpatient clinics from October 2014 till July 2015.
Groups
Group A comprised diabetic (type 1 or 2) cataract patients.. Patients with diabetic retinopathy or severe neuropathy were excluded from the study..Group B comprised nondiabetic cataract patients. Grade NII–NIII cataracts using the Lens Opacity Classification System II were included.19 Exclusion criteria for both groups were ocular surface diseases (including severe dry eye), corneal scars or opacity, previous corneal surgeries, history of long-term use of eyedrops, history of any type of glaucoma, and retinal problems affecting visual acuity.
All patients in both groups underwent the same preoperative assessment routine of corrected and uncorrected distance visual acuity (CDVA and UDVA) using the logarithm of the minimum angle of resolution, intraocular pressure (IOP) measurement, slit-lamp assessment of the anterior segment, slit-lamp biomicroscopy assessment of the posterior segment, tear-breakup time, and full labs (fasting blood glucose, glycosylated hemoglobin [HbA1c], and liver and kidney function). Noncontact specular microscopy using a noncontact Robo-7 microscope (Konan Medical, Hyogo, Japan) was performed and repeated after 3 months.
AS-OCT Measurement
Next, AS-OCT scans of the cornea and corneal epithelium were taken on separate occasions to avoid artifacts or alterations due to examination with the SD-OCT RTVue100 (Optovue, Fremont, CA, USA) using the L-Cam lens. Settings were eight meridional B-scans per acquisition, consisting of 1,024 A-scans, each with 5μm axial resolution, acquired in less than a second. Images with quality >30 the signal strength–index parameter (a measure of the average signal strength across the scan) were considered for the study. These eight radial meridional scans were employed by the system software to produce by interpolation three-dimensional thickness maps. The RTVue system allows automated measurements of every point in the inner 6 mm portion of the cornea and epithelium, and automatically displays them in the form of maps.
Two maps were displayed in each OCT image, corneal thickness (pachymetry) and corneal epithelial thickness. Each map was made up of 17 readings for corneal thickness and 17 for epithelial thicknesss. A single central-thickness reading corresponding to the 2 mm pupillary zone (12.56 mm2), eight readings within the 2–5 mm median zone (each 8.24 mm2), and eight readings within the 5–6 mm peripheral zone (each 4.32 mm2) were given in both the central corneal thickness (CCT) map and the central corneal epithelial thickness map. Each reading was the average thickness of the points in the zone it was displayed on. This first reading was taken as the preoperative measurement. OCT was repeated on the first postoperative day and at 1 week, 1 month, and 3 months following the surgery. OCT scans were done and read by only one ophthalmology consultant specialized in ophthalmic investigations. We collected OCT measurements of central corneal epithelial thickness and CCT preoperatively, on the first postoperative day, and at 1 week, 1 month, and 3 months after surgery in all patients.
Operative Procedure
All patients then underwent uneventful phacoemulsification cataract-extraction surgery in the same operating theater under peribulbar anesthesia by two expert surgeons using the Infiniti Vision system with Ozil (Alcon Laboratories, Fort Worth, TX, USA), using the stop-and-chop technique, and a one-piece foldable intraocular lens was implanted in the capsular bag. Postoperatively, all patients received the same treatment regimen: broad-spectrum antibiotic drops, steroid drops, antibiotic–steroid combination ointment.) Postoperative assessment of visual acuity and IOP, and slit-lamp examination of anterior and posterior segments was repeated on all patients. OCT was repeated on the first postoperative day and at 1 week, 1 month, and 3 months following the surgery.
Statistical Analysis
Statistical analysis was done using SPSS version 22.0 statistical software. Descriptive statistics were calculated, and data are summarized as ranges and means ± SD. Comparisons between mean thicknesses were carried out using Student’s t-test. Correlations between variables were assessed with Spearman’s rank correlation coefficient (r). Results were considered statistically significant at P≤0.05.
Results
Fifty eyes of 50 patients (31 females and 19 males) were enrolled in this study and divided into two groups: group A (diabetic cataract patients) and group B (nondiabetic cataract patients). Of the 50 eyes, 23 were left and 27 right (46% OS, 54% OD). In both groups, patient age range was 40–70 years, with a mean age of 54.28±7.48 years for group A and 59.56±5.74 years for group B. Preoperative CDVA was 0.74±0.23 and 0.75±0.21 in groups A and B, respectively, with no statistically significant difference.
In group A, four patients were type 1 (insulin-dependent) diabetics, while the remaining 21 patients were type 2 (not insulin-dependent) diabetics. In total, 8% were on insulin and oral hypoglycemic drugs, 28% insulin only, and 56% oral hypoglycemic drugs only. Proportionally, 30% of patients had HbA1c ≥8% (poor control) and 70% had HbA1c 5.5%–7.5% (good control) with a mean of 7.4%±1.9%. The average duration of diabetes was 5.84±4.32 years. Regarding cataract-extraction surgery, there was no statistically significant difference between the groups regarding mean operative duration (26.5±5.67, 27.1±5.75; P=0.326), estimated fluid used (78.4±7.69, 75.36±9.67; P=0.163), or cumulative dissipated energy (7.59±3.2, 7.89±4.5; P=0.293), respectively. Also, no statistically significant difference was found between the groups regarding mean preoperative endothelial cell count (2,689 and 2,789) and that at month 3 postoperatively (2,278 and 2,302), respectively. No elevation of IOP was noticed on the first postoperative day or at any time throughout follow-up. Preoperative OCT measurements of central, middle, and peripheral corneal epithelial thicknesses in both groups are shown in Table 1.
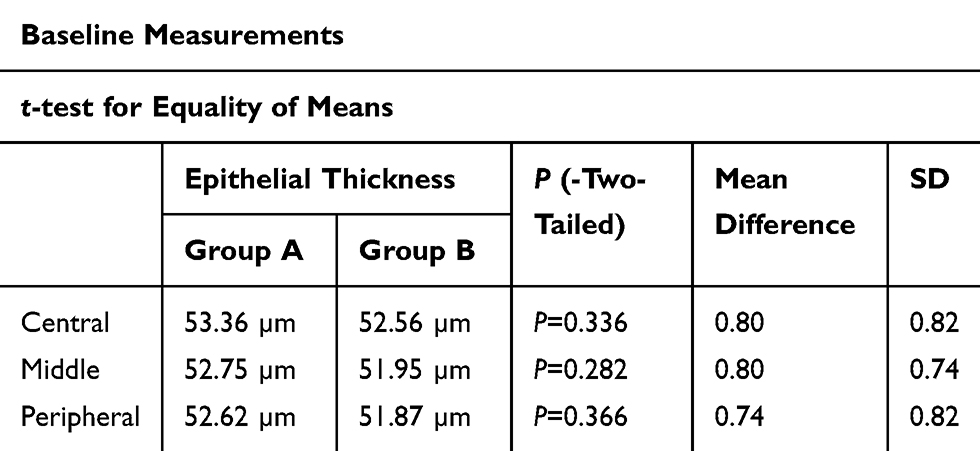 |
Table 1 Comparison of Means of Baseline Corneal Epithelial Thickness for Diabetic and Nondiabetic Groups |
A statistically significant increase in central, middle, and peripheral epithelial thickness in group A and group B was found on the first postoperative day (7.2%, 6.6%, 7.3% and 6.2%, 6.9%, 6.2% from baseline, respectively; Table 2 and Figure 1), with no statistical difference when groups were compared on either parameter (0.72, 0.89; P=0.87). Marked reduction in epithelial thickness was noted at 1 week postoperatively from the first postoperative day’ recording; however, there was no statistical significance between the groups in any area of the cornea (P<0.05, Table 3). The reduction in epithelial thickness at 1 month postoperatively compared to the first week was statistically significant in the diabetic group but not in the nondiabetic group (Table 4). Epithelial thickness results at 1 and 3 months in both groups showed no significant difference when compared to each other or baseline (P>0.05).
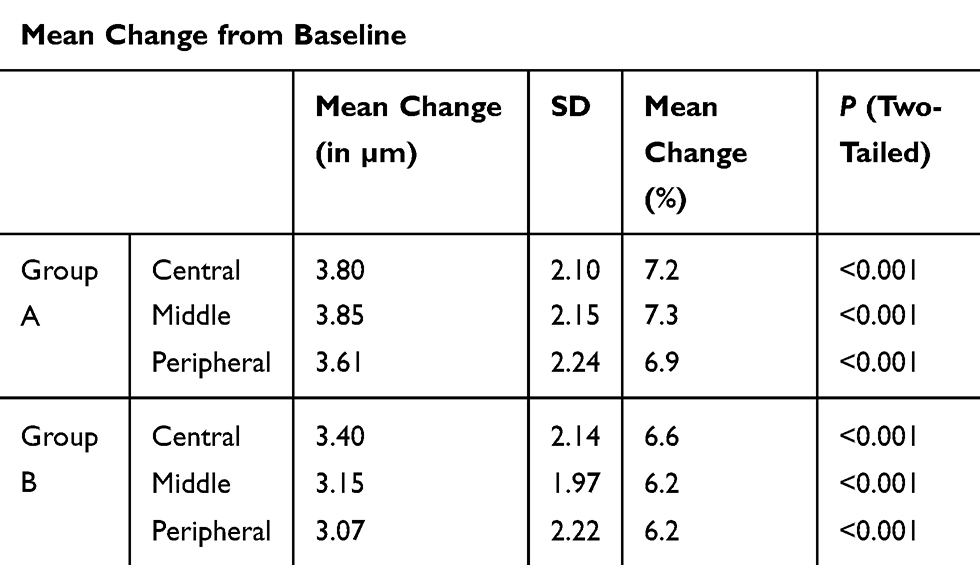 |
Table 2 Mean Change in Epithelial Thickness on the First Postoperative Day |
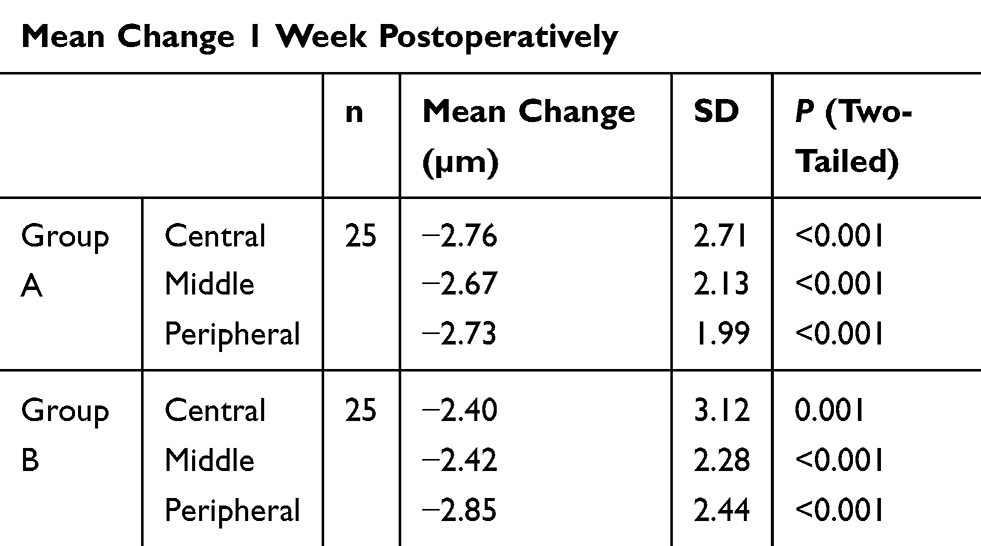 |
Table 3 Mean Change in Epithelial Thickness 1 Week Postoperatively in Comparison with the First Postoperative Day |
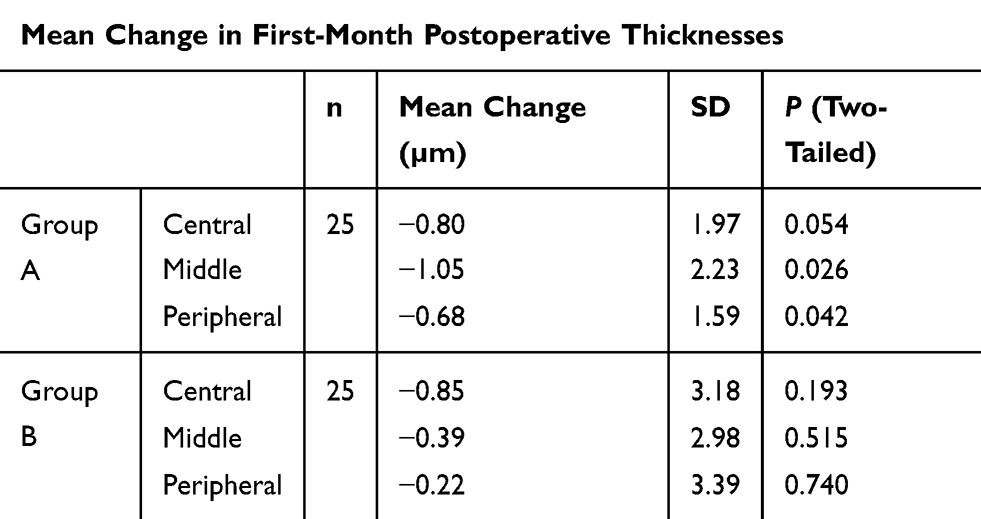 |
Table 4 Mean Change in Epithelial Thickness 1 Month Postoperatively in Comparison with the first Postoperative Week |
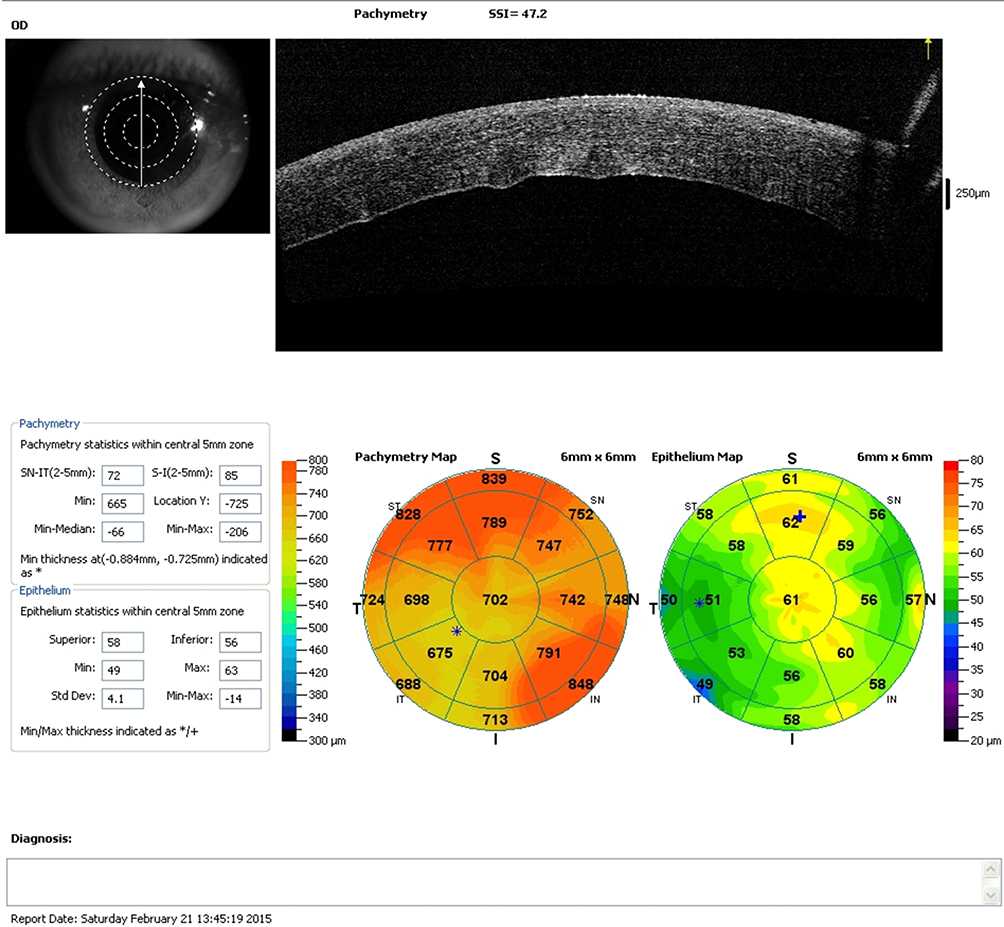 |
Figure 1 SD-OCT of one patient on the first postoperative day, showing both epithelial and corneal thickness maps, with significant increase in thickness. |
Epithelial thickness changes in both groups throughout the study are displayed in Figure 2. There was a strong positive correlation between the epithelial baseline thickness and first-day postoperative thickness in both groups. The greater the baseline thickness was, the more it increased following surgery (r=0.804 and 0.710, respectively). Also a strong positive correlation was found among mean thicknesses of the three epithelial regions with each other, meaning that the greater the central epithelial thickness, the greater the middle and peripheral zones’ thickness, and vice versa. This correlation was found in both groups and throughout all postoperative measurements (Table 5).
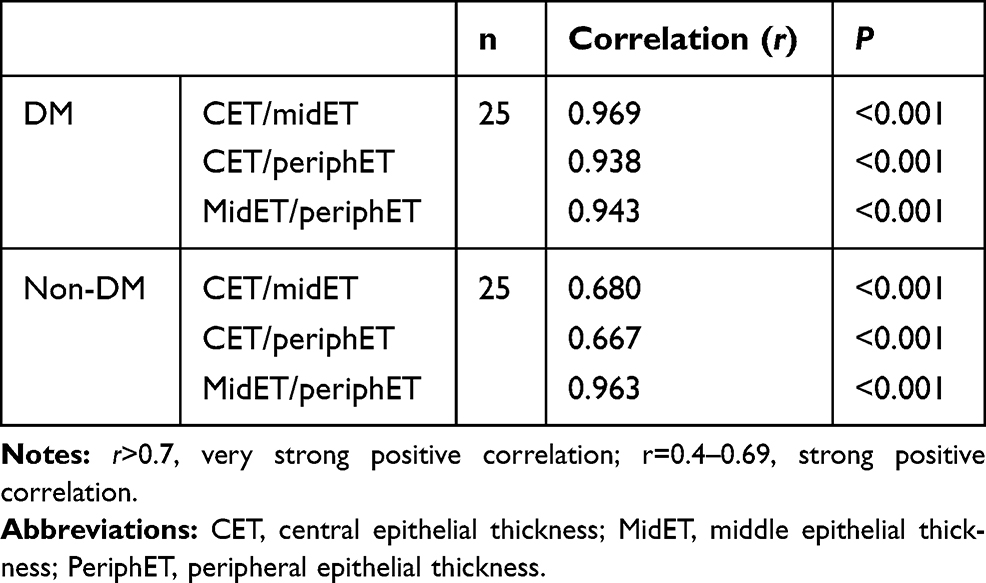 |
Table 5 Correlations Between Each Corneal Zone and Others on All Measurements |
 |
Figure 2 Epithelial thickness changes in both groups throughout the study period. (A) Group A (diabetic patients); (B) group B (nondiabetic patients). |
Corneal thickness was assessed in the same manner and time frames for the same groups of patients, and was found to have a similar pattern to epithelial thickness changes (Figure 3); however, there was a statistically significant difference between readings in the diabetic and the nondiabetic groups on the first day and at the first week (P=0.016, P<0.01), but not at months 1 and 3 postoperatively when compared to each other’s or baseline (P>0.05). There was a positive correlation between mean epithelial thickness and the mean CCT in both groups at 1 day postoperatively. Pearson’s correlation coefficient was 0.76 for the diabetic group and 0.69 for the nondiabetic group. CDVA was 0.24±0.23 and 0.15±0.21 in the first week in groups A and B, respectively, and had improved to 0.11±0.13 and 0.09±0.11 in both groups by the first month, with no statistically significant difference between the groups at either time (P>0.05).
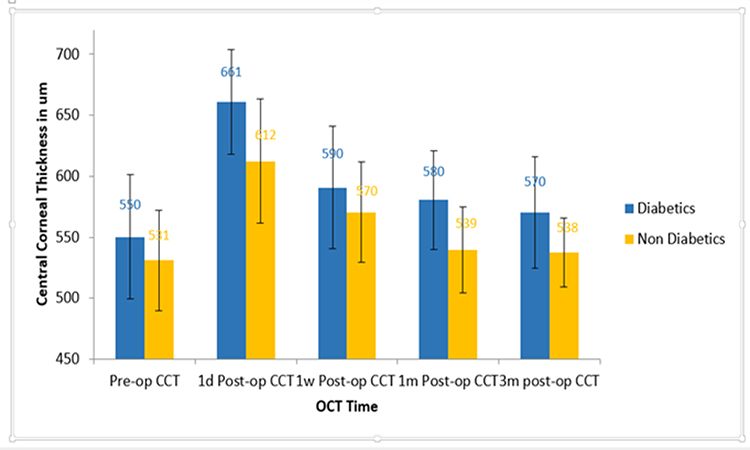 |
Figure 3 Central corneal thickness changes throughout the study period in both groups. |
Discussion
Although changes following phacoemulsification in diabetic corneas have been extensively studied in relation to the endothelial side, no studies have been conducted to assess such changes to the corneal epithelium. To the best of our knowledge, this is the first study to track remodeling of the corneal epithelium following phacoemulsification in diabetic patients in comparison to healthy patients utilizing SD-OCT.
The present study found that the increase in central corneal epithelial thickness in diabetics following phacoemulsification took up to 1 month to resolve completely compared to 1 week only in nondiabetics. In 2011, central corneal epithelium thickness in a sample of 156 eyes of 79 nondiabetic subjects was assessed by Francoz et al and found to be slightly lower than central epithelial thickness measurements in the nondiabetic group in our work (48.8±3.0 µm versus 52.56±2.81 respectively).10 This is probably due to different instrumentation, as they used the Spectralis OCT (Heidelberg Engineering, Heidelberg, Germany), which — unlike the RT-Vue used in our study — does not automatically map and calculate corneal epithelial thickness, but is rather measured manually using cursors.10
Rosenburg et al studied 44 eyes of 23 diabetic patients and nine control eyes. Corneal epithelial thickness in diabetic patients was compared to that in nondiabetic patients using in vivo confocal microscopy, and like our results there was no statistically significant difference. Baseline thickness of the corneal epithelium in diabetics in their study was 51.9±4.6 µm, while our measurement for the diabetic central corneal epithelium was 53.36±3.00 µm. This minor difference is possibly due to the difference in measurement tools as well, since the epithelial thickness measurements were not readily calculated and mapped, but rather a snapshot of the desired view of the cornea was taken from the video and digitized, then calculated externally using separate computer software.17 Also, in 2014 Hatipoglu et al measured epithelial thickness in 47 type 2 diabetic patients using 3-D OCT (Topcon, Tokyo, Japan), which was found to be 51.9±4.9 µm, and found a tendency toward negative correlation between epithelial thickness and HbA1c levels. This was not found in our study, due to the fact that we excluded patients with retinopathy or proliferative changes. Those are the patients most likely to have significant thinning in the epithelium.15
Changes in epithelial thickness of healthy nondiabetic patients following phacoemulsification cataract surgery were monitored by Kanellopoulos et al in 2014 using the same AS-OCT machine used in our study, and their results had the same pattern, showing an initial significant increase in thickness in the central, middle, and peripheral corneal epithelium on the first day following surgery, followed by a significant decrease in epithelial thickness of all areas at the first week postoperatively. Also, like our findings, no changes were found between month 1 and 3 postoperative measurements when compared to preoperative baseline levels in the nondiabetic group.6
Ishikawa et al in 2018 used the corneal densitometry program of the Pentacam (Oculus, Wetzlar, Germany) to assess changes in corneal epithelial thickness (calling it “epithelial edema”) after uneventful phacoemulsification cataract surgery in 54 eyes of 34 patients in the first postoperative week. Their results were in parallel with our nondiabetic-group results: statistically significant increase in epithelial thickness on the first postoperative day that decreased markedly back to near-normal measures by the seventh day.20
Calabuig-Goena et al in 2016 examined 20 eyes of 20 patients using Cirrus HD-OCT (Carl Zeiss Meditec, Dublin, CA) to compare epithelial and nonepithelial corneal thickness 1 week and 1 month postoperatively with preoperative measurements. Like our results, that there was no statistically significant difference between first week 1 postoperative results and preoperative results. However, after 1 month they found decreased epithelial thickness that was statistically significant from the preoperative result, and they explained that corneal epithelial thinning was due to the earlier increase in nonepithelial thickness.21
Similar results were found by Zheng et al, who used SD-OCT to assess central epithelial thickness following phacoemulsification in cataract patients. Central epithelial thickness was found to decrease after an initial significant increase to near preoperative values at 3 days, became thinner at 5 and 7 days, and then returned to baseline at 14 days. Corneal basal epithelial cell density increased significantly postoperatively. Also, they found a negative correlation between CDVA and central epithelial thickness and CCT.7
In our work, in addition to assessing epithelial thickness changes in nondiabetic cataract patients, we monitored changes in epithelial thickness of diabetic patients, which were found to follow the same pattern as the nondiabetic group, having an initial significant increase on the first day followed by the same significant decrease at week 1 postoperatively. At 1 month and 3 months postoperatively, there were no significant differences from preoperative levels. However, unlike the nondiabetic group, the diabetic group’s month 1 postoperative measurements showed a significant difference from the first week 1 postoperative measurements. This can only mean that the epithelial edema was still resolving during the first month and that there was a delay in recovery of epithelial thickness in the diabetic group in contrast to the nondiabetic group.
Regarding corneal thickness, multiple studies have discussed the effect of phacoemulsification on CCT of normal and diabetic patients. In our study, changes to CCT at different postoperative intervals followed a pattern similar to those of the epithelium. CCT at the first day postoperatively had significantly increased in both groups, started to decrease by the first week, and returned to normal by the first month, then stayed normal at the 3-month measurement. Also, recovery of the corneal edema was slower in the diabetic group than the nondiabetic group. This goes along with what Morikubo et al, with similar findings in their work with CCT measurements in diabetic patients in comparison to healthy subjects.22 The statistically significant difference between the 1-month and 1-week postoperative measurements confirmed the delay in corneal edema recovery in diabetic patients compared to nondiabetic patients. This was also evident in the work of Morikuboet al in 2004.22
It is thought that in diabetics, aldose reductase causes intracellular accumulation of polyol, which acts as an osmotic agent and leads to swelling of the endothelial cells. Diabetes also reduces the activity of Na+K+ ATPase of the corneal endothelium, and this causes morphological and functional changes in diabetic corneas.23 The current study proved that the delayed recovery of the corneal thickness in diabetic patients would be mirrored in the epithelium as well. The molecular changes at the level of the corneal epithelium could be similar to endothelial cells, which merits detailed study. The delayed recovery of corneal and epithelial thickness in diabetics was reflected in delayed visual recovery up to 1 month postoperatively when compared to nondiabetics, with no statistically significant differences in final CDVA after 1 month. Multiple recent studies have shown no significant difference between diabetics and nondiabetics in visual outcomes after uneventful phacoemulsification, unless diabetic patients had had previous laser treatment or significant macular edema.24,25
The current study showed similar visual outcomes in diabetics in comparison to healthy patients, and this could be attributed to the exclusion of diabetic patients with retinopathy. HbA1c percentage, duration of diabetes, and type of diabetes showed no correlation in our study with increased epithelial or corneal thickness. However, Rosenburg et al (2000) showed a weak positive correlation between the severity of retinopathy and epithelial and corneal thicknesses.18 This again might be attributed to the small sample, random discrepancies in diabetes type, and the lack of patients with severe retinopathy in our study.
Limitations
Limitations of this study include the small sample and nonrandomization of the patients.
Conclusion
Phacoemulsification in diabetics showed slower recovery in terms of corneal and epithelial thickness measurements when compared to nondiabetic patients, with no effect on final visual outcomes.
Data-Sharing Statement
All data mentioned in the study are available and can be supplied upon request.
Ethics Approval
All procedures performed in the study were in accordance with the ethical standards of the Institutional Review Board and ethical committee at Cairo University and with the 1964 Declaration of Helsinki and its later amendments.
Consent to Participate
Informed consent was obtained from all participants in the study after thorough explanation of all procedures and benefits and expected side effects.
Consent for Publication
Informed consent was obtained from all participants in the study to have the results declared and published.
Disclosure
The authors report no conflicts of interest for this work.
References
1. Jaycock P, Johnston R, Taylor H, et al. The cataract national dataset electronic multi-centre audit of 55 567 operations: updating benchmark standards of care in the United Kingdom and internationally. Eye. 2009;23(1):38–49. doi:10.1038/sj.eye.6703015
2. Hayashi K, Hayashi H, Nakao F, Hayashi F. Risk factors for corneal endothelial injury during phacoemulsification. J Cataract Refract Surg. 1996;22(8):1079–1084. doi:10.1016/S0886-3350(96)80121-0
3. Walkow T, Anders N, Klebe S. Endothelial cell loss after phacoemulsification: relation to preoperative and intraoperative parameters. J Cataract Refract Surg. 2000;26(5):727–732. doi:10.1016/S0886-3350(99)00462-9
4. Reuschel A, Bogatsch H, Oertel N, Wiedemann R. Influence of anterior chamber depth, anterior chamber volume, axial length, and lens density on postoperative endothelial cell loss. Graefes Arch Clin Exp Ophthalmol. 2015;253(5):745–752. doi:10.1007/s00417-015-2934-1
5. Reuschel A, Bogatsch H, Barth T, Wiedemann R. Comparison of endothelial changes and power settings between torsional and longitudinal phacoemulsification. J Cataract Refract Surg. 2010;36(11):1855–1861. doi:10.1016/j.jcrs.2010.06.060
6. Kanellopoulos A, Asimellis G. Corneal epithelial remodeling following cataract surgery: three-dimensional investigation with anterior-segment optical coherence tomography. J Refract Surg. 2014;30(5):348–353. doi:10.3928/1081597X-20140416-04
7. Zheng T, Yang J, Xu J, He W, Lu Y. Near-term analysis of corneal epithelial thickness after cataract surgery and its correlation with epithelial cell changes and visual acuity. J Cataract Refract Surg. 2016;42(3):420–426. doi:10.1016/j.jcrs.2015.09.029
8. Simpson T, Fonn D. Optical coherence tomography of the anterior segment. Ocular Surface. 2008;6(3):117–127. doi:10.1016/S1542-0124(12)70280-X
9. Kanellopoulos AJ, Asimellis G. In vivo three-dimensional corneal epithelium imaging in normal eyes by anterior segment optical coherence tomography: a clinical reference study. Cornea. 2013;32(11):1493–1498. doi:10.1097/ICO.0b013e3182a15cee
10. Francoz M, Karamoko I, Baudouin C, Labbe A. Ocular surface epithelial thickness evaluation with spectral-domain optical coherence tomography. Invest Ophthalmol Vis Sci. 2011;52(12):9116–9123. doi:10.1167/iovs.11-7988g
11. Wang J, Aquavella J, Palakuru J, Chung S. Repeated measurements of dynamic tear distribution on the ocular surface after instillation of artificial tears. Invest Ophthalmol Vis Sci. 2006;47(8):3325–3329. doi:10.1167/iovs.06-0055
12 Feng Y, Varikooty J, Simpson T. Diurnal variation of corneal and corneal epithelial thickness measured using optical coherence tomography. Cornea. 2001;20(5):480–483. doi:10.1097/00003226-200107000-00008
13. Kanellopoulos A, Asimellis G. Introduction of quantitative and qualitative cornea optical coherence tomography findings induced by collagen cross-linking for keratoconus: a novel effect measurement benchmark. Clin Ophthalmol. 2013;7:329–335.
14. Kanellopoulos A, Aslanides I, Asimellis G. Correlation between epithelial thickness in normal corneas, untreated ectatic corneas, and ectatic corneas previously treated with CXL: is overall epithelial thickness a very early ectasia prognostic factor? Clin Ophthalmol. 2012;6:789–800.
15. Hatipoglu E, Ozkok A, Niyazoglu M, et al. Evaluation of corneal epithelial thickness in cases with type 2 diabetes mellitus. Transplantation Immunology. 2014. Insulin Signaling; Islet Biology; Pathophysiology/Complications.
16. Calvo‐Maroto A, Cerviño A, Perez‐Cambrodí R, García‐Lázaro S, Sanchis‐Gimeno J. Quantitative corneal anatomy: evaluation of the effect of diabetes duration on the endothelial cell density and corneal thickness. Ophthalmic Physiol Opt. 2015;35(3):293–298. doi:10.1111/opo.12191
17. Rosenberg M, Tervo T, Immonen I, Müller L, Grönhagen–Riska C, Vesaluoma M. Corneal structure and sensitivity in type 1 diabetes mellitus. Invest Ophthalmol Vis Sci. 2000;41(10):2915–2921.
18. Hamilton A, Ulbig M, Polkinghorne P. Epidemiology of diabetic retinopathy. BMJ Open Diabetes Res Care. 1996;1–15.
19. Leske MC, Chylack LT, Sperduto R, Khu P, Wu S-Y, McCarthy D. Evaluation of a lens opacities classification system. Arch Ophthalmol. 1988;106(3):327. doi:10.1001/archopht.1988.01060130353019
20. Ishikawa S, Kato N, Takeuchi M. Quantitative evaluation of corneal epithelial edema after cataract surgery using corneal densitometry: a prospective study. BMC Ophthalmol. 2018;18(1):334. doi:10.1186/s12886-018-0998-5
21. Calabuig-Goena M, Lopez-Miguel A, Marques-Fernandez V, Coco-Martın M, Iglesias-Cortinas D, Maldonado M. Early changes in corneal epithelial thickness after cataract surgery – Pilot Study. Curr Eye Res. 2016;41(3):311–317. doi:10.3109/02713683.2015.1014565
22. Morikubo S, Takamura Y, Kubo E, Tsuzuki S, Akagi Y. Corneal changes after small-incision cataract surgery in patients with diabetes mellitus. Arch Ophthalmol. 2004;122(7):966–969. doi:10.1001/archopht.122.7.966
23. Mathew P, David S, Thomas N. Endothelial cell loss and central corneal thickness in patients with and without diabetes after manual small incision cataract surgery. Cornea. 2011;30(4):424–428. doi:10.1097/ICO.0b013e3181eadb4b
24. Han M, Song W, Conti T, et al. Visual acuity outcomes after cataract extraction with intraocular lens implantation in eyes with diabetic retinopathy. Ophthalmology. 2020;4(4):351–360. doi:10.1016/j.oret.2019.12.018
25. Liu L, Herrinton L, Alexeeff S, et al. Visual outcomes after cataract surgery in patients with type 2 diabetes. J Cataract Refract Surg. 2019;45(4):404–413. doi:10.1016/j.jcrs.2018.11.002
 © 2020 The Author(s). This work is published and licensed by Dove Medical Press Limited. The
full terms of this license are available at https://www.dovepress.com/terms
and incorporate the Creative Commons Attribution
- Non Commercial (unported, 3.0) License.
By accessing the work you hereby accept the Terms. Non-commercial uses of the work are permitted
without any further permission from Dove Medical Press Limited, provided the work is properly
attributed. For permission for commercial use of this work, please see paragraphs 4.2 and 5 of our Terms.
© 2020 The Author(s). This work is published and licensed by Dove Medical Press Limited. The
full terms of this license are available at https://www.dovepress.com/terms
and incorporate the Creative Commons Attribution
- Non Commercial (unported, 3.0) License.
By accessing the work you hereby accept the Terms. Non-commercial uses of the work are permitted
without any further permission from Dove Medical Press Limited, provided the work is properly
attributed. For permission for commercial use of this work, please see paragraphs 4.2 and 5 of our Terms.