Back to Journals » Clinical Ophthalmology » Volume 14
Electroretinogram Changes Following Sequential Panretinal Photocoagulation for Proliferative Diabetic Retinopathy
Authors Khojasteh H, Amini Vishte R, Mirzajani A ![]() , Khalili Pour E
, Khalili Pour E ![]() , Bazvand F
, Bazvand F ![]() , Riazi-Esfahani H
, Riazi-Esfahani H ![]() , Mirghorbani M
, Mirghorbani M ![]() , Modjtahedi BS
, Modjtahedi BS
Received 7 February 2020
Accepted for publication 13 March 2020
Published 30 March 2020 Volume 2020:14 Pages 967—975
DOI https://doi.org/10.2147/OPTH.S248678
Checked for plagiarism Yes
Review by Single anonymous peer review
Peer reviewer comments 2
Editor who approved publication: Dr Scott Fraser
Hassan Khojasteh,1 Rasoul Amini Vishte,2 Ali Mirzajani,2 Elias Khalili Pour,1 Fatemeh Bazvand,1 Hamid Riazi-Esfahani,1 Masoud Mirghorbani,1 Bobeck S Modjtahedi3– 5
1Department of Ophthalmology, Farabi Eye Research Center, Farabi Eye Hospital, Tehran University of Medical Sciences, Tehran, Iran; 2Department of Optometry, School of Rehabilitation Sciences, Iran University of Medical Sciences, Tehran, Iran; 3Department of Ophthalmology, Southern California Permanente Medical Group, Baldwin Park, CA, USA; 4Department of Research and Evaluation, Southern California Permanente Medical Group, Pasadena, CA, USA; 5Eye Monitoring Center, Kaiser Permanente Southern California, Baldwin Park, CA, USA
Correspondence: Hassan Khojasteh Email [email protected]
Purpose: To evaluate changes in electroretinogram (ERG) response over the course of multiple sessions of panretinal photocoagulation (PRP) in patients with proliferative diabetic retinopathy (PRP).
Methods: A prospective cohort study of 11 patients with PDR who required PRP was conducted. PRP was completed over three sessions. Each patient had five ERGs done: baseline, 1 week after each PRP session, and 6 weeks after the last session of PRP. Dark-adapted 0.01 ERG, Dark-adapted 3 ERG, Dark-adapted 10 ERG, Light- adapted 3 ERG, and Light-adapted 30 Hz flicker ERG were done. The mean change in a- and b-wave amplitudes as well as implicit times compared to baseline was analyzed.
Results: A significant reduction in peak amplitudes of both a- and b-waves and delay in latencies were observed in all responses (p< 0.05). The absolute amplitude reduction and delay in latency were higher for scotopic b-waves (p< 0.05). The root mean square (RMS) of Dark-adapted 10.0 ERG (p< 0.05) and total mean amplitude changes of a- and b-waves (p< 0.001) were reduced after each laser session; however, the magnitude of change was not different between the first, second, or third sessions of PRP, and each session showed a similar deterioration rate of ERG parameters comparing to each other (p=0.4 for RMS and p=0.2 for total mean amplitude changes). In addition, the results indicated recovery of the amplitude and latency of ERG waves after 6 weeks from the final treatment (p< 0.001) although not to baseline levels.
Conclusion: ERG findings following PRP show reduced retinal function after each session which partially recovers by 6 weeks after the completion of therapy. Clinicians should be mindful of these changes when planning the treatment course for patients with PDR.
Keywords: diabetic retinopathy, electroretinogram, panretinal photocoagulation, laser
Introduction
Proliferative diabetic retinopathy (PDR) is an important cause of vision loss.1 The principle treatments for PDR are panretinal photocoagulation (PRP) and, more recently, intravitreal injections of anti-vascular endothelial growth factor (VEGF) agents which have both been shown to reduce the risk of vision loss.2 PDR treatment can utilize PRP, anti-VEGF, or both.2
Laser treatment to the peripheral ischemic retina induces neovascular regression and reduces angiogenesis;3 however, PRP is also associated with functional consequences including reductions in peripheral and night vision.4 Electroretinograms (ERGs), which measure retinal response to light stimuli, have been used as an objective measure of retinal function.5 The therapeutic window for PRP wherein the risk of secondary sequelae is outweighed by the treatment benefit is not well defined. Although prior studies have investigated the effect of PRP on ERG response, post-treatment response was assessed after completion of full PRP treatment.5–9 The study presented herein sought to characterize how ERG measures change over the course of sequential PRP treatments in an effort to quantify the additive effect of progressive laser treatment.
Materials and Methods
This prospective cohort study was conducted after attaining Institutional Review Board approval from the Farabi Eye Hospital, Tehran University of Medical Sciences. The study adhered to the Declaration of Helsinki. Written informed consent was obtained from all the patients. Patients with a history of unilateral high-risk PDR demonstrated on fluorescein angiography, were included. Eyes with PDR had a diabetic retinopathy severity scale (DRSS) of 61 −71 and a DRSS of 47–53 in the fellow eye. Patients with greater severity scores that might require additional interventions and patients with significant symmetry in DRSS between their two eyes were excluded from the analysis. Furthermore, patients with a prior history of intravitreal injections, retinal lasers, significant media opacity, ocular abnormality that might impact ERG measurements (including more than 3 diopters of myopia), prior history of retinal detachment, center involving diabetic macular edema (that may require imminent treatment), or prior history of vitrectomy were excluded from this study.
The purpose of the study was to attempt to isolate the effect of PRP on ERG measures. The fellow, non-PDR, eye was used as a control since diabetic retinopathy can impact ERG measures and there can be a high degree intra-subject variability.
Patients received three sessions of PRP separated by 1-week intervals. PRP was conducted at the slit lamp using the Ellex Integre Duo Photocoagulator (Mawson Lakes, SA, Australia) and a wide field contact lens (Volk SuperQuad 160 Panfundus lens, Volk Co., Mentor, OH, USA). Scatter PRP was done with the following settings: 532 nm green wavelength, spot size of 500 μm, duration of 0.1 s, and power of 250 to 400 mW (titrating to achieve a grey-white burn). Patients received 350–400 spots with each session. Inferior-inferior/temporal retinal was treated at the first session followed by nasal and superior-superior/temporal quadrant.
ERG was performed using the MonPack3 system (Metrovision, Pérenchies, France). ERGs were done at baseline (pre-treatment), 1 week after each PRP session, and 6 weeks after the last PRP treatment. Dark-adapted 0.01 ERG, Dark-adapted 3 ERG, Dark-adapted 10 ERG, Light-adapted 3 ERG, and Light-adapted 30 Hz flicker ERG were recorded. ERGs were done in accordance with International Society for Clinical Electrophysiology of Vision (ISCEV) standard in an electrically shielded room to avoid additional sound and noise.10 All ERG tests were performed by an experienced examiner and the peaks of the wave amplitude were selected. To quantify the overall response waveform, root mean square (RMS) was calculated which was defined as the area under the curve [amplitude (nV)] in Dark-adapted 10 ERG.
Statistical Analysis
All statistical analysis was performed using IBM SPSS Statistics for Windows software version 21.0 (IBM Corp., Armonk, NY). The mean value of a-wave and b-wave amplitude, as well as latency, were calculated and compared between the first and second PRP session, the first and third PRP sessions, and the second and third PRP sessions using paired t-test. In addition, the mean changes in the amplitude and latency of the three different laser sessions were compared with the pre-treatment and 6 weeks post-treatment sessions using the paired t-test.
Results
Eleven eyes with PDR were included in this study. Nine subjects were female (82%) and the average age was 57.6± 10.3 years old. Tables 1 and 2 provide summaries of the mean value and percentage of change in a- and b-waves amplitudes and latencies following PRP. Seven comparisons were conducted for each ERG parameter: after first session versus pre-treatment baseline, after second session versus pre-treatment baseline, after third session versus pre-treatment baseline, after first session versus after second session, after second session versus after third session, after third session versus 6 weeks after third session, and 6 weeks after third session versus pre-treatment baseline. Of note, no significant changes in ERG parameters of control contralateral eyes were seen during the study.
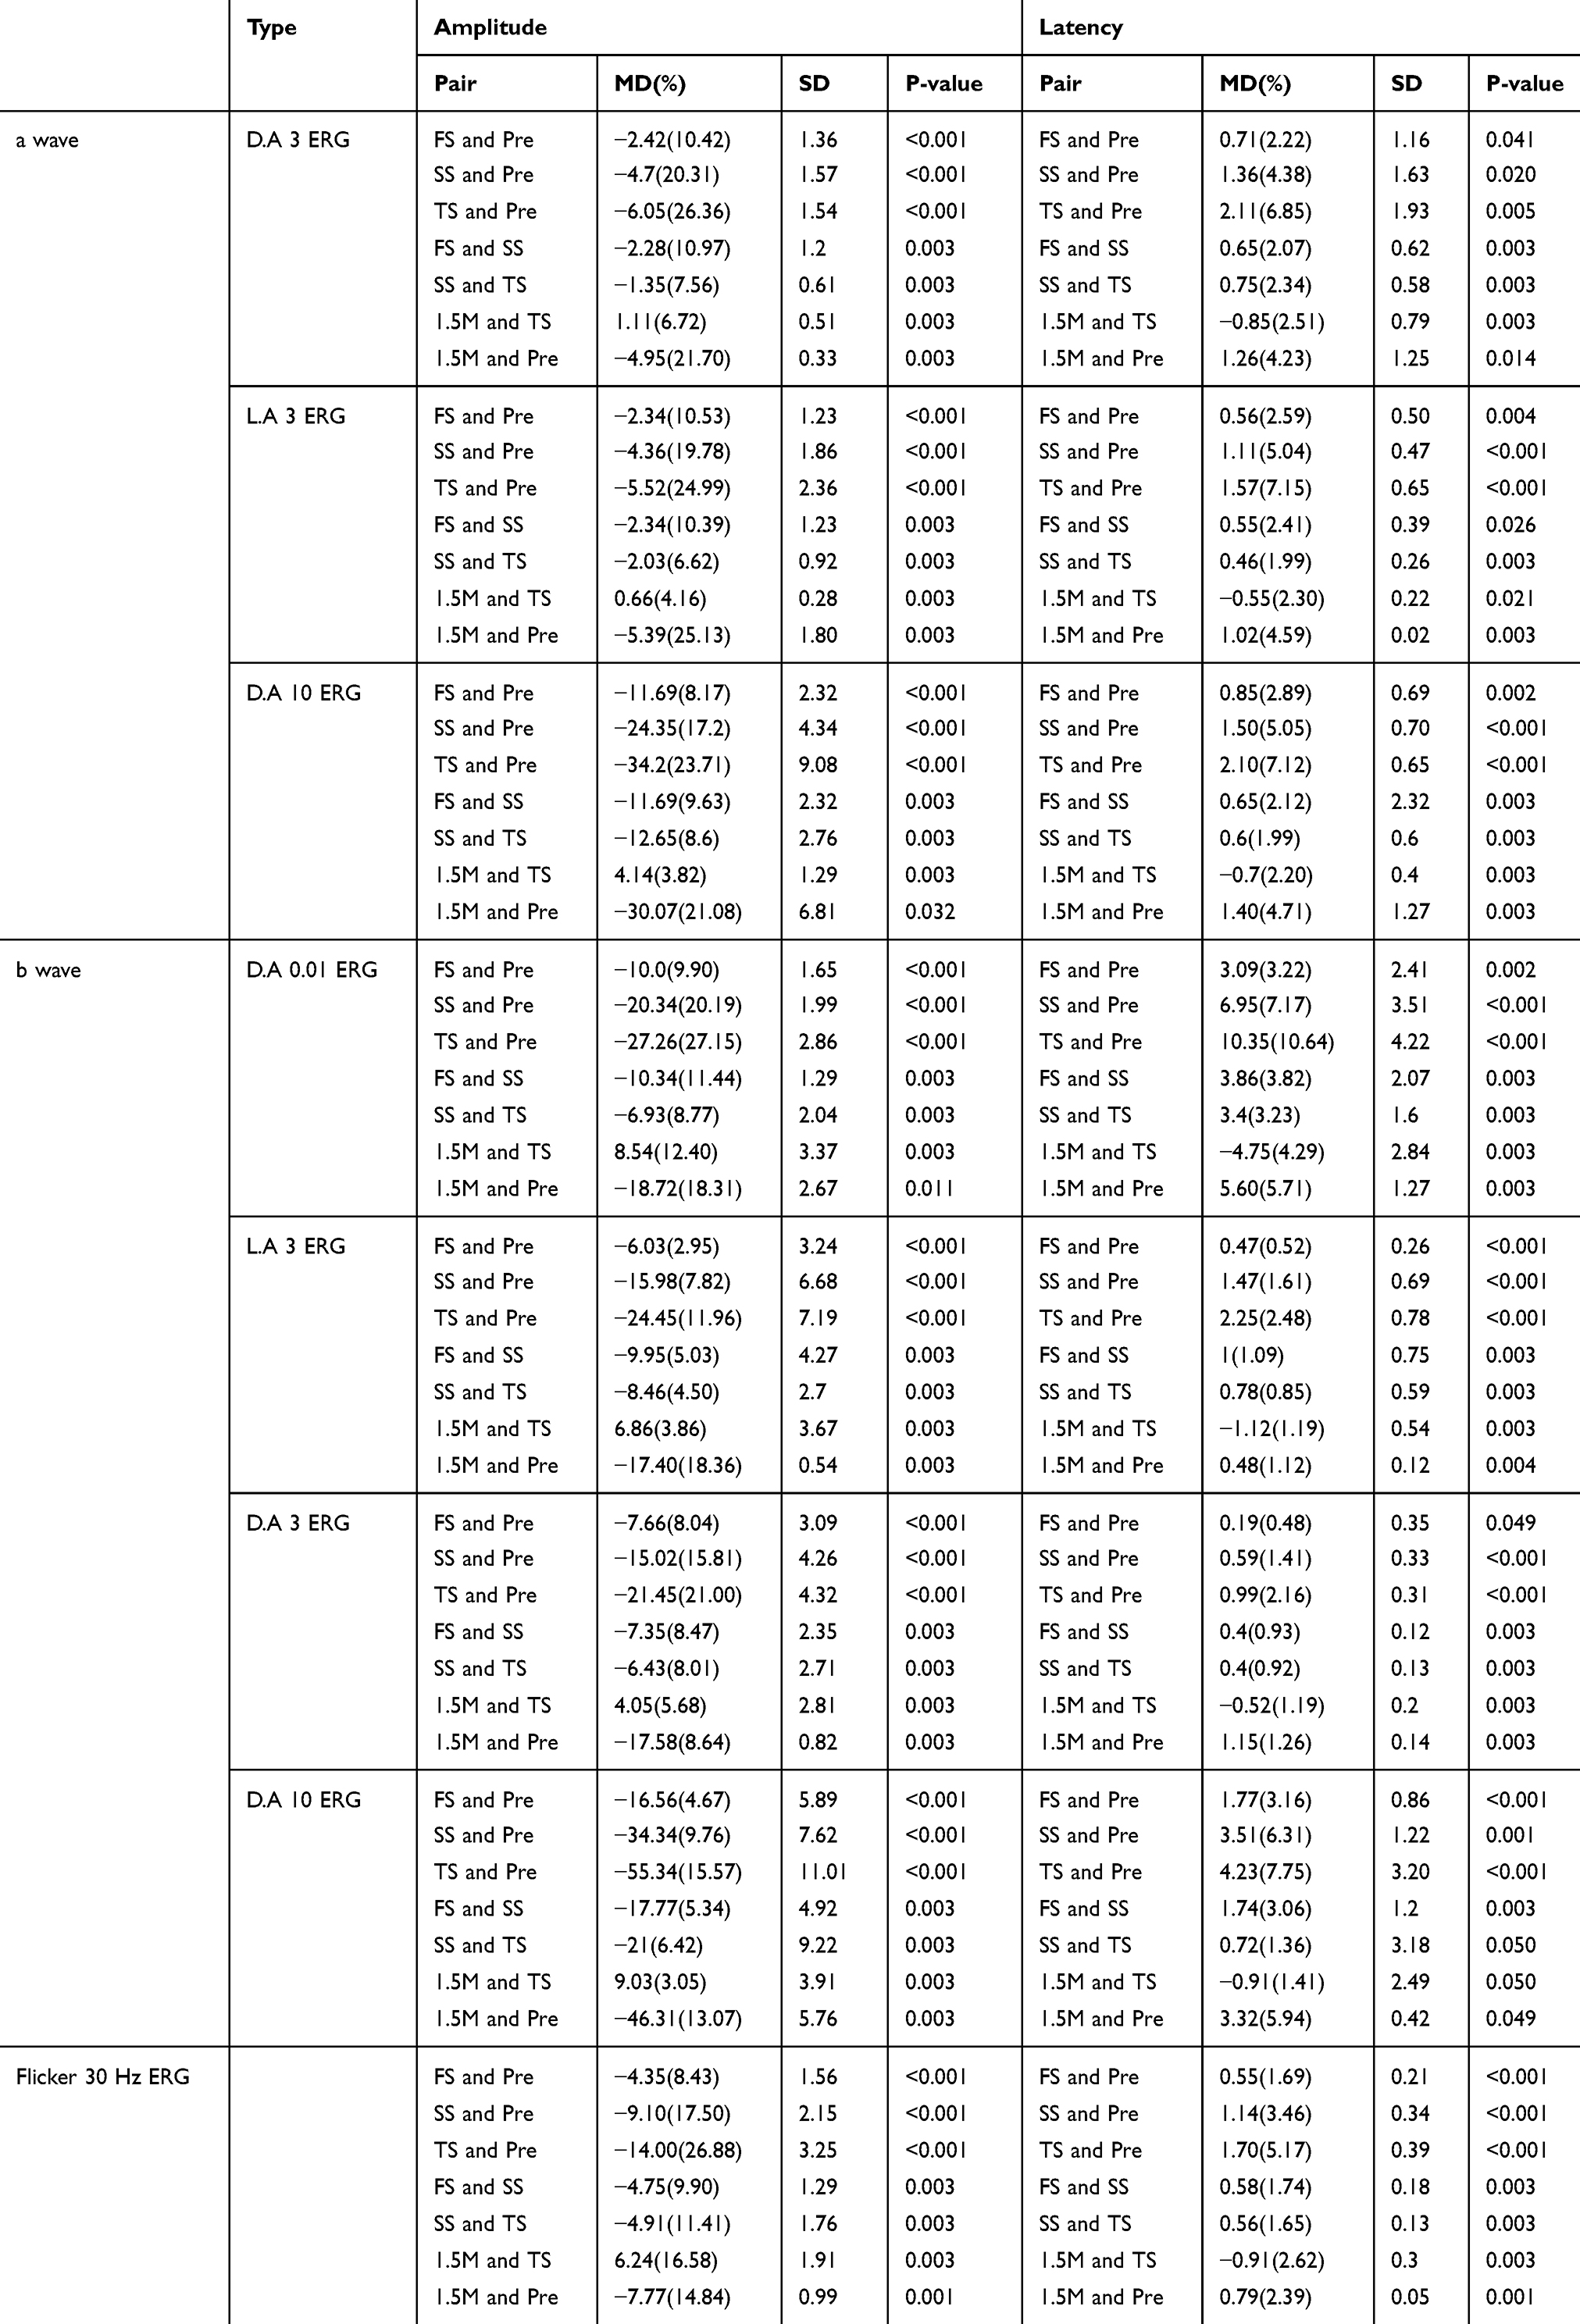 |
Table 1 Changes in a-Wave, b-Wave, and 30 Hz Flicker in Different Time Points |
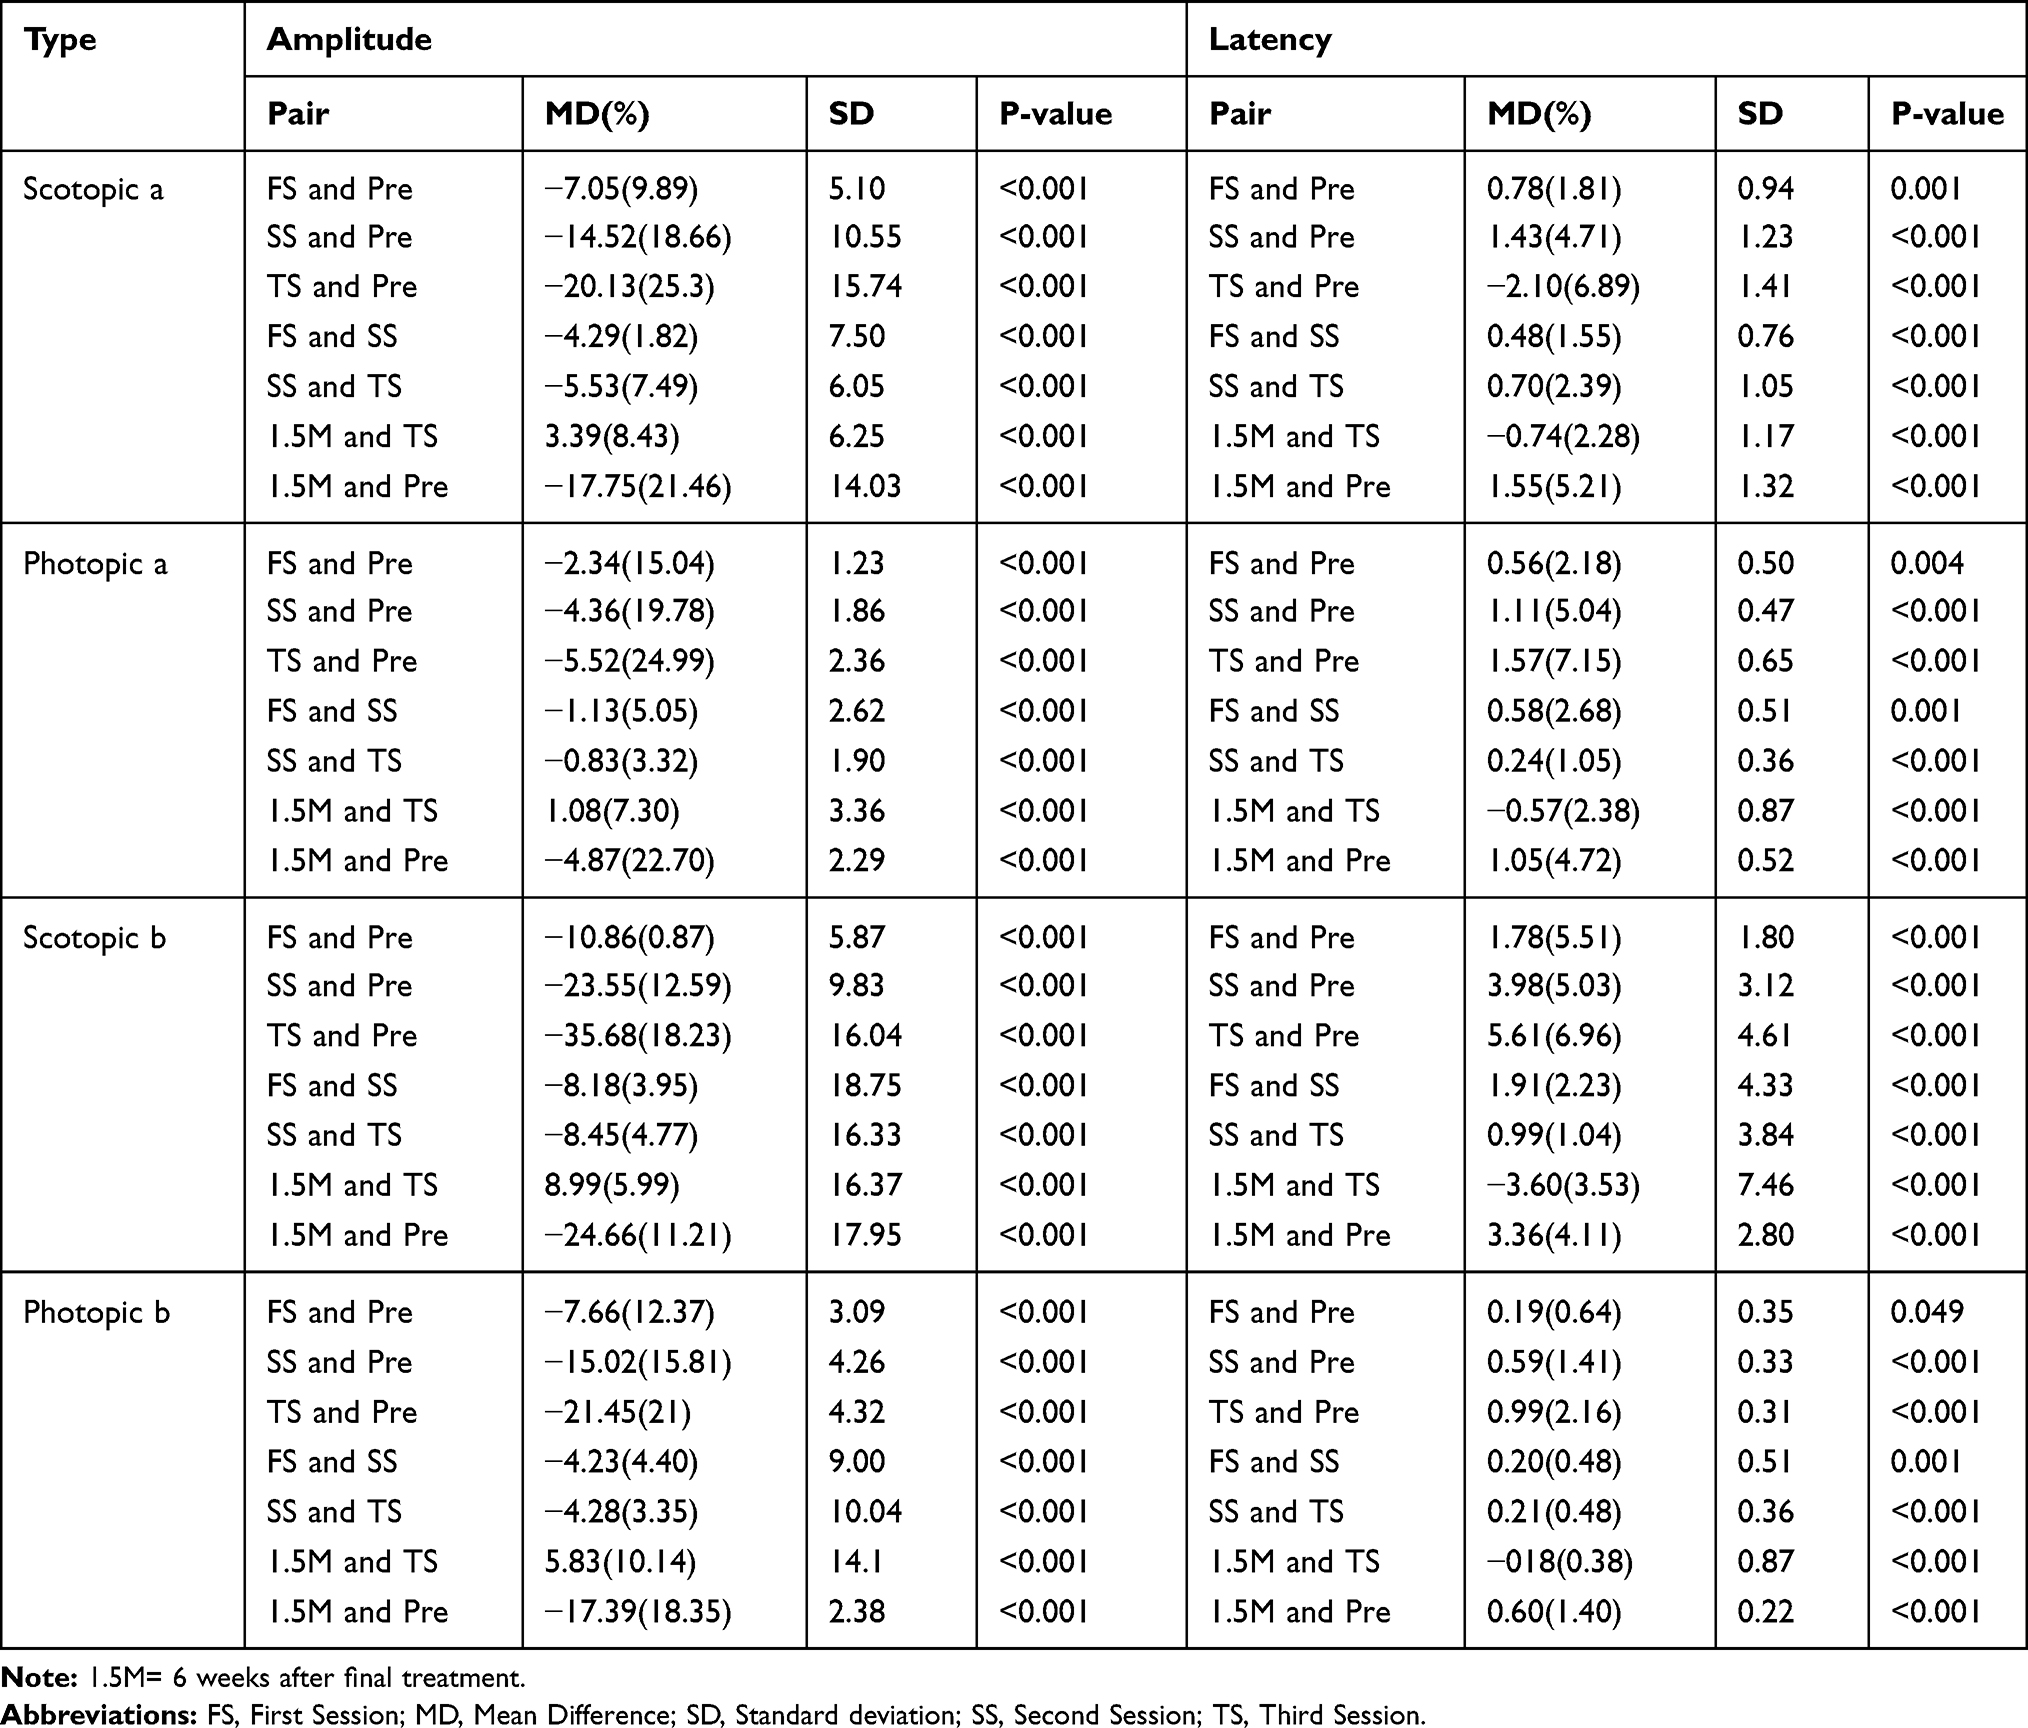 |
Table 2 Changes in Scotopic and Photopic a-Wave and b-Wave in Different Time Points |
There was a reduction in a- and b-wave amplitude 1 week after each PRP session on Dark-adapted 3.0, Light-adapted 3.0 and Dark-adapted 10 responses when compared to baseline ERG and the immediately preceding PRP treatment (P<0.005). There was a statistically significant increase in a- and b-wave amplitude 6 weeks after the last PRP session when compared to the ERG taken 1 week after the last PRP session (P<0.005); however, the amplitudes remained lower than baseline ERG values (P<0.05). Similarly, a- and b-wave latencies increased 1 week after each treatment session. Although the latencies decreased between the last session of PRP and 6 weeks follow-up ERG, they still remained longer than baseline ERG values.
A similar pattern was observed on 30 Hz flicker amplitude and latencies with evidence of reduced function 1 week after each PRP session with some recovery noted 6 weeks after the final PRP treatment that did not reach baseline values.
Variations in the mean RMS of amplitude in Dark-Adapted 10 ERG are shown in Figure 1. Each laser session resulted in reduction of amplitude RMS (p<0.001) 1 week after treatment and a relative improvement was seen 6 weeks after the third treatment session (p<0.05); however, comparing inter-sessions RMS change, the reduction in magnitude was not different among these three sessions (p=0.4).
|
Figure 1 Retinal functional changes in D.A 10 ERG test during laser treatment sessions Shown in Root Mean Square (RMS). |
ERG changes in scotopic and photopic values are outlined in Table 2. Both a- and b-wave amplitudes decreased 1 week after each PRP session but demonstrated recovery at the final follow-up visit 6 weeks after the last PRP treatment. Latencies for both a- and b-waves increased 1 week after each PRP session but decreased at the final ERG measurement. Although there was some recovery in amplitudes and latencies between the last PRP session and the last ERG 6 weeks post-treatment, these values did not return to baseline. These variations were significantly higher for absolute values of b-wave compared to the a-wave (P<0.05).
The percentage change in a- and b-wave amplitudes at each post-PRP visit when compared to baseline pre-treatment ERG is outlined in Table 3. When the total mean changes in percentage were compared, a-wave amplitude reduction was found to be higher than the b-wave amplitude reduction. The amplitude changes in Table 3 represent cumulative measurements since retinal tissue changes after each session sums with preceding treatments. It should be noted that the difference between sessions involves the summation of prior retinal tissue loss (resulting in reduced amplitude) with the possible post-treatment recovery in amplitudes which may be beginning by the second post-treatment week.
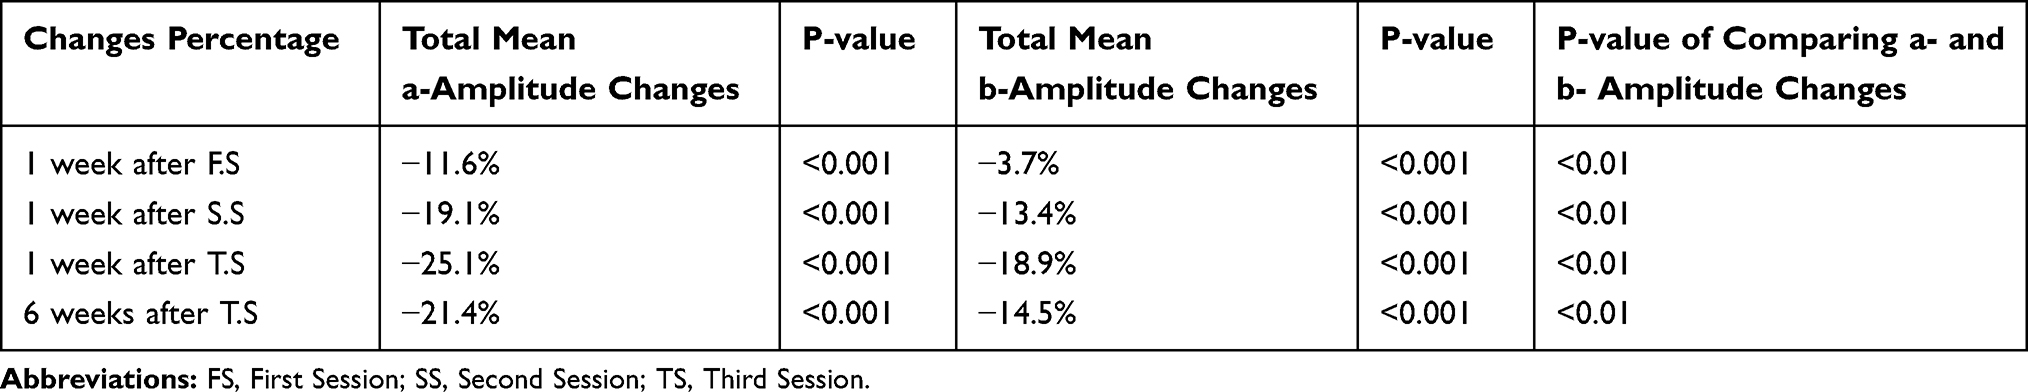 |
Table 3 The Overall Amplitude Changes in Percentage After Each Laser Session and 1.5 Months After Final Treatment Compared to Pretreatment Values |
Figure 2 provides a graphical breakdown of ERG changes in a sample patient from this study.
|
Figure 2 Full-field ERG of a patient enrolled in this study according to ISCEV −2015 standards. The time of ERG recording from baseline (before PRP) to 6 weeks after the final session of PRP has been shown in columns (A–E). Three upper rows are related to dark-adapted states (DA) and 2 lower rows are related to light-adapted states (LA) and between them magnified view of DA 10.0 wave changes of this patient over time have been shown in an ellipsoid inset. As have been shown, a- and b-waves amplitude decrease from baseline to 3ʹrd session after PRP (A–D) and these amplitudes recover and increase 6 weeks after the final session of PRP (E). |
Discussion
PRP is a well-established treatment for PDR11 and has been shown to reduce the risk of severe vision loss in patients with high-risk PDR by 50%.12 During PRP light energy is absorbed by the retinal pigment epithelium (RPE) and then converted to heat energy, which increases the temperature of the tissue. This energy destroys the tissue and leads to the death of retinal cells. The destruction of ischemic extra-macular retina reduces the VEGF drive within the retina, thereby limiting the stimulant for neovascularization.13 Although ultimately beneficial in reducing vision loss from progressive retinopathy, PRP does result in retinal tissue damage. Functioning, albeit ischemic, retina is sacrificed to reduce the risk of more significant harm from progressive diabetic retinopathy. The risk of post-PRP macular edema reduced peripheral vision, and reduced night vision deficits remain concerns.14
ERGs provide an objective and quantifiable measure of retinal function: a-waves are derived from the cone and rod cells of the outer photoreceptor layers whereas the b-waves are generated from the inner retina, predominantly the Muller and ON-bipolar cells.15
Prior studies have demonstrated loss of ERG amplitude following PRP, with conflicting results in the relative changes of a- and b-waves. Liang et al7 and Han et al9 found a greater reduction in b wave absolute amplitudes than a wave, with Perlman et al8 demonstrating proportional changes in the absolute amplitudes of both waves. Gjotterberg et al6 demonstrated a greater reduction in the percentage change of a-wave amplitudes. The results outlined herein demonstrated a greater absolute change in b-wave amplitude, although there was a greater percentage change in a-wave amplitude.
Reported changes in b-wave amplitudes after PRP vary considerably. Frank et al16 reported an average decrease in b-wave amplitude of 40% in their 24 patients 6 weeks after PRP while also finding that 40% of the outer retina was destroyed by PRP. In the present study, the average reduction of amplitude at 6 weeks post-treatment was 21.4% for a-waves and 14.5% for b-waves. Ogden et al recorded ERGs of 14 patients with PDR before and 8 weeks after the PRP17 and found a wide range of variations in post-treatment ERG values. Liang et al7 examined differences in ERG response 1 month following argon or xenon arc laser treatment in patients. Eleven patients had one eye treated with argon laser and the other with xenon arc laser. There was a similar reduction in ERG parameters between eyes treated with either laser unless the burned retinal area treated with xenon arc laser was more than twice the size compared to the area treated with argon laser in the contralateral eye. Liang et al7 also found a reduction of b wave, and to a less extent, a-wave amplitudes regardless of laser type indicating damage to both the outer and inner retinal layers following ERG. John and Devi18 performed PRP on 53 diabetic patients with ERGs taken pre-treatment, 1 month post-treatment, and 3 months post-treatment. The authors reported a global loss of retinal function which was variable and was reflected in the statistically significant reduction in amplitudes of the ERG without a significant change in latencies which contrasts to the findings of the present study which shows reduced a- and b-wave amplitudes as well as prolonged latencies after PRP. The average reduction of amplitude at 3 months was 27.2% for a-waves and 14.4% for b-waves in John and Devi’s study, while the changes to the implicit time were not significant.
Imai and Iijima19,20 reported a dramatic reduction in the amplitude and a delay in the implicit time of rabbit eyes 1 day after PRP with a partial recovery of amplitude 4 weeks after treatment. The present study demonstrated partial recovery of the amplitudes and the latencies 6 weeks after the final treatment. Capoferri et al5 performed ERGs in 16 patients with PDR prior to PRP, in the interval between laser sessions, within 36 hrs of the final session and 4 months later. The analysis of the results showed a significant decrease in the peak amplitudes of both a- and b-waves in photopic and dark-adapted conditions that occurred as early as between treatment sessions and remained depressed at 4-month follow-up. The lack of recovery in Capoferri et al’s study5 contrasts with the present findings which demonstrated partial recovery of retinal function 6 weeks after completion of PRP. Considering pathophysiology of the PRP, not only functional tissue loss would be occurring, but also the burning RPE and retina is associated with cytokine release and subsequent inflammation cascades. Hence, inflammation and retinal tissue loss are two main components of treatment-related ERG drops. Retinal tissue loss is an irreversible process; however, the inflammation would be resolved over the time which results in improved ERG parameters 6 weeks (in this study) after completion of PRP. It must be noted that glycemic control may affect the ERG parameters; in this study, glycemic status variable was controlled indirectly, by consideration of the stage of diabetic retinopathy through DRSS. One possible explanation for lack of recovery in Capoferri et al’s study5 may be uncontrolled glycemic status and/or post-laser inflammation which might affect ERG changes after the completion of PRP.
There were several limitations to this study including its small sample size, which was a result of the strict inclusion criteria. Indeed, considering the small sample size and the nature of variability in ERG recordings and interpretations, the study may not be too strong. Also, future studies may utilize ultrawide field imaging to better quantify the amount of ablation delivered during PRP treatments and its correlation to ERG changes.
Comparisons between studies that explore post-PRP ERG changes are complicated by differences in PRP treatment and ERG testing protocols, including type of ERG machine, as well as differences in follow-up intervals. Anti-VEGF therapy is increasingly employed as a treatment for PDR, either as monotherapy or, more commonly, as an adjunct to PRP. PRP remains popular because the treatment effect is longer than anti-VEGF and because anti-VEGF therapy requires a high degree of patience compliance for frequent injections.21 Combination treatment with PRP and anti-VEGF is a popular treatment option that allows for more rapid regression of neovascularization via anti-VEGF with more long-term protection against recurrent neovascularization via PRP. Combination PRP and intravitreal ranibizumab treatment showed less adverse effects on retinal functions than PRP alone, possibly because less intense PRP treatment was required.22 PRP is typically titrated to ensure regression or stabilization of neovascularization, and the ideal amount of treatment is unknown. In this study, alternations in retinal function after PRP were demonstrated. These findings help quantify the degree of ERG loss after each session of 350–400 spots of PRP treatment. A better understanding of the degree of retinal damage following PRP may be helpful in determining the ideal amount of laser treatment that balances regression of retinal neovascularization while minimizing reductions in retinal function.
Ethics and Consent Statement
This research follows the principles of the Helsinki Declaration. After explaining to the patients the aim of the study and the probable outcome, informed consent was obtained from all the patients before the intervention.
Disclosure
Dr. Modjtahedi receives research support from Genetech. None of the remaining authors had conflict of interests. No funding was received for this research.
References
1. Davidson JA, Ciulla TA, McGill JB, Kles KA, Anderson PW. How the diabetic eye loses vision. Endocrine. 2007;32(1):107–116. doi:10.1007/s12020-007-0040-9
2. Figueira J, Fletcher E, Massin P, et al. Ranibizumab plus panretinal photocoagulation versus panretinal photocoagulation alone for high-risk proliferative diabetic retinopathy (PROTEUS study). Ophthalmology. 2018;125(5):691–700. doi:10.1016/j.ophtha.2017.12.008
3. Evans JR, Michelessi M, Virgili G. Laser photocoagulation for proliferative diabetic retinopathy. Cochrane Database Syst Rev. 2014;11:Cd011234.
4. Photocoagulation treatment of proliferative diabetic retinopathy. Clinical application of Diabetic Retinopathy Study (DRS) findings, DRS report number 8. The Diabetic Retinopathy Study Research Group. Ophthalmology. 1981;88(7):583–600.
5. Capoferri C, Bagini M, Chizzoli A, Pece A, Brancato R. Electroretinographic findings in panretinal photocoagulation for diabetic retinopathy. Graefes Arch Clin Exp Ophthalmol. 1990;228(3):232–236. doi:10.1007/BF00920026
6. Gjötterberg M, Blomdahl S. Human electroretinogram after argon laser photocoagulation of different retinal areas. Ophthalmic Res. 1981;13(1):42–49. doi:10.1159/000265106
7. Liang JC, Fishman GA, Huamonte FU, Anderson RJ. Comparative electroretinograms in argon laser and xenon arc panretinal photocoagulation. Br J Ophthalmol. 1983;67(8):520–525. doi:10.1136/bjo.67.8.520
8. Perlman I, Gdal-On M, Miller B, Zonis S. Retinal function of the diabetic retina after argon laser photocoagulation assessed electroretinographically. Br J Ophthalmol. 1985;69(4):240–246. doi:10.1136/bjo.69.4.240
9. Han YK, Lee SH, Moon CH, Ohn Y-H. Changes in electroretinogram parameters after panretinal photocoagulation in diabetic retinopathy. Soonchunhyang Med Sci. 2014;20(1):1–6. doi:10.15746/sms.14.001
10. McCulloch DL, Marmor MF, Brigell MG, et al. ISCEV standard for full-field clinical electroretinography (2015 update). Doc Ophthalmol. 2015;130(1):1–12. doi:10.1007/s10633-014-9473-7
11. Abu El-Asrar AM. Evolving strategies in the management of diabetic retinopathy. Middle East Afr J Ophthalmol. 2013;20(4):273–282. doi:10.4103/0974-9233.119993
12. Photocoagulation for diabetic macular edema: early treatment diabetic retinopathy study report number 1 early treatment diabetic retinopathy study research group. Arch Ophthalmol. 1985;103(12):1796–1806. doi:10.1001/archopht.1985.01050120030015
13. Royle P, Mistry H, Auguste P, et al. Pan-retinal photocoagulation and other forms of laser treatment and drug therapies for non-proliferative diabetic retinopathy: systematic review and economic evaluation. Health Technol Assess. 2015;19(51):
14. Reddy SV, Husain D. Panretinal photocoagulation: a review of complications. Semin Ophthalmol. 2018;33(1):83–88. doi:10.1080/08820538.2017.1353820
15. Duncan J. Electrophysiologic testing in disorders of the retina, optic nerve, and visual pathway. Br J Ophthalmol. 2001;85(8):1013. doi:10.1136/bjo.85.8.1013e
16. Frank RN. Visual fields and electroretinography following extensive photocoagulation. Arch Ophthalmol. 1975;93(8):591–598. doi:10.1001/archopht.1975.01010020575004
17. Ogden TE, Callahan F, Riekhof FT. The electroretinogram after peripheral retinal ablation in diabetic retinopathy. Am J Ophthalmol. 1976;81(4):397–402. doi:10.1016/0002-9394(76)90293-2
18. John CB, Devi PG. Electrophysiological study of changes in retinal function following pan retinal photocoagulation in patients with diabetic retinopathy. Int J Recent Trends Sci Technol. 2015;14(2):367–374.
19. Imai M, Iijima H. Recovery of photopic ERG from pressure-induced retinal ischemia in rabbit eyes. Jpn J Ophthalmol. 1995;39(3):254–259.
20. Imai M, Iijima H. Effects of panretinal photocoagulation on photopic ERG in normal rabbit eyes. Jpn J Ophthalmol. 1995;39(2):120–123.
21. Messias A, Filho JAR, Messias K, et al. Electroretinographic findings associated with panretinal photocoagulation (PRP) versus PRP plus intravitreal ranibizumab treatment for high-risk proliferative diabetic retinopathy. Documenta ophthalmologica. Adv Ophthalmol. 2012;124:225.
22. Messias K, Barroso RM, Jorge R, Messias A. Retinal function in eyes with proliferative diabetic retinopathy treated with intravitreal ranibizumab and multispot laser panretinal photocoagulation. Documenta ophthalmologica. Adv Ophthalmol. 2018;137(2):121–129.
 © 2020 The Author(s). This work is published and licensed by Dove Medical Press Limited. The
full terms of this license are available at https://www.dovepress.com/terms
and incorporate the Creative Commons Attribution
- Non Commercial (unported, 3.0) License.
By accessing the work you hereby accept the Terms. Non-commercial uses of the work are permitted
without any further permission from Dove Medical Press Limited, provided the work is properly
attributed. For permission for commercial use of this work, please see paragraphs 4.2 and 5 of our Terms.
© 2020 The Author(s). This work is published and licensed by Dove Medical Press Limited. The
full terms of this license are available at https://www.dovepress.com/terms
and incorporate the Creative Commons Attribution
- Non Commercial (unported, 3.0) License.
By accessing the work you hereby accept the Terms. Non-commercial uses of the work are permitted
without any further permission from Dove Medical Press Limited, provided the work is properly
attributed. For permission for commercial use of this work, please see paragraphs 4.2 and 5 of our Terms.