Back to Journals » International Journal of Nanomedicine » Volume 11
Effects of Carbopol® 934 proportion on nanoemulsion gel for topical and transdermal drug delivery: a skin permeation study
Authors Zheng Y, Ouyang WQ, Wei YP, Syed SF, Hao CS, Wang BZ, Shang YH
Received 8 August 2016
Accepted for publication 24 September 2016
Published 10 November 2016 Volume 2016:11 Pages 5971—5987
DOI https://doi.org/10.2147/IJN.S119286
Checked for plagiarism Yes
Review by Single anonymous peer review
Peer reviewer comments 2
Editor who approved publication: Dr Linlin Sun
Yin Zheng,1 Wu-Qing Ouyang,1 Yun-Peng Wei,1 Shahid Faraz Syed,2,3 Chao-Shuang Hao,1 Bo-Zhen Wang,4 Yan-Hong Shang1,5
1Department of Basic Veterinary Sciences, College of Veterinary Medicine, 2Department of Preventive Veterinary Medicine, College of Veterinary Medicine, Northwest A&F University, Yangling, Shaanxi; 3Faculty of Veterinary and Animal Sciences, Lasbella University of Agriculture Water and Marine Sciences, Uthal Baluchistan, Pakistan; 4College of Animal Science and Technology, Shihezi University, Shihezi, Xinjiang, 5College of Animal Science and Veterinary Medicine, Henan Agricultural University, Zhengzhou, Henan, China
Abstract: Nanoemulsions (NEs) are used as transdermal drug delivery systems for systematic therapeutic purposes. We hypothesized that the skin permeation profile of an NE could be modulated by incorporating it into a hydrogel containing differing proportions of thickening agent. The objectives of this study were as follows: 1) to determine the stability and skin irritability of NE gels (NGs) containing 1%, 2%, and 3% (w/w) Carbopol® 934 (CP934) (termed NG1, NG2, and NG3, respectively); 2) to compare the skin permeation profiles and drug deposition patterns of the NGs; and 3) to visualize the drug delivery routes of the NGs. Terbinafine and citral were incorporated into the NGs as model drugs. Ex vivo skin permeation tests indicated that the percutaneous flux rates of terbinafine decreased in the order NE (215 µg/cm2) > NG1 (213 µg/cm2) > NG2 (123 µg/cm2) > NG3 (74.3 µg/cm2). The flux rates of citral decreased in the order NE (1,026 µg/cm2) > NG1 (1,021 µg/cm2) > NG2 (541 µg/cm2) > NG3 (353 µg/cm2). The NGs accumulated greater amounts of the drugs in the stratum corneum and less in the epidermis/dermis than did the NE (P<0.05) over a period of 12 h. Laser scanning confocal microscopy indicated that the NGs altered the main drug delivery routes from skin appendages to intercellular paths. Histological images suggested that perturbations to the skin structure, specifically the size of the epidermal intercellular spaces and the separation distance of dermal collagen bundles, could be significantly minimized by increasing the proportion of CP934. These results suggest that adjustments of the CP934 proportions can be used to modulate the skin permeation profiles of NGs for specific therapeutic purposes.
Keywords: nanoemulsion, nanoemulsion gel, Carbopol 934 proportion, topical drug delivery, transdermal drug delivery
Introduction
Topical application formulations are designed as either transdermal or topical drug delivery systems. Transdermal drug delivery systems aim to transport drugs across skin layers so that the drugs can be taken up by the systemic circulation system. In comparison, topical drug delivery systems are intended for localized therapeutic action on one or more layers of skin.1,2 Recently, nanotechnology has been utilized to make novel drug carriers with potent skin permeation profiles and high drug-loading capacity for both transdermal and topical drug delivery systems. The nanocarriers include liposomes, ethosomes, polymeric nanoparticles, and nanoemulsions (NEs).3 Among these, NEs have been studied most extensively.
NEs are a broad class of multiphase colloidal dispersions with droplet size <100 nm. Consisting of a surfactant, cosurfactant, water, and oil, NEs have many characteristics that make them attractive to the pharmaceutical industry as possible drug nanocarriers. These characteristics include easy preparation, promising drug-loading capacity, potent transdermal efficiency, and good controlled-release capacity.4 NEs were initially designed as transdermal drug delivery systems for systemic therapeutic purposes (eg, candidiasis and breast cancer). This is because NEs can penetrate all skin layers to reach the systemic circulation system, thereby avoiding hepatic toxicity and cumbersome administration procedures.5 NEs have also been recommended for topical therapeutic aims (eg, acne and psoriasis). However, this may result in drugs being unduly absorbed by the circulation system, thus reducing drug efficacy in certain targeted sites and inducing unwanted irritation and hemolysis.6–8 In addition, topical application of NEs is inconvenient due to their low viscosity. If their viscosity were increased, the skin permeation profiles of NEs could be modulated for either transdermal or topical drug delivery. This would expand the clinical application of NEs.
Hydrogels are three-dimensional polymeric networks that are capable of absorbing large amounts of water or biological fluids.9 The pharmaceutical industry has great interest in hydrogels because of their adhesiveness, semisolid consistency, swelling behavior, and biocompatibility.10 Hydrogels have a mesh-like matrix structure, with openings typically between 5 and 100 nm wide.11 The cross-linking density of the matrix can be augmented by increasing the amount of thickening agent in hydrogels.12 This could be useful for modifying drug release kinetics and skin permeation profiles.13,14 It has been suggested that the viscosity of an NE could be optimized and its skin permeation profile modified by adjusting the proportion of thickening agent in a gel matrix containing an NE.
In this study, a series of NE gels (NGs) were produced by incorporating an NE into gel matrixes containing different proportions of Carbopol® 934 (CP934). The objectives of the study were as follows: 1) to determine the stability and skin irritability of the NGs; 2) to compare the skin permeation profiles and drug deposition patterns of the NGs; and 3) to visualize the drug delivery routes of the NGs. Terbinafine (TER) and citral (CIT) were used as model drugs in this study.
Materials and methods
Chemical compounds
CIT and TER were obtained from the Shanghai Ziyi Reagent Co, Ltd (Shanghai, China) and the Hubei Hengshuo Chemical Co, Ltd (Wuhan, China), respectively. Standard CIT (98% purity) was purchased from Dr Ehrenstorfer GmbH (Augsburg, Germany). Standard TER (99% purity) was purchased from the National Institutes for Food and Drug Control (Beijing, China). CP934, Cremophor® EL (EL-40 and EL-35), Polysorbate 80 (Tw-80) and Cremophor RH-40 were purchased from the Tianjin Kemiou Chemical Reagent Co, Ltd (Tianjin, China). Ethanol, 1,2-propylene glycol, n-butyl alcohol, and glycerin were purchased from the Sichuan Xilong Chemical Co, Ltd (Chengdu, China). 2,5-Bis(5-tert-butyl-2-benzoxazolyl)thiophene (BBOT, 95% purity) was purchased from the Tokyo Chemical Industry Co, Ltd (Tokyo, Japan).
Animals
Guinea pigs (2 months old, 300–500 g weight; 30 males and 30 females) were obtained from the Laboratory Animal Center, College of Medicine, Xi’an Jiaotong University (Xi’an, China). The guinea pigs were housed in clear cages with standard food and water. All procedures in this study were in accordance with the Institutional Guidelines for Animal Experiments in Shaanxi Province, People’s Republic of China. The procedures were approved by the Institutional Animal Care and Use Committee of Northwest A&F University (Yangling, China).
Preparation of NE and NGs
The surfactants were screened according to the methods of Azeem et al.15 Briefly, each surfactant (Cremophor EL-40, Cremophor EL-35, Tw-80, and Cremophor RH-40) was mixed with deionized water at a 15% (w/w) concentration. A 4 μL aliquot of CIT was added to the solution, and then the solution was vortexed for 5 min. This procedure was repeated until the solution became turbid. The solution that dissolved the largest amount of CIT was selected as the best surfactant.
The best cosurfactant and the best surfactant–cosurfactant (Km) ratio were determined by constructing pseudoternary diagrams using the water titration method.15 Briefly, the best surfactant was mixed with one of four cosurfactants (ie, ethanol, 1,2-propylene glycol, n-butyl alcohol, or glycerin) at a 3:1 (w/w) ratio to form four surfactant–cosurfactant mixes (Smix). Then, CIT was blended with each Smix at ratios of 1:9, 1:8, 1:7, 1:6, 1:5, 1:4, 1:3, 1:2, and 1:1 (w/w). The best cosurfactant was the Smix with the largest NE phase (ie, clear, transparent, and viscous liquid phase). The best Km ratio was determined by mixing the best surfactant with the best cosurfactant at ratios of 1:0, 1:1, 2:1, 3:1, 4:1, and 5:1 (w/w). The optimum Km ratio was the one with the largest area in the pseudoternary diagram. The optimized NE was then prepared by mixing TER and CIT into the best Smix using a water titration method.
The NGs were prepared by mixing NE into gel bases containing CP934, as described by Hussain et al7 with slight modifications. First, the gel bases were prepared by dispersing different amounts of CP934 in deionized water and then stirring (120 rpm) with a magnetic stirring bead for 3 h at room temperature. The gel bases contained 1%, 2%, or 3% CP934 (w/v). Second, triethanolamine was added to the gel bases. The mixtures were stirred at 60 rpm, and the pH was adjusted to 7.0. The gel bases were allowed to stand overnight to allow trapped air to escape and to allow cross-linking between CP934 and triethanolamine. Finally, the gel bases were separately mixed with NE at a 1:1 (w/w) ratio and stirred (120 rpm) at room temperature until the NGs were homogeneous and clear. The NGs containing 1%, 2%, and 3% CP934 plus NE will be referred to hereafter as NG1, NG2, and NG3, respectively.
Characterization of NE and NGs
The pH of the NE and NGs was determined with a digital pH meter. The polydispersity index (PDI) and droplet size distribution (DSD) were analyzed by Mastersizer 2,000 laser diffractometer (Malvern Instruments, Malvern, UK). The zeta potential was tested with a Zetasizer Nano ZS (Malvern Instruments). The formulations were diluted 10-fold and then dried on carbon-coated copper grids at room temperature prior to observation with a Hitachi JEOL-1230 transmission electron microscope (Hitachi Hitachi-Technologies Corp, Tokyo, Japan) at 80 kV.
Stability tests
The effect of extreme gravitational force, temperature, and pH on the NE and NGs was determined immediately after their preparation. The effect of extreme gravitational force was tested by centrifugation at either 5,000 or 12,000 rpm for 30 min. Temperature stability was tested by heating samples in a water bath at either 65°C or 95°C for 30 min, followed by cooling at room temperature. The pH effects were determined by adjusting the NE and NGs to pH 2, 3, 4, 5, 6, 8, or 9 with either 0.1 N HCl or 0.1 N NaOH. The samples were kept at room temperature for 24 h after these extreme treatments and then observed for separation, creaming, and cracking. Stable samples were assessed for DSD, PDI, and zeta potential, as described earlier. Untreated NE was used as a negative control.
Draize skin irritation test
Skin irritation tests were conducted as described by Draize et al.16 An electric razor was used to clip the hair from two areas (2 cm diameter) in the middorsal region of 36 guinea pigs. Then, one of the two areas on each guinea pig was kept intact, while the other was rubbed with abrasive paper. The guinea pigs were then randomly divided into six groups (three females and three males for each group). After 24 h, 500 μL NE, 0.5 g NG (ie, NG1, NG2, or NG3), 500 μL blank NE (BNE; Smix without Carbopol), 0.5 g CP934 gel (gel base), 500 μL phosphate-buffered saline (PBS) (negative control), or 500 μL formalin solution (1%, v/v, positive control) was spread thoroughly over a vaseline-ringed zone (1.5 cm diameter) of intact or abraded skin for each guinea pig in specific groups. The areas were then covered with gauze and an adhesive plaster. The areas were observed after 24, 48, and 72 h. Visible changes on the skin were observed and marked according to the mean values of erythema (no erythema, 0; light pink, 1; dark pink, 2; light red, 3; and dark red, 4) and edema (no edema, 0; barely perceptible, 1; edges definitely raised, 2; raised up to 1 mm with distinct outline, 3; raised >1 mm and expanded beyond the area of exposure, 4). Mean values of 0–0.49 indicated no irritation, 0.5–2.99 indicated light irritation, 3.0–5.99 indicated moderate irritation, and 6–8 indicated severe irritation.
Determination of TER and CIT
A Hitachi L-2000 series liquid chromatography system (Hitachi, Tokyo, Japan) was used to analyze the TER and CIT in the NE and NGs. The analytical column was a reversed-phase column (C18, 4.6 mm ×25 cm, 5 μm pore size) (Welch Materials Inc, Ellicott City, MD, USA). The NE and NGs were initially diluted 10-fold with methanol and then sonicated to degas. The supernatants were filtered through a 0.45 μm membrane filter for high-performance liquid chromatography (HPLC) analysis at 324 nm. The mobile phase was composed of methanol and deionized water (v/v, 8:2); the pH was 3.24; and the flow rate was 1.1 mL/min. Linear calibration curves were prepared in the range of 0.459–117.5 μg/mL for TER and 0.5176–132.5 μg/mL for CIT. The quantitative HPLC method was validated in terms of linearity, precision, accuracy, and percent recovery.
Ex vivo skin permeability tests
Ex vivo skin permeability tests were performed using Franz diffusion cells with guinea pig abdominal skin as the transdermal membrane (5 mL receptor volume, 0.785 cm2 diffusion area).17 An electric razor was used to clip the hair from the abdomen of the guinea pigs. The clipped areas were examined the next day, and guinea pigs with intact skin were chosen for the tests. The guinea pigs were ethically narcotized with diethyl ether, and a circular patch of abdominal skin (1.5 cm diameter) was excised using a corneal trephine. The wounds were then sterilized and sutured. The abdominal skin was put between the receiver chamber, which contained 5 mL PBS, and the donor chamber. The stratum corneum (SC) faced the donor chamber. A magnetic bead stirred the PBS in the receptor chamber (300 rpm). The temperature in the diffusion cells was maintained at 37°C±1°C. The donor chambers were filled with NE, one of the NGs, or conventional gel (CG, gel base with 1.5% CP934) containing TER and CIT. The amounts of TER and CIT were equivalent to that of 2 mL NE. A 2 mL aliquot of PBS was withdrawn from the receptor chamber after 0.5, 1, 2, 3, 4, 6, 8, 12, 16, and 24 h and replenished with another 2 mL PBS. The concentrations of TER and CIT in the PBS solutions were analyzed by HPLC. The cumulative amounts of the drugs per unit area in the receiver chamber (Qn, μg/cm2) were plotted as a function of time (h). The steady state flux (Jss, μg/cm2/h, permeation rate) was calculated from the slope of the linear portion (0.5–24 h) of the line. The enhancement ratio was calculated by dividing the Jss values of the NE and NGs by the Jss value of CG. All tests were conducted in triplicate.
TER and CIT in the SC and epidermis/dermis
The amounts of TER and CIT in the SC and epidermis/dermis were measured at three time intervals (ie, 2, 6, and 12 h) during the ex vivo skin permeability tests.18 The skins were collected and washed with warm PBS. The SC was removed using adhesive tape and then extracted with 4 mL methanol at 20°C for 1 h. The solutions were vortexed four times, each for 30 s, during the extraction. The epidermis/dermis was cut into small pieces and then extracted in the same way as the SC. The methanol solutions were centrifuged at 3,000 rpm for 10 min, and the supernatants were analyzed by HPLC.
Visualization of drug diffusion into skin
The NE, NGs, and CG containing BBOT were prepared as follows. First, 0.05 g BBOT was dissolved in 1.25 g TER-and-CIT mixture (w/w, 1:4) as the oil phase. Then, the NE, NGs, and CG (control) were prepared as previously described. The abdominal hair on 10 male guinea pigs was shaved before the test. Vaseline was used to make a border on the exposed abdominal skin. Subsequently, 200 μL NE, 0.625 g NG (ie, NG1, NG2, or NG3), or 0.625 g CG were separately applied to the skin of the guinea pigs. Each formulation was applied to three guinea pigs. The marginalized skin areas were then covered with chambers. One guinea pig from each treatment was randomly selected at 2, 6, and 12 h. The abdominal skin was excised as described earlier in the skin permeability tests. The skins were washed with warm PBS and then stored at −80°C. Frozen skin sections (6 μm thick) were visualized using laser scanning confocal microscopy (CLSM) at the excitation wavelength of 405 nm. In order to determine whether BBOT dissolved in media other than CIT, 0.05 g BBOT was dissolved in Smix (NE without TER and CIT, Blank NE, and BNE) and then visualized using CLSM.
Histological investigation of full-thickness abdominal skin
Exposed guinea pig abdominal skins were treated with the NE and NGs. After 2, 6, and 12 h, the treated guinea pigs were narcotized, and skin samples were taken as described for the ex vivo skin permeability tests. Skin samples were also collected from one guinea pig without treatment as a control. The skin samples were stored in 10% formalin solutions for 12 h. Later, the fixed samples were dehydrated with ethanol and fixed in paraffin. The paraffin sections were stained with hematoxylin and eosin and then observed under an Olympus light microscope.
Statistical analysis
The data were expressed as mean ± standard deviation, but the enhanced ratio values and Draize test values were in their original form. For comparison of the values among groups, one-way analysis of variance was used. To determine the statistical significance, the Tukey–Kramer multiple comparison test was used. When the P-value was less than 0.05 and 0.01, the difference between values was considered statistically significant or of higher significance, respectively.
Results and discussion
Preparation of NE and NG
The solubility of CIT was greater in EL-40 (56 μL) than in EL-35 (44 μL), TW-80 (52 μL), and RH-40 (52 μL) (data not shown). In the cosurfactant tests, 1,2-propylene glycol (Figure 1A) had the largest NE field, followed by ethanol, glycerin, and then n-butyl alcohol (Figure 1B–D). This indicated that 1,2-propylene glycol penetrated the interfacial film, thus increasing interfacial fluidity by permitting the hydrolytic tails of EL-40 to move freely.19 Therefore, 1,2-propylene glycol was selected as the best cosurfactant. Pseudoternary phase diagrams were prepared using various ratios of EL-40 and 1,2-propylene glycol. The 3:1 Km value exhibited the largest area and was therefore selected as the optimum Km ratio (Figure 2A–F). The optimum Smix (ie, 3:1 ratio of EL-40 and 1,2-propanediol), TER, CIT, and water were combined at a ratio 24:1:4:71 (w/w) to produce the optimized NE. The NE was then mixed with gel base containing different proportions of CP934 to produce NG1, NG2, and NG3.
 | Figure 1 Pseudoternary phase diagrams of four cosurfactants combined with EL-40 at fixed mass ratio (1:1). |
 | Figure 2 Pseudoternary phase diagrams of various Km ratios of EL-40 and 1,2-propylene glycol. |
The pH of the NE and NGs was neutral (6.9±0.2). Therefore, they were suitable for application on skin and unlikely to induce irritation. The DSD of the NE and NGs was determined immediately after their production (Figure 3A–D). The DSDs were in the nanoscale for NE, NG1, NG2, and NG3, averaging 15.53±3.32, 14.88±3.11, 17.16±5.45, and 15.79±5.42 nm, respectively. The PDIs for NE, NG1, NG2, and NG3 were 0.074±0.009, 0.084±0.025, 0.092±0.014, and 0.075±0.008, respectively. The zeta potentials for NE, NG1, NG2, and NG3 were −7.4±1.8, −6.5±2.3, −6.16±2.1, and −5.3±1.7 mv, respectively (Figure 4A–D). The transmission electron microscopy images showed that the NE and NG droplets were spherical (Figure 5A–D). The droplets did not aggregate after incorporation into CP934 gel, which was consistent with previous reports.7,20
 | Figure 3 Droplet size distribution immediately after production. |
 | Figure 4 Zeta potential diagrams. |
 | Figure 5 TEM images of the formulations. |
Stability test
Centrifugation, temperature, and pH greatly influence the physical stability of NEs, affecting the DSD, PDI, and zeta potential.21 Centrifugation had no significant effect on these variables in either the NE or the NGs (P>0.05, Table 1). This meant that the NGs were kinetically stable against gravitational separation.
 | Table 1 Stability of the NE and NGs treated with either extreme gravity (ie, centrifugation) or high temperature |
Heating significantly reduced the stability of the NE and NGs (Table 1). The average droplet size of NG2 and NG3 was highly significantly smaller than that of NE and NG1 in the 65°C treatment (P<0.01). Similar differences were observed in the PDIs (P<0.05) but not in the zeta potential values (P>0.05). One explanation is that high temperatures increase droplet movements, causing the droplets to coalesce. High temperatures could also cause reorientation of the emulsifier’s crystalline structure. A reduction in OH− on the film surface would cause the absolute zeta potential to decrease.22,23 However, it is important to mention that the droplet size and the PDI of the NGs remained small as the CP934 proportion increased. This indicated that especially in large proportions, the CP934 gel matrix increases the thermodynamic stability of NE. This may be because the mesh size of the NG network decreases as the proportion of CP934 increases. The narrow mesh size could confine droplet movement. In the 95°C treatment, NE became opaque, cloudy, and then the drugs separated out (Table 1, data not shown). This implied that the film covering the oil droplets ruptured upon reaching the cloud point of EL-40, causing EL-40 to separate from the solution due to the breaking of hydrogen bonds between polyoxyethylene and water. The cloud point range of EL-40 is 70°C–84°C. The manufacturer reported a cloud point of 80°C. Although their stability was significantly reduced by heat (P<0.05), the NGs were less affected than the NE. Overall, the results indicated that the gel matrix increased the thermodynamic stability.
Extreme pH, (ie, pH 2, 3, and 9) significantly affected the zeta potential and droplet size of both the NE and the NGs (P<0.05, Figure 6A and B). In contrast, the pH had no significant effect on PDI (data not shown). Hydroxyl ions (OH−) adhering to the oil/EL-40/water film result in negative zeta potential. The OH− can be replaced by hydrogen ions (H+) from the medium, exhibiting less negative zeta potential initially and then even neutral or positive zeta potential as the H+ replaces more OH− moieties.24,25 Therefore, the low pH reduced the absolute zeta potential, thus inducing droplet aggregation. High pH had the opposite effect. The zeta potential of both the NE and the NGs decreased significantly at pH 4 (P<0.05); however, droplet size remained stable (P>0.05). It may be that a steric barrier was formed by the hydration of the polyoxyethylene chains of EL-40.26,27 At pH 1, 2, and 3, the droplet size of NG3 was significantly smaller than that of NG2 and NG1 (P<0.05). This meant that higher CP934 proportions make NGs more stable against extreme pH values.
 | Figure 6 Influence of pH on the (A) DSD and (B) zeta potential of the NE and NGs. |
Skin irritation test
Skin irritation potentials decreased in the order NE > NG1 > NG2 > NG3 (Table 2). The NE and NG1 treatments both demonstrated moderate-to-severe irritation in intact and abraded skin 48 and 72 h posttreatment. The NG2 treatment exhibited slight irritation. The NG3 treatment caused slight irritation to abraded skin but no irritation to intact skin. No irritation was observed in the gel base and BNE treatments during the test. This indicated that CP934, EL-40, and 1,2-propylene glycol are safe for topical use.15,28
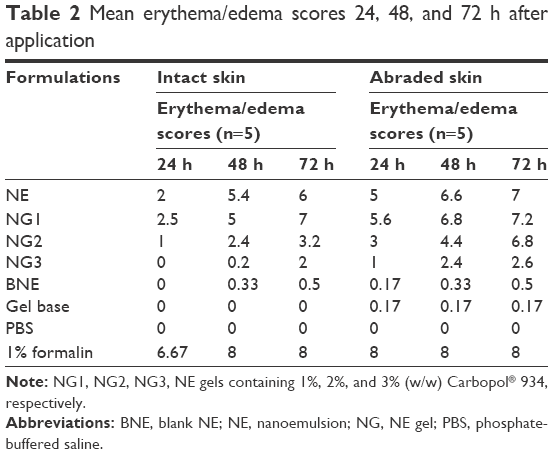 | Table 2 Mean erythema/edema scores 24, 48, and 72 h after application |
The SC is a formidable barrier that inhibits substances from penetrating into the deep skin layers where immune reactions can be triggered, especially the release of histamine by mast cells during inflammation or allergy.29,30 Barbier and Benezra31 reported that guinea pigs are sensitive to CIT, exhibiting delayed skin hypersensitivity after 24 h exposure at 0.5% (v/v, 0.5 mL). The results of this study showed that irritation was greater when the skin was abraded rather than intact. This meant that more CIT diffuses into the deep skin layers when the SC is removed. Furthermore, the skin irritation potential decreased as CP934 proportions increased. The NG3 treatment caused only moderate irritation to abraded skin and was deemed a safe topical formulation. The likely explanation is that smaller gel mesh in NG3 reduced droplet movement from the gel matrix to the deep skin layers. However, this mechanism needs additional study using drug diffusion tests. Overall, the skin irritation potential of NGs can be reduced by increasing the CP934 proportion.
HPLC method for determination of TER and CIT in the NE and NGs
The HPLC results showed no interference among TER, CIT, and other excipients in the NE or NGs (Figure 7A and B). The TER and CIT used to prepare the NE and NGs had higher purity than standard TER and CIT (Figure 7C and D). Interestingly, the retention time of TER was significantly influenced by the pH value of the mobile phase, showing a 5 min lag for every increase of 0.1 pH units. This is because additional H+ ions in the medium are prone to protonate the pair of N atoms in TER, thus increasing its polarity and shortening the retention time.32 There were good linear relationships between the drug concentrations and their peak areas in the range of 0.459–117.5 μg/mL for TER (y =2×10⁻⁷×−0.0385, r2=9998) and 0.5176–132.5 μg/mL for CIT (y =3×10⁻⁷×−0.0122, r2=0.9992). The method showed acceptable precision for TER and CIT analysis, with standard deviations less than 2% for both the intraday and interday assays. Furthermore, the mean recovery percentages were 99.85%±0.18% for TER and 99.71%±0.53% for CIT.
 | Figure 7 HPLC diagrams of different formulations. |
Ex vivo skin permeation test
The five formulations exhibited highly significant differences in cumulative drug permeation after 24 h (Table 3, Figure 8A and B). Skin permeation decreased in the same order for both TER and CIT. Specifically, skin permeation by TER decreased in the order NE (215 μg/cm2) > NG1 (213 μg/cm2) > NG2 (123 μg/cm2) > NG3 (74.3 μg/cm2) > CG (41.6 μg/cm2). Skin permeation by CIT decreased in the order NE (1,026 μg/cm2) > NG1 (1,021 μg/cm2) > NG2 (541 μg/cm2) > NG3 (353 μg/cm2) > CG (175 μg/cm2). The Jss values of these five formulations (Table 3) coincide with the results in Figure 8. The Jss values of TER for NE, NG1, NG2, and NG3 were 7.64-, 7.77-, 5.03-, and 3.01-fold higher, respectively, than for CG. The Jss values of CIT in NE, NG1, NG2, and NG3 were 5.19-, 5.21-, 3.03-, and 1.95-fold higher, respectively, than in CG. These results suggest that nanocarriers can play an important role in enhancing the permeability of drugs through the skin. The Jss values of NG2 and NG3 were significantly less than those of NE and NG1 (P<0.01). This suggests that the smaller mesh size of the gel matrix in NG2 and NG3 hinders drug release and thereby reduces drug absorption by the systemic circulation in vivo. Further, a reduction in the drug diffusion rate means that an effective concentration of the drug could be maintained at the local skin layers for localized therapeutic purposes. This skin permeation rate was greater in NG3 than in CG. Similar studies also reported that droplets moved more slowly from the inner phase to the outer phase in CG than in NG, probably because the droplets were larger in CG.33,34
 | Table 3 Ex vivo skin permeation parameters over 24 h |
 | Figure 8 Cumulative permeation of (A) TER and (B) CIT through guinea pig abdominal skin in vitro. |
TER and CIT accumulation in the SC and epidermis/dermis
The SC and epidermis/dermis were collected 2, 6, and 12 h after topical administration of the NE or NGs to quantify the temporal changes in TER and CIT accumulation in the skin layers. The amounts of TER and CIT in the SC were significantly (P<0.05) or highly significantly (P<0.01) greater in the NGs and CG than in NE (Table 4). This suggested that a relatively large amount of drug was deposited on the SC, probably due to the high affinity between CP934 and the SC.35 The TER and CIT amounts decreased in the order NG1 > NG2 > NG3. One explanation is that the drug release rates decreased as the proportion of CP934 increased.36 There were significant temporal reductions in drug deposition on the SC in both NG2 and NG3 treatments. This possibly occurred when drugs diffused out from the epidermis to the dermis, because it is well known that the dermis is less resistant than the epidermis to drug penetration.37 In the deep skin layers (epidermis/dermis), drug deposition was highly significantly greater in NE and NG1 than in NG2 and NG3 (P<0.01). Similarly, Welin-Berger et al38 reported that the drug release rates decreased as the formulations increased in viscosity. The results of this study suggest that NE and NG1 contained more nanosized droplets than NG2 and NG3 to react with the SC within a short time span. Furthermore, the surfactants and cosurfactants in the NGs impair the barrier function of the SC.39,40 Therefore, NE and NG1 deposited more drugs than NE2 and NE3 in the dermis. In comparison, TER and CIT in CG barely permeated the SC into the deeper skin layers. This further supports the idea that the mesh structure of the gel matrix hindered large droplets from diffusing into the SC. The ability to deposit drugs on the SC demonstrates that topically applied NGs have potential for prolonged drug release. However, to meet specific treatment purposes, it is still necessary to know whether the drugs primarily accumulate in the epidermis or in the dermis.
 | Table 4 Temporal changes in the deposition of TER and CIT |
Visualization of drug diffusion into the skin in vivo
CLSM based on the fluorophore fluorescein has become the conventional method for observing drug localization and permeation pathways in skin.7,41 The marker in this test was BBOT dissolved in CIT. The results were validated by the observation that no fluorescent signals were detected when BBOT was dissolved in BNE. The deposition of fluorescent CIT and TER in the skin layers increased as the treatment time with NE, NGs, and CG increased. Fluorescence intensity was generally stronger in NE and NG1 than in NG2 and NG3 throughout the test (Figure 9A–L). The intensity decreased in the order NE > NG1 > NG2 > NG3 > CG (Figure 9A–O). Drug delivery was generally confined to the outermost skin layers in CG (Figure 9M–O). In contrast, stronger fluorescence signals were observed in deeper skin layers in the treatments with NGs (Figure 9D–L). This clearly indicated that droplet size and NE excipients have great effect on skin permeability.
 | Figure 9 Visualization of drug traces in the abdominal skin of guinea pigs 2, 6, and 12 h after application of NE, NGs, and CG. |
The findings agree with previous reports that NGs can significantly enhance skin permeability when compared with CGs, probably because NGs have smaller droplets.33,34 Moreover, differences in fluorescence signals among the NGs showed that the proportion of CP934 influenced the skin permeation rates by altering the main skin permeation routes. There are three major routes for drug penetration into the subepidermal tissue: hair follicles together with their sebaceous glands, sweat ducts, and the SC (including transcellular and intercellular routes).42 The images show that the penetration depths of NG1 (approximately 190 and 310 μm at 2 and 6 h, respectively; Figure 9D and E) and NG2 (approximately 110 and 210 μm at 2 and 6 h, respectively; Figure 9G and H) were greater than those of NG3 (approximately 110 and 180 μm at 2 and 6 h, respectively; Figure 9J and K). In addition, it was obvious that NG1 and NG2 delivered the drugs more efficiently into follicles, sebaceous glands, and sweat ducts under the skin, making them “reservoirs” for delivering model drugs to deep skin layers. The model drugs in NG3 diffused uniformly in both the horizontal and vertical directions, resulting in drug deposition in the epidermis (Figure 9J–L). The reduced mobility of droplets in NG3 maybe because the high proportion of thickening agent reduced the mesh size of the gel matrix, thus hindering droplet movement to the surrounding pores and eventually leading to low skin permeation rate. This means that NG3 is superior to NG2 and NG1 for topical therapeutic effect.43 These results agree with previous studies on NEs, which suggested that 1) hair follicles and sweat glands play an important role in transdermal drug delivery systems41,44 and 2) gel matrixes can increase drug retention time in the epidermis.45 Comparison with NE indicated that as the proportion of CP934 increased in the NGs, the main skin delivery routes were altered and the skin permeation profiles were changed from the transdermal mode to topical drug delivery.
Histological investigation of skin treated with NE or NGs
Skin cross sections were prepared and observed microscopically to further elucidate the main delivery routes after topical application of NGs. The images of the negative control showed well-defined and adjacent margins between the SC, epidermis, and dermis (Figure 10A). The SC was intact. No inflamed cells were seen in the dermis. The skin appendages were normal, and the bundles of collagenous fibers were tightly arranged. In comparison, the SC in the NE and the NG treatments exhibited clear morphological changes after 2, 6, and 12 h (Figure 10B–M). In NE (Figure 10B–D) and NG1 (Figure 10E–G), the SC was loosened into several distinct and randomly twisted layers. The space among the layers increased as the treatment time increased, and fractures also formed. Similar changes were observed in the SC of NG2 (Figure 10H–J) and NG3 (Figure 10K–M); however, the SC layers were more compact and there were fewer fractures than in NE and NG1. Surfactants and cosurfactants are both reported to extract intercellular lipids and break connections among keratinocyte desmosomes.39,40 Moreover, changes in the SC could be attributed to the movement of aqueous fluid into the polar pathway, thus increasing the interlamellar volume of the lipid bilayer in the SC.46 However, it is important to note that changes to the SC were minimized as the proportion of CP934 increased. This indicated that fewer droplets came out from NGs containing high proportions of CP934. The NG2 and NG3 treatments only slightly perturbed the SC. In the NG3 treatment (Figure 10K–M), the SC remained intact at the end of the test.
 | Figure 10 Skin histological cross sections 2, 6, and 12 h after application of the NE and NGs. |
In the epidermis, the NE and NGs resulted in enlarged intercellular spaces and distinct voids. The dermis exhibited abnormal separation of the collagenous bundles. The spaces in the epidermis and the separation of the collagenous bundles in the dermis became more prominent as treatment time increased. These results were similar with the findings of others,41,44,47,48 who observed that 1) NEs were mainly distributed in the extracellular space and 2) interlocking channels formed by proteoglycans in the interstices among the collagenous bundles can be enlarged to allow for the passage of substances. Zhao and Singh49 reported that CIT can perturb the macroscopic structure of the skin barrier and extract the intercellular lipids. This could explain the histological changes in this study. As the proportion of CP934 in the NGs increased, the size of the intercellular spaces and the separation distance of the collagenous bundles decreased sharply and then leveled out. This indicated that within short periods of time, there was less drug diffusion from formulations with higher CP934 proportions (ie, NG2 and NG3). Thus, the images show that less space was needed for the passage of drugs and there were fewer changes to the dermis. Moreover, the results indicated that in NG2 and NG3, more drug was retained in the dermis rather than passing through. These results agree with both the ex vivo skin permeability tests and the visualization of drug diffusion in the skin. The histological images indicated no inflamed cells in the dermis in any treatment, suggesting that the NE and NGs are topically safe. These results agreed with the results of the skin irritation, ex vivo skin permeation, drug deposition tests, and CLSM images.
Conclusion
We successfully integrated NEs into CP934 gel to produce NGs. Stability tests and Draize tests indicated that the NGs are more stable and also safer than NEs. As the proportion of CP934 in the gel matrix increased, 1) the skin permeation rates declined, 2) drug deposition in the epidermis/dermis increased, 3) the drug diffusion routes changed from skin appendages to mainly intercellular paths, and 4) histological structures were significantly altered. Overall, the results support the idea that the proportion of CP934 in the gel matrix can successfully modulate the skin permeation profiles of NGs, changing them from transdermal to topical drug delivery systems. The incorporation of NEs into hydrogel shows great promise for specific therapeutic purposes (ie, topical or systemic administration).
Acknowledgments
We thank Professor Mingqi Yang (Northwest A&F University) for his advice on preparation of skin histological cross sections. We thank Yunzhou Li, Kai Liu, Lina Gao, Guohua Bu, and Dan Liu for their sincere help and advice on collecting data. We appreciate and thank Dr William J Gale (Shihezi University, Shihezi, Xinjiang, China) for polishing the language.
Disclosure
The authors report no conflicts of interest in this work.
References
Guy RH. Transdermal drug delivery. In: Schmidt HH, Hofmann F, editors. Handbook of Experimental Pharmacology. Berlin: Springer; 2002:V–VI. | ||
Bhushan PB. Encyclopedia of Nanotechnology. New York: Springer; 2012. | ||
Solomon M, D’Souza GG. Recent progress in the therapeutic applications of nanotechnology. Curr Opin Pediatr. 2011;23(2):215–220. | ||
Mason TG, Wilking JN, Meleson K, et al. Nanoemulsions: formation, structure, and physical properties. J Phys Condens Matter. 2006;18(41):R635–R666. | ||
Sanmano B, Hiruma M, Mizoguchi M, Ogawa H. Combination therapy consisting of week pulses of oral terbinafine plus topical application of terbinafine cream in the treatment of onychomycosis. J Dermatolog Treat. 2004;15(4):245–251. | ||
Pannu J, McCarthy A, Martin A, et al. NB-002, a novel nanoemulsion with broad antifungal activity against dermatophytes, other filamentous fungi, and Candida albicans. Antimicrob Agents Chemother. 2009;53(8):3273–3279. | ||
Hussain A, Samad A, Singh SK, et al. Nanoemulsion gel-based topical delivery of an antifungal drug: in vitro activity and in vivo evaluation. Drug Deliv. 2015;21:1–16. | ||
Herman A, Herman AP. Essential oils and their constituents as skin penetration enhancer for transdermal drug delivery: a review. J Pharm Pharmacol. 2015;67(4):473–485. | ||
Jagur-Grodzinski J. Polymeric gels and hydrogels for biomedical and pharmaceutical applications. Polym Adv Technol. 2010;21(1):27–47. | ||
Hamidi M, Azadi A, Rafiei P. Hydrogel nanoparticles in drug delivery. Adv Drug Deliv Rev. 2008;60(15):1638–1649. | ||
Cruise GM, Scharp DS, Hubbell JA. Characterization of permeability and network structure of interfacially photopolymerized poly(ethylene glycol) diacrylate hydrogels. Biomaterials. 1998;19(14):1287–1294. | ||
Shalaby SW, Hoffman AS, Ratner BD, et al. Polymers as Biomaterials. New York: Plenum Press; 1984. | ||
Aldawsari HM, Badr-Eldin SM, Labib GS, El-Kamel AH. Design and formulation of a topical hydrogel integrating lemongrass-loaded nanosponges with an enhanced antifungal effect: in vitro/in vivo evaluation. Int J Nanomedicine. 2015;10:893–902. | ||
Lin CC, Metters AT. Hydrogels in controlled release formulations: network design and mathematical modeling. Adv Drug Deliv Rev. 2006;58(12–13):1379–1408. | ||
Azeem A, Rizwan M, Ahmad FJ, et al. Nanoemulsion components screening and selection: a technical note. AAPS PharmSciTech. 2009;10(1):69–76. | ||
Draize JH, Woodward G, Calvery HO. Methods for the study of irritation and toxicity of substances applied topically to the skin and mucous membranes. J Pharmacol. 1944;82:377–390. | ||
Naz Z, Ahmad FJ. Curcumin-loaded colloidal carrier system: formulation optimization, mechanistic insight, ex vivo and in vivo evaluation. Int J Nanomedicine. 2015;10:4293–4307. | ||
Alves MP, Scarrone AL, Santos M, Pohlmann AR, Guterres SS. Human skin penetration and distribution of nimesulide from hydrophilic gels containing nanocarriers. Int J Pharm. 2007;341(1–2):215–220. | ||
Tenjarla S. Microemulsions: an overview and pharmaceutical applications. Crit Rev Ther Drug Carrier Syst. 1999;16(5):461–521. | ||
Khurana S, Jain NK, Bedi PM. Nanoemulsion based gel for transdermal delivery of meloxicam: physico-chemical, mechanistic investigation. Life Sci. 2013;92(6–7):383–392. | ||
Cavazos-Garduno A, Ochoa Flores AA, Serrano-Nino JC, et al. Preparation of betulinic acid nanoemulsions stabilized by omega-3 enriched phosphatidylcholine. Ultrason Sonochem. 2015;24:204–213. | ||
Freitas C, Muller RH. Effect of light and temperature on zeta potential and physical stability in solid lipid nanoparticle (SLN (TM)) dispersions. Int J Pharm. 1998;168(2):221–229. | ||
de Morais JM, dos Santos ODH, Delicato T, et al. Characterization and evaluation of electrolyte influence on canola oil/water nano-emulsion. J Dispers Sci Technol. 2006;27(7):1009–1014. | ||
Manve ED, Pugh RJ. Diffuse layer electrostatic potential and stability of thin aqueous films containing a nonionic surfactant. Langmuir. 1991;7:2253–2260. | ||
Sis H, Birinci M. Effect of nonionic and ionic surfactants on zeta potential and dispersion properties of carbon black powders. Colloids Surf A Physicochem Eng Asp. 2009;341(1–3):60–67. | ||
Mittal KL, Shah DO. Adsorption and Aggregation of Surfactants in Solution. New York: Marcel Dekker; 2003. | ||
Tucker I, Penfold J, Thomas RK, Tildesleyt DJ. Interplay between the surface adsorption and solution-phase behavior in dialkyl chain cationic-nonionic surfactant mixtures. Langmuir. 2009;25(7):3924–3931. | ||
Liu W, Hu M, Liu W, Xue C, Xu H, Yang X. Investigation of the carbopol gel of solid lipid nanoparticles for the transdermal iontophoretic delivery of triamcinolone acetonide acetate. Int J Pharm. 2008;364(1):135–141. | ||
Trommer H, Neubert RH. Overcoming the stratum corneum: the modulation of skin penetration. Skin Pharmacol Physiol. 2006;19(2):106–121. | ||
Martins LE, Reis VM. Immunopathology of allergic contact dermatitis. An Bras Dermatol. 2011;86(3):419–430. | ||
Barbier P, Benezra C. The influence of limonene on induced delayed hypersensitivity to citral in guinea pigs. II. Label distribution in the skin of 14C-labelled citral. Acta Derm Venereol. 1983;63(2):93–96. | ||
Maruani J. Molecules in Physics, Chemistry, and Biology. Dordrecht, Boston: Kluwer Academic Publishers; 1988. | ||
Harwansh RK, Patra KC, Pareta SK, et al. Nanoemulsions as vehicles for transdermal delivery of glycyrrhizin. Braz J Pharm Sci. 2011;47(4):769–778. | ||
Wavikar P, Vavia P. Nanolipidgel for enhanced skin deposition and improved antifungal activity. AAPS PharmSciTech. 2013;14(1):222–233. | ||
Mou D, Chen H, Du D, et al. Hydrogel-thickened nanoemulsion system for topical delivery of lipophilic drugs. Int J Pharm. 2008;353(1–2):270–276. | ||
Singh VK, Anis A, Banerjee I, Pramanik K, Bhattacharya MK, Pal K. Preparation and characterization of novel carbopol based bigels for topical delivery of metronidazole for the treatment of bacterial vaginosis. Mater Sci Eng C Mater Biol Appl. 2014;44:151–158. | ||
Scheuplein RJ. Permeability of the skin: a review of major concepts. Curr Probl Dermatol. 1978;7:172–186. | ||
Welin-Berger K, Neelissen JA, Bergenstahl B. The effect of rheological behaviour of a topical anaesthetic formulation on the release and permeation rates of the active compound. Eur J Pharm Sci. 2001;13(3):309–318. | ||
Froebe CL, Simion FA, Rhein LD, Cagan RH, Kligman A. Stratum corneum lipid removal by surfactants: relation to in vivo irritation. Dermatologica. 1990;181(4):277–283. | ||
Endo M, Yamamoto T, Ijuin T. Effect of nonionic surfactants on the percutaneous absorption of tenoxicam. Chem Pharm Bull. 1996;44(4):865–867. | ||
Kong M, Chen XG, Kweon DK, et al. Investigations on skin permeation of hyaluronic acid based nanoemulsion as transdermal carrier. Carbohydr Polym. 2011;86(2):837–843. | ||
Barry BW. Drug delivery routes in skin: a novel approach. Adv Drug Deliv Rev. 2002;54(suppl 1):S31–S40. | ||
Lekshmi UMD, Poovi G, Reddy PN. In-vitro observation of repaglinide engineered polymeric nanoparticles. Dig J Nanomater Biostruct. 2012;7(1):1–18. | ||
Changez M, Varshney M, Chander J, Dinda AK. Effect of the composition of lecithin/n-propanol/isopropyl myristate/water microemulsions on barrier properties of mice skin for transdermal permeation of tetracaine hydrochloride: in vitro. Colloids Surf B Biointerfaces. 2006;50(1):18–25. | ||
de Vargas BA, Argenta DF, Borghetti G, Koester LS, Bassani VL, Teixeira HF. Validation of an LC method to determine skin retention profile of genistein from nanoemulsions incorporated in hydrogels. J Chromatogr Sci. 2012;50(2):114–118. | ||
Yilmaz E, Borchert HH. Effect of lipid-containing, positively charged nanoemulsions on skin hydration, elasticity and erythema – an in vivo study. Int J Pharm. 2006;307(2):232–238. | ||
Shakeel F, Baboota S, Ahuja A, Ali J, Shafiq S. Skin permeation mechanism and bioavailability enhancement of celecoxib from transdermally applied nanoemulsion. J Nanobiotechnology. 2008;6:8. | ||
Fuchs E. Beauty is skin deep: the fascinating biology of the epidermis and its appendages. Harvey Lect. 1998–1999, 2000;94:47–77. | ||
Zhao K, Singh J. Mechanism(s) of in vitro percutaneous absorption enhancement of tamoxifen by enhancers. J Pharm Sci. 2000;89(6):771–780. |
 © 2016 The Author(s). This work is published and licensed by Dove Medical Press Limited. The
full terms of this license are available at https://www.dovepress.com/terms
and incorporate the Creative Commons Attribution
- Non Commercial (unported, 3.0) License.
By accessing the work you hereby accept the Terms. Non-commercial uses of the work are permitted
without any further permission from Dove Medical Press Limited, provided the work is properly
attributed. For permission for commercial use of this work, please see paragraphs 4.2 and 5 of our Terms.
© 2016 The Author(s). This work is published and licensed by Dove Medical Press Limited. The
full terms of this license are available at https://www.dovepress.com/terms
and incorporate the Creative Commons Attribution
- Non Commercial (unported, 3.0) License.
By accessing the work you hereby accept the Terms. Non-commercial uses of the work are permitted
without any further permission from Dove Medical Press Limited, provided the work is properly
attributed. For permission for commercial use of this work, please see paragraphs 4.2 and 5 of our Terms.