Back to Journals » Journal of Healthcare Leadership » Volume 11
Does physician engagement affect satisfaction of patients or resident physicians?
Authors Scher E, Whitehouse S, Van Harn M, Bollinger J, Stevens B, Macki K ![]() , Saoud D, Baker-Genaw K
, Saoud D, Baker-Genaw K ![]()
Received 10 January 2019
Accepted for publication 23 April 2019
Published 12 June 2019 Volume 2019:11 Pages 75—80
DOI https://doi.org/10.2147/JHL.S201060
Checked for plagiarism Yes
Review by Single anonymous peer review
Peer reviewer comments 2
Editor who approved publication: Professor Russell Taichman
Eric Scher,1,2 Sarah Whitehouse,1 Meredith Van Harn,3 John Bollinger,4 Bret Stevens,1 Kathy Macki,5 Deborah Saoud,5 Kimberly Baker-Genaw1,2
1Department of Medical Education, Henry Ford Health System, Detroit, MI, USA; 2Department of Medicine, Henry Ford Medical Group, Detroit, USA; 3Department of Public Health Sciences, Henry Ford Health System, Detroit, USA; 4Care Experience Department, Henry Ford Health System, Detroit, USA; 5Human Resources, Henry Ford Health System, Detroit, USA
Purpose: This study examined whether change in physician engagement affected outpatient or resident physician satisfaction using common US measures.
Methods: Surveys were administered by Advisory Board Survey Solutions for staff physician engagement, Press Ganey for Clinician and Group Consumer Assessment of Healthcare Providers and Systems (CGCAHPS) for outpatient satisfaction, and Accreditation Council for Graduate Medical Education (ACGME) for the ACGME Resident/Fellow Survey. Survey sample sizes were 685, 697, and 763 for physician engagement and 621, 625, and 618 for resident satisfaction in 2014–2016, respectively; only respondents were available for CGCAHPS (24,302, 34,328, and 43,100 for 2014–2016, respectively). Two groups were analyzed across 3 years: (1) percentage of “engaged” staff physicians versus percentage of outpatient top box scores for physician communication, and (2) percentage of “engaged” staff physicians versus percentage of residents “positive” on program evaluation. For resident evaluation of faculty, the number of programs that met/exceeded ACGME national compliance scores were compared. Univariate chi-squared tests compared data between 2014, 2015, and 2016.
Results: For 2014–2016, “engaged” physicians increased from 34% (169/497) to 44% (227/515) to 48% (260/542) (P<0.001) whereas CGCAHPS top box scores for physician communication remained unchanged at 90.9% (22,091/24,302), 90.8% (31,088/34,328), and 90.9% (39,178/43,100) (P=0.869). For the second group, “engaged” physicians increased from 33% (204/617) to 46% (318/692) to 50% (351/701) (P<0.001) and residents “positive” on program evaluation increased from 86% (534/618) in 2014 to 89% (556/624) in 2015 and 89% (550/615) in 2016 (P=0.174). The number of specialties that met/exceeded national compliance for all five faculty evaluation items grew from 44% (11/25) in 2014 to 68% (17/25) in 2015 and 64% (16/25) in 2016 (P=0.182).
Conclusion: For our medical group, improvement in physician engagement across time did not coincide with meaningful change in the outpatient experience with physician communication or resident satisfaction with program and faculty.
Keywords: physician engagement, CGCAHPS survey, patient satisfaction, ACGME resident survey, resident physician satisfaction
Introduction
A performance strategy favored by hospitals and health systems aims to improve employee engagement with a focus on improving the patient experience. In doing so, clinical quality and outcomes reportedly improve,1,2 along with patient loyalty and associated revenue.3,4 Improving physician engagement has been shown to increase clinical productivity and patient referrals within the organization,5–7 as well as enhance patient safety.8,9
Physician engagement has been defined as “vigor, dedication, and absorption” in work and to the organization to ensure success.10–13 Factors that drive physician engagement have been reported to include a sense of purpose, meaningful work, and belief that the organization is committed to high-quality patient care whereas physician disengagement may reflect dissatisfaction with work resources, organizational leadership, and work overload.12,13
Research is limited on how physician engagement may affect patients or physician trainees, two populations that physicians work with closely. In The Netherlands, Scheepers et al14 did not find any association between physician engagement using the Utrecht Work Engagement Scale and the Dutch outpatient survey on physician communication, which is similar but not identical to the US Clinician and Group Consumer Assessment of Healthcare Providers and Systems (CGCAHPS) survey. The Dutch group also did not find any association between physicians’ clinical work engagement and residents’ evaluation of faculty using the System for Evaluation of Teaching Qualities.15
No studies have yet reported on the relationship between physician engagement and the common US measures for patients to evaluate physicians and for resident physicians to evaluate faculty. For US and international programs accredited by the Accreditation Council of Graduate Medical Education (ACGME), physicians-in-training use the ACGME Resident/Fellow Survey to evaluate faculty and programs.16 To assess outpatient experience, the Centers for Medicare and Medicaid Services requires physician groups of 100 or more to use the CGCAHPS patient satisfaction survey.17 To assess physician engagement, the Utrecht Work Engagement Scale was found to be the most common tool used in studies measuring physician engagement, none of which were based in the US.12 In the US, health systems and hospitals commonly partner with health care survey consultants such as Press Ganey or Gallup to conduct proprietary surveys. Our health system uses the Advisory Board Survey Solutions (ABSS; Washington, DC, USA) whose dataset included more than 55,000 individual physician respondents as of 2016 for national comparison of an organization’s physician engagement level in relation to similar groups of physicians, such as employed physicians, affiliated physicians, independent physicians, or by specialty. Improvement of physician engagement is defined by increased percentage of engaged physicians as determined by the proprietary survey methods.
For our large medical group, physician engagement declined from the fifty-third to the thirty-fourth percentile nationally from 2012 to 2014, then after instituting improvement strategies the national ranking rose to the eighty-eighth percentile in 2016. We aimed to assess whether this change in physician engagement across time affected the outpatient experience with physician communication as reported in the CGCAHPS survey or with residents’ overall program evaluation and faculty evaluation as reported in the ACGME Resident/Fellow Survey.
Methods
Study design
This retrospective study obtained data from surveys administered to employed staff physicians (ABSS physician engagement survey), physician trainees (ACGME Resident/Fellow Survey), and patients (CGCAHPS outpatient survey) of our medical group from 2014 to 2016. Sample sizes for the 3-year study are provided in Table 1. The study was approved by Henry Ford Health System’s Institutional Review Board.
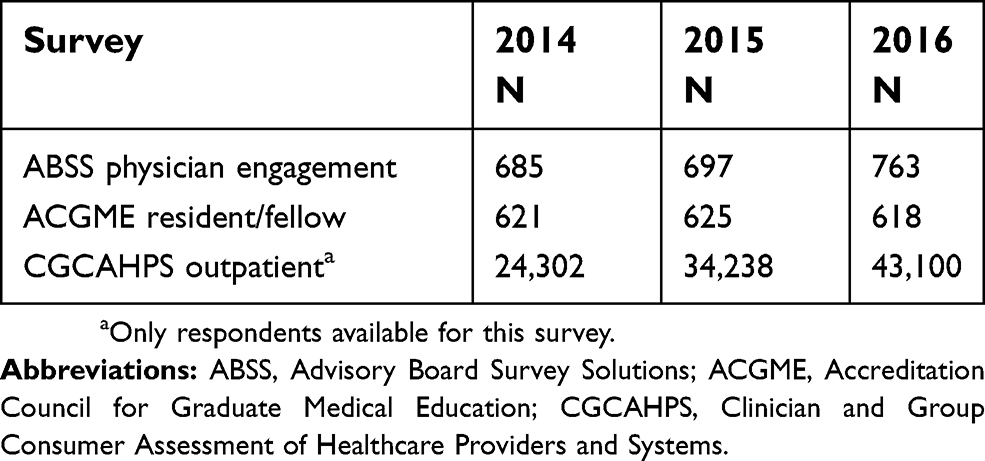 | Table 1 Survey groups 2014–2016 |
Inclusion and exclusion criteria
Our health system employs approximately 1,000 medical group physicians, the majority of whom serve as faculty to approximately 670 residents in 49 ACGME-accredited programs. As not all specialties provide outpatient care and not all specialties at our institution have ACGME residency or fellowship programs, we devised two groups for analysis: (1) staff physicians and outpatients, and (2) staff physicians and residents/fellows.
Specialties were included in the staff physicians and outpatients group if they had ≥3 respondents to the ABSS physician engagement surveys and ≥30 outpatient respondents to the CGCAHPS surveys for each year of the 2014–2016 study period. Specialties were included in the staff physicians and residents/fellows group if they had ≥3 respondents to the ABSS physician engagement surveys and ≥4 respondents on the ACGME Resident/Fellow Surveys for each year of the study period.
Within our medical group, general internal medicine physicians may be faculty or nonfaculty. For this study we defined general internal medicine physicians as those faculty practicing at the urban hospital’s outpatient residency teaching clinic, excluding the others in the specialty from data analysis. We excluded emergency medicine from the outpatient group analyses because the specialty used a different patient survey during the study period.
Table 2 provides the list of specialties meeting study criteria for inclusion in the staff physician and outpatient group and the staff physician and resident group analyses.
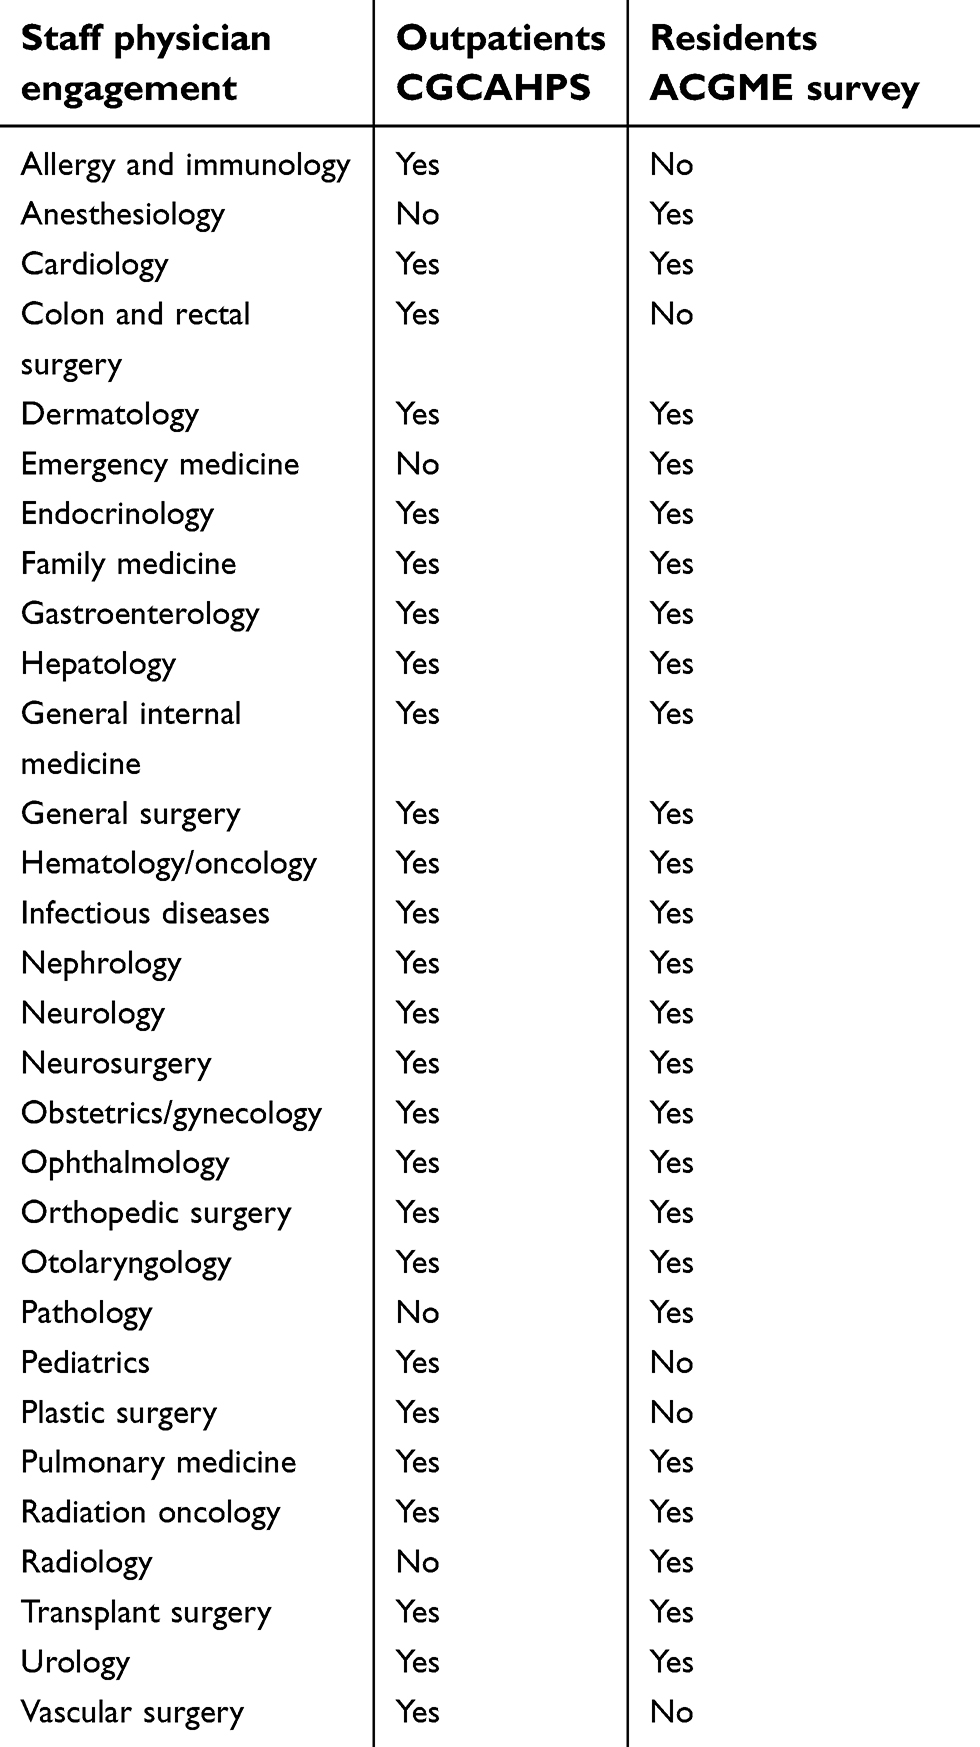 | Table 2 Specialties included in ABSS physician engagement, CGCAHPS outpatient, and ACGME resident survey analyses |
Measures
To assess staff physician engagement and outpatient satisfaction, we compared the percentage of “engaged” staff physicians determined by the ABSS surveys, and the CGCAHPS outpatient surveys’ top box percentage scores for physician communication quality across 2014–2016. The top box percentage reflects patient respondents who selected the most positive score available.
To assess staff physician engagement and physician trainee satisfaction, we compared the percentage of “engaged” staff physicians determined by the ABSS surveys, and the percentage of physician trainee respondents selecting a “positive” overall program evaluation in the ACGME Resident/Fellow Survey across 2014–2016. For residents’ evaluation of faculty, we compared the number of specialties that met or exceeded national compliance scores as determined by the ACGME across 2014–2016.
Surveys
Physician engagement
The ABSS validated their proprietary physician engagement survey using “factor analysis and multivariate regression analysis to determine how well a respondent’s answers to the survey items predict the respondent’s engagement level. The result from the regression analysis was statistically significant and indicated that a handful of the survey items (key drivers of engagement) predict engagement levels with about 70% accuracy (R2=0.695). In individual regression analyses, each individual independent variable showed a statistically significant correlation with the dependent variable. Cronbach’s alpha analysis showed excellent reliability of the dependent variable with a score of 0.96" (Advisory Board Survey Solutions, Provider Engagement and Alignment Index Methodology and Validation Report, unpublished data).
Our medical group physicians volunteered to complete a 41-question survey in 2014 and 2016, and a 19-question survey in 2015. To determine the percentage of “engaged” physicians, the ABSS uses a Likert-type scale for responses to four statements that comprise the basis of calculation: “This organization inspires me to perform my best; I am willing to put in a great deal of effort in order to help this organization succeed; I would recommend this organization to other clinicians as a great place to practice; and I am likely to be practicing with this organization three years from now.” The ABSS uses data only from physician respondents answering they expect to remain with the organization in an effort to eliminate bias of those expecting to leave. Scoring included responses to four categories: “engaged” (highly loyal and committed to the organization); “content” (satisfied but no extra effort to help the organization succeed); “ambivalent” (not invested in the organization); and “disengaged” (actively unhappy with the organization). For this study we defined physician engagement as the “engaged” category only, and “not engaged” as content plus ambivalent plus disengaged categories. Prior statistical research by the ABSS validated use of this combination of categories (oral communication, P. Kenol, Senior Consulting Analyst, Advisory Board Survey Solutions, May 2017).
Patient survey
We obtained from Press Ganey our medical group’s continuous 12-month CGCAHPS survey data on top box scores for physician communication quality for 2014–2016. Press Ganey mails the patient satisfaction survey to randomly selected patients after their outpatient visits and collects data received. Only the number of responses received is available. Press Ganey calculated top box scores using the average score of seven questions within the domain, using only “yes, definitely” responses for six CGCAHPS questions using a three-point response scale (yes, definitely; yes, somewhat; no) and “yes” responses for one CGCAHPS question using a two-point response (yes or no). The questions were: “did the doctor… explain information in a way you can understand; listen carefully to you; give easy to understand instructions; know important information about your medical history; show respect for what you say; spend enough time with you; talk with you about your problem or concern” (this latter question used the yes/no scale). The CGCAHPS survey has been validated.18
Resident survey
We obtained the ACGME survey results for our health system’s urban teaching hospital that serves as the sponsoring institution of the 49 ACGME programs. The ACGME survey has been validated.19 This study defined ACGME survey data from academic years 2014–2015 through 2016–2017 to be reflective of years 2014–2016. We collected data for trainees’ overall program evaluation and evaluation of faculty.
For overall program evaluation, we compared positive versus negative responses. As the survey provided five responses, we combined “very positive” and “positive” scores to comprise the positive group and “neutral,” “negative,” and “very negative” for the negative group.
For evaluation of faculty, the survey gives five items (“residents have sufficient supervision; appropriate level of supervision; sufficient instruction; faculty and staff interested in residency education; faculty and staff create an environment of inquiry”). Results for each of the five items are reported as percentages to be assessed in relation to national compliance percentages determined by the ACGME and provided on survey results. These compliance scores have been shown to be reliable in analyses.20 Because faculty evaluation compliance scores do not provide data at the resident respondent level, we compared the number of specialties that met or exceeded national compliance scores for all five faculty evaluation items with those that did not meet compliance across 2014–2016.
Statistical analysis
Univariate chi-squared tests were used to compare categorical variables between 2014, 2015, and 2016. We compared the proportion of specialties meeting specified averages over time using chi-squared tests for physicians, residents, and patients separately. Statistical significance was set at P<0.05. All analyses were performed using SAS 9.4 (SAS Institute Inc., Cary, NC, USA).
Results
Survey results comparing the percentages of physician engagement with items studied for patient satisfaction and resident satisfaction across the 3-year study period are shown in Table 3.
 | Table 3 Comparison of physician engagement with outpatient satisfaction and with resident satisfaction across 2014–2016 |
For the staff physicians and outpatients group, the percentage of “engaged” physicians improved significantly across 2014–2016 from 34% to 44% to 48% (P<0.001) whereas CGCAHPS top box scores for the patient experience with physician communication remained unchanged at approximately 91% (P=0.869) (Table 3).
For the staff physicians and residents group, the percentage of “engaged” physicians grew significantly from 33% to 46% to 50% over 3 years (P<0.001). Trainees who responded “positive” on overall program evaluation increased from 86% in 2014 to 89% in 2015 and 2016 but this change was not significant (P=0.174) (Table 3). The number of programs with residents that rated all five faculty evaluation items at or above the ACGME national compliance scores for the specialty increased from 44% (11/25) in 2014 to 68% (17/25) in 2015 and 64% (16/25) in 2016, but this change was not statistically significant (P=0.182) (Table 3).
Discussion
This study examined whether the level of physician engagement in a large medical group over 3 years affected outpatient and physician trainee satisfaction using common US measures. Although the percentage of “engaged” staff physicians statistically increased across 3 years, the CGCAHPS physician communication quality top box scores as reported by patients remained the same. Residents reporting “positive” on overall program evaluation improved, as did the number of programs meeting ACGME compliance scores on all five faculty evaluation items, but these changes were not statistically significant.
For the 26 specialties in the staff physician and outpatient group, there were more “not engaged” physicians overall (66% in 2014 to 52% in 2016), and it is not known whether a specific level of physician engagement serves as a marker for change. Scheepers et al14 performed a direct correlation study between their physician engagement survey and Dutch outpatient survey on physician communication, finding no association. Their 1-year study used an overall physician engagement mean based on the nine-item Utrecht Work Engagement Scale whereas our 3-year study used only “fully engaged” physician data for analyses. Nevertheless, our study using common US measures supports the Dutch instrument findings of a lack of association between physician engagement and outpatient satisfaction with physician communication. No other such studies have been reported in the literature for comparison.
For the 25 specialties in the staff physician and resident group, as physician engagement grew significantly across time, more residents reported a “positive” view of their program and more specialties met or exceeded national compliance scores for all five faculty evaluation items, but these changes were not statistically significant. Gruppen et al21 suggested that residents were more satisfied with their learning environment when assessed at the institutional level compared to specialty level. Our study findings reflect residents’ views at the specialty level. In The Netherlands, Scheepers et al15 examined differences between physicians’ clinical engagement versus teaching engagement when assessing resident evaluations of faculty using a different survey, finding only those with higher teaching engagement had better evaluations by residents. Our study was not able to differentiate between clinical and teaching engagement in the trainee analyses.
A limitation of our study is that the ACGME survey only provides national compliance percentages for faculty evaluation, and thus we could not compare actual scores as the Dutch study was able to do. Because we aimed to assess physician engagement in relation to outpatient experience and trainee satisfaction across time, our study was limited by use of summary statistical analyses rather than individual-level data comparisons. Nevertheless, our study offers insight into the national concern of improving the patient experience and organizations’ attempts to improve physician engagement as a means to do so.
Conclusion
For our large medical group, significant improvement in physician engagement across time did not coincide with statistically meaningful change in the outpatient experience with physician communication or physician trainee experience with overall program and faculty evaluations. This study offers evidence that physician engagement may not directly affect these measures commonly used by US health systems, but more research is needed to confirm these findings.
Disclosure
The authors report no conflicts of interest in this work.
References
1. Manary M, Staelin R, Boulding W, Glickman SW. The patient experience and health outcomes. N Engl J Med. 2013;368:201–203. doi:10.1056/NEJMp1211775
2. Anhang Price R, Elliott MN, Zaslavsky AM, et al. Examining the role of patient experience surveys in measuring health care quality. Med Care Res Rev. 2014;71:522–554. doi:10.1177/1077558714541480
3. Richter JP, Muhlestein DB. Patient experience and hospital profitability: is there a link? Health Care Manage Rev. 2017;42:247–257. doi:10.1097/HMR.0000000000000105
4. Garman AN, Garcia J, Hargreaves M. Patient satisfaction as a predictor of return-to-provider behavior: analysis and assessment of financial implications. Qual Manage Health Care. 2004;13:75–80. doi:10.1097/00019514-200401000-00007
5. Burger J, Giger A. Want to increase hospital revenues? Engage your physicians. Gallup Bus J. 2014. Available from:
6. Kamins C. What too many hospitals are overlooking. Gallup Bus J. 2015. Available from:
7. Paller DA. What the doctor ordered. Gallup Bus J. 2005. Available from:
8. Daugherty Biddison EL, Paine L, Murakami P, Herzke C, Weaver SJ. Associations between safety culture and employee engagement over time. A retrospective analysis. BMJ Qual Saf. 2016;25:31–37. doi:10.1136/bmjqs-2014-003910
9. Prins JT, van der Heijden FM, Hoekstra-Weebers JE, et al. Burnout, engagement and resident physicians’ self-reported errors. Psychol Health Med. 2009;14:654–666. doi:10.1080/13548500903311554
10. Kahn WA. Psychological conditions of personal engagement and disengagement at work. Acad Manage J. 1990;33:692–724.
11. Shanafelt TD, Noseworthy JH. Executive leadership and physician well-being: nine organizational strategies to promote engagement and reduce burnout. Mayo Clin Proc. 2017;92:129–146. doi:10.1016/j.mayocp.2016.10.004
12. Perreira TA, Perrier L, Prokopy M. Hospital physician engagement: a scoping review. Med Care. 2018;56(12):969–975. doi:10.1097/MLR.0000000000000983
13. Yanchus NJ, Carameli KA, Ramsel D, Osatuke K. How to make a job more than just a paycheck: understanding physician disengagement. Health Care Manage Rev. 2018;1. doi:10.1097/HMR.0000000000000218
14. Scheepers RA, Lases LSS, Onyebuchi AA, Heineman MJ, Lombarts KMJMH. Job resources, physician work engagement, and patient care experience in an academic medical setting. Acad Med. 2017;92:1472–1479. doi:10.1097/ACM.0000000000001719
15. Scheepers RA, Arah OA, Heineman MJ, Lombarts KM. In the eyes of residents good supervisors need to be more than engaged physicians: the relevance of teacher work engagement in residency training. Adv Health Sci Educ Theory Pract. 2015;20:441–455. doi:10.1007/s10459-014-9538-0
16.
17.
18. Hargraves JL, Hays RD, Cleary PD. Psychometric properties of the consumer assessment of health plans study (CAHPS) 2.0 adult core survey. Health Serv Res. 2003;38(6 Pt 1):1509–1527.
19. Holt KD, Miller RS, Philibert I, Heard JK, Nasca TJ. Residents’ perspectives on the learning environment: data from the accreditation council for graduate medical education resident survey. Acad Med. 2010;85:512–518. doi:10.1097/ACM.0b013e3181ccc1db
20. Holt KD, Miller RS. The ACGME resident survey aggregate reports: an analysis and assessment of overall program compliance. J Grad Med Educ. 2009;1:327–333. doi:10.4300/JGME-D-09-00062.1
21. Gruppen LD, Stansfield B, Zhao Z, Sen S. Institution and specialty contribute to resident satisfaction with their learning environment and workload. Acad Med. 2015;90:S77–S82. doi:10.1097/ACM.0000000000000898
 © 2019 The Author(s). This work is published and licensed by Dove Medical Press Limited. The
full terms of this license are available at https://www.dovepress.com/terms
and incorporate the Creative Commons Attribution
- Non Commercial (unported, 3.0) License.
By accessing the work you hereby accept the Terms. Non-commercial uses of the work are permitted
without any further permission from Dove Medical Press Limited, provided the work is properly
attributed. For permission for commercial use of this work, please see paragraphs 4.2 and 5 of our Terms.
© 2019 The Author(s). This work is published and licensed by Dove Medical Press Limited. The
full terms of this license are available at https://www.dovepress.com/terms
and incorporate the Creative Commons Attribution
- Non Commercial (unported, 3.0) License.
By accessing the work you hereby accept the Terms. Non-commercial uses of the work are permitted
without any further permission from Dove Medical Press Limited, provided the work is properly
attributed. For permission for commercial use of this work, please see paragraphs 4.2 and 5 of our Terms.