Back to Archived Journals » Open Access Journal of Sports Medicine » Volume 6
Do physiological measures predict selected CrossFit® benchmark performance?
Authors Butcher S, Neyedly T, Horvey K, Benko C
Received 9 May 2015
Accepted for publication 12 June 2015
Published 31 July 2015 Volume 2015:6 Pages 241—247
DOI https://doi.org/10.2147/OAJSM.S88265
Checked for plagiarism Yes
Review by Single anonymous peer review
Peer reviewer comments 2
Editor who approved publication: Professor Freddie H Fu
Scotty J Butcher,1,2 Tyler J Neyedly,3 Karla J Horvey,1 Chad R Benko2,4
1Physical Therapy, University of Saskatchewan, 2BOSS Strength Institute, 3Physiology, University of Saskatchewan, 4Synergy Strength and Conditioning, Saskatoon, SK, Canada
Purpose: CrossFit® is a new but extremely popular method of exercise training and competition that involves constantly varied functional movements performed at high intensity. Despite the popularity of this training method, the physiological determinants of CrossFit performance have not yet been reported. The purpose of this study was to determine whether physiological and/or muscle strength measures could predict performance on three common CrossFit "Workouts of the Day" (WODs).
Materials and methods: Fourteen CrossFit Open or Regional athletes completed, on separate days, the WODs "Grace" (30 clean and jerks for time), "Fran" (three rounds of thrusters and pull-ups for 21, 15, and nine repetitions), and "Cindy" (20 minutes of rounds of five pull-ups, ten push-ups, and 15 bodyweight squats), as well as the "CrossFit Total" (1 repetition max [1RM] back squat, overhead press, and deadlift), maximal oxygen consumption (VO2max), and Wingate anaerobic power/capacity testing.
Results: Performance of Grace and Fran was related to whole-body strength (CrossFit Total) (r=-0.88 and -0.65, respectively) and anaerobic threshold (r=-0.61 and -0.53, respectively); however, whole-body strength was the only variable to survive the prediction regression for both of these WODs (R2=0.77 and 0.42, respectively). There were no significant associations or predictors for Cindy.
Conclusion: CrossFit benchmark WOD performance cannot be predicted by VO2max, Wingate power/capacity, or either respiratory compensation or anaerobic thresholds. Of the data measured, only whole-body strength can partially explain performance on Grace and Fran, although anaerobic threshold also exhibited association with performance. Along with their typical training, CrossFit athletes should likely ensure an adequate level of strength and aerobic endurance to optimize performance on at least some benchmark WODs.
Keywords: strength, aerobic, anaerobic, high-intensity, training, exercise, functional
Introduction
CrossFit® (CrossFit, Inc., Washington, DC, USA) is a relatively new but extremely popular form of multimodal exercise training that encompasses many types of functional movement patterns within a single exercise session, conducted at high intensity.1 These types of exercises are incorporated group workout sessions called “Workouts of the Day”, or WODs, usually involving a combination of movements performed in a circuit format with little to no rest periods. Although the structure of each session will vary between affiliates, each session is typically 1 hour and comprises of a specific warm-up, strength and/or skill technique work, a programmed strength or conditioning workout for 10–30 minutes, and cool down and/or mobility work. Despite CrossFit, Inc. affiliating over 11,000 gyms, and the over 200,000 athletes participating in the 2014 CrossFit Open, there is very little reported in the literature regarding the physiological aspects of CrossFit training or performance.
Within the currently available literature, CrossFit training has been shown to elicit a high acute cardiovascular training response2 as well as large increases in aerobic and anaerobic performance,3,4 while being time-efficient and enjoyable.5 Despite the emergence of these few studies, there remains a paucity of research examining the performance of CrossFit tests, or benchmarks, or of the physiological requirements of CrossFit sport competition. CrossFit benchmark WODs are designed to be reflective of multiple dimensions of physical fitness and are usually performed and repeated often within an athlete’s training cycle to monitor progress. In other sports, progress is often monitored by physiological and/or fitness tests, and their performance can be partially predicted by physiological and/or muscle performance data.6,7 Given that CrossFit competition involves using many aspects of fitness in a sport environment, it is possible that performance can be at least partially explained by physiological measures, which would have implications for directing training program design.
The purpose of this study was to determine the physiological predictors of performance in three CrossFit benchmark workouts performed by competitive CrossFit athletes. We hypothesized that: 1) physiological performance measures of maximal oxygen consumption (VO2max), anaerobic threshold (AT), respiratory compensation threshold (RCT), anaerobic power and capacity, or 1 repetition max (1RM) back squat, press, and deadlift strength would be related to CrossFit benchmark workouts “Grace”, “Fran”, and “Cindy” and 2) physiological parameters could partially predict CrossFit benchmark workout performance.
Materials and methods
Participants
Fourteen participants were recruited from CrossFit affiliates in the Canada West Region and had at least 1 year of CrossFit training experience. Participants competed in the 2014 CrossFit Open and/or Regional competitions and could perform the benchmark workouts with the prescribed loads. Nine participants completed the Open only, and five participants were also Regional competitors. All participants gave written consent for the study, which was approved by the University of Saskatchewan Biomedical Ethics Review Board in the spirit of the Declaration of Helsinki. Participants were excluded if they reported any cardiovascular, respiratory, or musculoskeletal concerns that would limit their ability to perform high-intensity exercise. Participant characteristics are presented in Table 1.
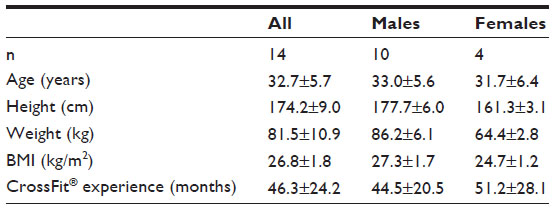 | Table 1 Participant characteristics |
Design
This study had a descriptive design, whereby participants completed three phases of data collection, including screening, the completion of CrossFit benchmark workouts, and physiological testing. Phase 1 included screening of participants with the Physical Activity Readiness Questionnaire (PAR-Q)8 to determine the eligibility for the study, and reporting of their total number of months of dedicated CrossFit training experience, which was recorded for the analysis.
In phase 2, participants performed four CrossFit benchmark workouts. The three common benchmarks used as dependent variable for the analysis of performance were the Fran, Cindy, and Grace workouts. In addition, participants’ maximal strength was assessed using the benchmark “CrossFit Total”. Each of these workouts is described in more detail below.
Phase 3 of testing involved participants performing two physiological performance measurements – a VO2max test and the 30-second Wingate Anaerobic Test (WAnT) – as described below. VO2max testing was performed at the Integrative Clinical Exercise Physiology Lab at the University of Saskatchewan. The WAnT was performed at one of the CrossFit affiliates by research staff.
Methodology
Benchmark workouts
The CrossFit benchmark workouts were selected as common workouts in CrossFit that theoretically represent a range of aerobic, anaerobic, and muscle performance variables. While all benchmark workouts likely have components of each of the predominant energy systems and of muscle strength and/or power, we can speculate that each benchmark would have greater elements of one or more components and that the use of different benchmarks may elicit different results. Fran is a fast WOD that likely has more anaerobic components, Grace is a repeated power WOD that likely has aerobic, strength, technique, and anaerobic elements, and Cindy likely has aerobic and muscle endurance elements. Each workout was performed at the participant’s home affiliate under the supervision of, and scored by, a CrossFit Level 1 trainer and/or certified CrossFit coach, to ensure the movement and workout standards were met. All participants performed the prescribed exercises and workouts with no modifications or scaling. Participants were asked to complete these workouts on separate days following at least 48 hours of recovery from a previous workout.
“Fran”
This workout is a couplet of barbell thrusters (a front squat to push press) and pull-ups following a 21-15-9 repetition scheme, where 21 thrusters were completed, then 21 pull-ups completed, 15 thrusters and 15 pull-ups, nine thrusters, and nine pull-ups completed for time. Variations of pull-ups, including butterfly and kipping, were encouraged. Thrusters were performed with 43.2 kg for males and 29.5 kg for females. The time to complete all repetitions was recorded.9
“Cindy”
A triplet of five repetitions of pull-ups, ten repetitions of push-ups, and 15 repetitions of bodyweight squats made up one round of Cindy. Participants had 20 minutes to complete as many rounds and repetitions as possible. Total rounds and repetitions were scored and converted to total number of repetitions in 20 minutes for the analysis.9
“Grace”
In Grace, 30 clean and jerks are performed for time. Power cleans or full cleans and jerk, push jerk, and split jerk variations were allowed. Male participants were required to use 61.4 kg and females to use 43.2 kg.10
“CrossFit Total”
In the CrossFit Total, participants were given 90 minutes to find, under supervision, their 1RM for back squat, press, and deadlift. For each lift starting with the back squat, an individually progressed 10-minute warm-up for each lift began at approximately 50% of participants’ previously known or estimated 1RM. After the lift-specific warm-up, participants were allowed three attempts to reach a 1RM, with 3–5 minutes rest encouraged between attempts. This procedure was also used for the press and deadlift. The individual 1RM loads were summed to determine overall score.11
Physiological testing
Testing for aerobic and anaerobic performance was completed at two separate sessions. Participants were asked to not train for at least 48 hours prior to each test session.
VO2max
An individualized test of VO2max, as a measure of aerobic power, was performed on a Trackmaster TMX 425C treadmill (Trackmaster, Newton, KS, USA), using a TrueOne Metabolic Cart (ParvoMedics, Sandy, UT, USA) for the collection of respiratory gases, and a Polar heart rate (HR) monitor (Polar Electro Canada; Lachine, QC, Canada) for measuring HR. After a standardized warm-up of 3 minutes at 5.5 kph and 1.0% grade, the test began with a speed of 7.5 kph and 1.0% grade. The speed was increased by 1.0 kph until participants reached a self-determined fast but comfortable running pace. Once the desired speed was selected, the grade was increased 1.5% every minute until volitional exhaustion. The participant was asked to rate their rate of perceived exertion (RPE) on a modified ten-point Borg Scale.12 Maximum HR, RPE, and respiratory exchange ratio (RER) values were used to determine whether a maximal test had been completed. If any two out of the following three measures was attained, the test was deemed maximal: 1) over 90% of predicted maximal HR, calculated as

2) RER over 1.1; and 3) RPE greater than 8/10. Respiratory data was used to calculate the VO2 at AT, at RCT, and at maximum.13 AT and RCT were used as measures of aerobic capacity.
WAnT
The WAnT was performed per standardized procedures,14 using 10% of participants’ bodyweight for the brake weight applied to the flywheel. Participants completed a self-paced 5-minute warm-up on the cycle ergometer (Monark 894 E; Monark, Vansbro, Sweden). Continual standardized encouragement was given to the participant throughout the test. The fixed 5-second average maximum (anaerobic power), minimum, and 30-second mean power outputs (anaerobic capacity), as well as the fatigue index, calculated as
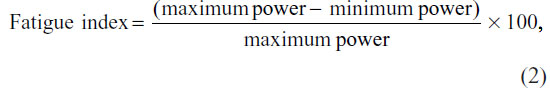
were used in the analysis.
Statistical analysis
Data analysis was performed with Statistica 8.0 (StatSoft, Tulsa, OK, USA). Simple Pearson’s r correlations were used to determine the associations between benchmark performance data, and the physiological and strength measures. For each of the dependent benchmark variables, a forward stepwise linear regression model was created using the significant correlative data. The probability of F used for variables to enter the model was less than or equal to 0.05, and to remove variables was greater than or equal to 0.10. Multicollinearity was assessed by examining each significant variable in an independent regression model. Statistical significance was set a priori at an alpha of 0.05. The data is reported as mean and standard deviation, unless otherwise indicated.
Results
Performance data and correlations
The performance measurements are shown in Table 2, and the correlations between independent and dependent variables are shown in Table 3. The results demonstrate that the benchmarks Grace and Fran correlated strongly with the strength data (CrossFit Total) as well as with the oxygen consumption at AT but not the remaining physiological data. There were no significant associations for Cindy.
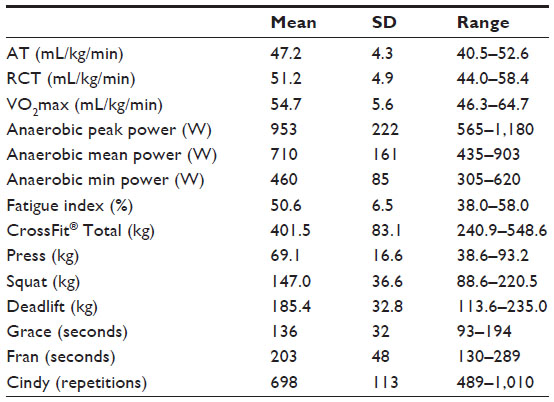 | Table 2 Performance data |
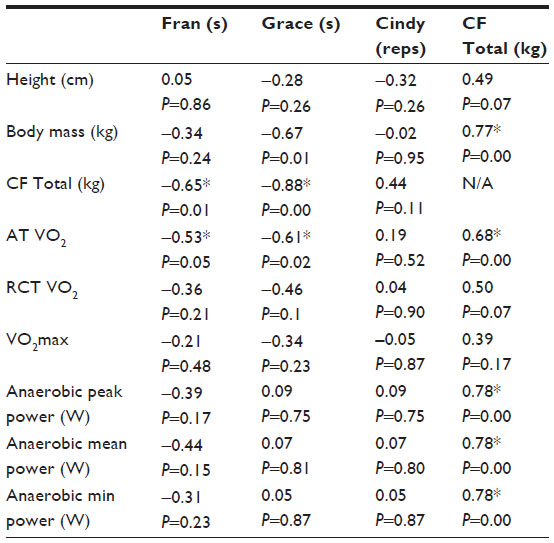 | Table 3 Correlations between CrossFit® benchmark performance and physiological measures |
Performance regression
The results of the linear regression are presented in Table 4. For both Grace (Figure 1) and Fran (Figure 2), the only predictor of performance was the CrossFit Total. Laboratory physiological data had no further impact on either prediction. For Cindy, there was no measured variable that survived the regression analysis.
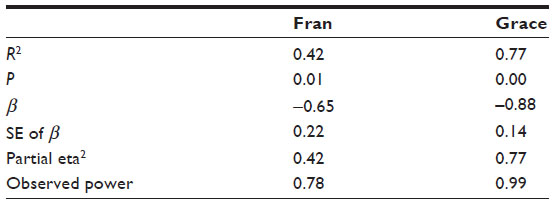 | Table 4 Regression analysis for CrossFit® benchmark workouts Fran and Grace |
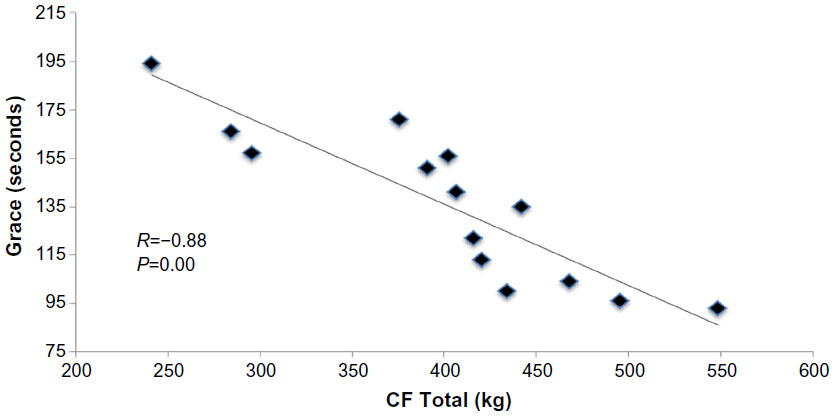 | Figure 1 Association between Grace and CrossFit® Total. |
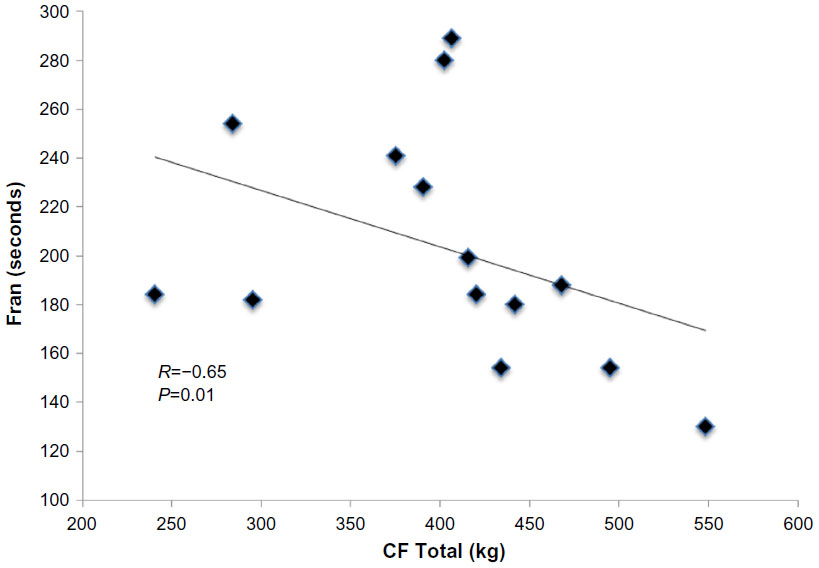 | Figure 2 Association between Fran and CrossFit® Total. |
Discussion
The overall purpose of this study was to determine the physiological predictors of performance across three CrossFit benchmark workouts. We hypothesized that physiological performance measures of aerobic, anaerobic, and strength performance would be related to benchmark workouts and that the physiological measurements would predict performance in benchmark workouts. Our data indicated partial, not full, support for our hypotheses. There were only small associations between some of the physiological data and benchmark performance (AT for Grace and Fran); however, this physiological data did not predict CrossFit benchmark performance for any of the workouts utilized in this study. The stronger associations were between the composite total body strength score, as measured by the CrossFit Total, and benchmark performance, and the CrossFit Total was the only predictor of performance in the benchmark workouts Fran and Grace.
In our selected benchmark CrossFit workouts, whole-body strength played an important role in determining performance, more so than the physiological data. The measure of whole-body strength, the CrossFit Total, explained 77% and 42% of the variance in Grace and Fran, respectively, although not in Cindy. Although the exercises themselves in both Grace and Fran are different from those in the CrossFit Total, all three workouts were barbell-based. The skill required to perform well on barbell exercises may partially explain the closer association among these three workouts than with the nonbarbell workout, Cindy. In addition, whole-body strength is very important for many sports15 and in particular, when the intensity of the sport/activity is high6,16 compared with lower intensity, longer duration activity.7 When examining the role of strength in the sport of weightlifting, performance of the clean and the snatch can be each highly explained by the athletes’ 1RM back squat strength.17 Stone et al17 found that back squat strength explained 87% of the variance in the 1RM performance of the clean. This prediction is slightly higher than that obtained in the present study for the clean- and jerk-based Grace, which is likely explained by the fact that Grace is repeated for 30 repetitions and likely has an element of fatigue tolerance not captured purely by strength data or the physiological data collected for this study. Fatigue across multiple repetitions of strength exercises reduces the efficiency of biomechanical technique and may have an impact on lifting performance.18 In contrast, whole-body strength did not play an important role in the performance of the bodyweight movement workout Cindy. It is possible that because performance of Cindy involves the difficult bodyweight movement pull-ups and push-ups, specific strength in these movements or other physiological measures may play more important roles than the movements tested in the CrossFit Total and the physiological measures used in this study. Further study is required to determine the validity of this proposition.
Given that the CrossFit is the self-proclaimed “Sport of Fitness”,1 the lack of association between the physiological fitness data collected in this study and the benchmark workouts is somewhat surprising. However, CrossFit defines fitness as the development of increased work capacity across broad time and modal domains,1 rather than as single or a combination of traditional fitness measures, such as VO2max or anaerobic capacity. Contrary to our hypotheses, our data support the assertion that these traditional measures cannot adequately predict performance for the benchmarks assessed. The only associations, albeit moderate ones, between CrossFit benchmark performance and our physiological data were with AT for Grace and Fran. These associations support previous findings of a limited importance of the aerobic energy system in optimal performance of higher intensity, repeated anaerobic work.19–21 Because different CrossFit benchmark WODs, as well as those programmed for CrossFit competitions, such as the CrossFit Games, likely have different physiological demands, the results of our study are not be applicable across all WODs. For example, WODs with a running component, such as “Helen” (400 m run, 21 kettlebell swings, and 12 pull-ups, for three rounds) or “Nancy” (400 m run and 15 overhead squats, for five rounds) may be better reflected by physiological data collected during a running VO2max test.
The results of our study are limited to a small number of experienced CrossFit Open and Regional athletes and may therefore not apply to the more elite athletes (ie, CrossFit Games participants) or to beginners. There are very little data available at present with which we can compare the results of our study; however, the physiological data on our participants were very similar to those obtained by Smith et al for the above-average athlete level of VO2max3 and those of Outlaw et al for both VO2max and anaerobic power.4 It is reasonable to assume that our data is likely representative of most experienced Open- and Regional-level competitors for the WODs assessed; however, future work should examine whether these relationships and predictors remain across all levels of athlete and for different WODs. In addition, these data are limited to cross-sectional analysis, and the longitudinal outcomes of various methods of training should be examined.
Practical implications
The constantly varied nature of CrossFit training and benchmark performance likely necessitates a focus on multiple physiological adaptations; however, along with their training, CrossFit athletes should ensure an adequate amount of whole-body strength to optimize CrossFit benchmark performance, at least for the benchmarks Grace and Fran. In addition, because of the small association between Grace and Fran and AT, there is likely an impact of the development of an adequate aerobic base on the performance of these WODs, although this can likely be accomplished through regular CrossFit training with varied programming.3 Future research should address, in more detail, the physiological adaptations that occur with CrossFit training and their relationship with benchmark WOD performance.
Conclusion
The performance of three common CrossFit Benchmark WODs (Grace, Cindy, and Fran) cannot be adequately predicted by traditional measures of aerobic and anaerobic power and capacity. Whole-body strength, as measured with the CrossFit Total, was a greater predictor of performance on select CrossFit benchmarks than were the treadmill VO2max and WAnT tests, in Open- and Regional-level CrossFit athletes, while AT had only a small association with Grace and Fran.
Acknowledgments
The authors would like to acknowledge the valued assistance of the athlete participants and coaches at CrossFit Brio, Synergy Strength and Conditioning (CrossFit Saskatoon), and Reebok CrossFit 306.
Disclosure
SB is an unpaid consultant with Synergy Strength and Conditioning (CrossFit Saskatoon), which is a registered CrossFit affiliate. CB is co-owner of Synergy Strength and Conditioning (CrossFit Saskatoon), which is a registered CrossFit affiliate. The authors report no other conflicts of interest in this work.
References
Glassman G. Understanding CrossFit. CrossFit Journal. 2007;56:1–2. | |
Babiash PE. Determining The Energy Expenditure and Relative Intensity of Two CrossFit Workouts [master’s thesis]. La Crosse: University of Wisconsin – La Crosse; 2013. | |
Smith MM, Sommer AJ, Starkoff BE, Devor ST. Crossfit-based high-intensity power training improves maximal aerobic fitness and body composition. J Strength Cond Res. 2013;27(11):3159–3172. | |
Outlaw JJ, Wilborn CD, Smith-Ryan AE, et al. Effects of a pre-and post-workout protein-carbohydrate supplement in trained crossfit individuals. Springerplus. 2014;3:369. | |
Heinrich KM, Patel PM, O’Neal JL, Heinrich BS. High-intensity compared to moderate-intensity training for exercise initiation, enjoyment, adherence, and intentions: an intervention study. BMC Public Health. 2014;14:789. | |
Akça F. Prediction of rowing ergometer performance from functional anaerobic power, strength and anthropometric components. J Hum Kinet. 2014;41:133–142. | |
Dellagrana RA, Guglielmo LG, Santos BV, Hernandez SG, da Silva SG, de Campos W. Physiological, anthopometric, strength, and muscle power characteristics correlates with running performance in young runners. J Strength Cond Res. 2015;29(6):1584–1594. | |
Canadian Society for Exercise Physiology. PAR-Q and You. Ottawa, ON: Canadian Society for Exercise Physiology; 2002. Available from: http://www.csep.ca/cmfiles/publications/parq/par-q.pdf. Accessed July 6, 2015. | |
Glassman G. Benchmark workouts. CrossFit Journal. 2003;13:1–5. | |
Glassman G. The New Girls. CrossFit Journal. 2004;4:1–2. | |
Rippetoe M. The CrossFit Total. CrossFit Journal. 2006;52:1–4. | |
Borg GA. Psychophysical Bases of Perceived Exertion. Med Sci Sports Exerc. 1982;14(5):377–381. | |
Simon J, Young JL, Gutin B, Blood DK, Case RB. Lactate accumulation relative to the anaerobic and respiratory compensation thresholds. J Appl Physiol Respir Environ Exerc Physiol. 1983;54(1):13–17. | |
Bar-Or O. The Wingate anaerobic test. An update on methodology, reliability and validity. Sports Med. 1987;4(6):381–394. | |
Stone MH, Moir G, Glaister M, Sanders R. How much strength is necessary? Phys Ther Sport. 2002;3(2):88–96. | |
Stone MH, Sands WA, Carlock J, et al. The importance of isometric maximum strength and peak rate-of-force development in sprint cycling. J Strength Cond Res. 2004;18(4):878–884. | |
Stone MH, Sands WA, Pierce KC, Carlock J, Cardinale M, Newton RU. Relationship of maximum strength to weightlifting performance. Med Sci Sports Exerc. 2005;37(6):1037–1043. | |
Hooper DR, Szivak TK, Distefano LJ, et al. Effects of resistance training fatigue on joint biomechanics. J Strength Cond Res. 2013; 27(1):146–153. | |
Bishop D, Edge J, Goodman C. Muscle buffer capacity and aerobic fitness are associated with repeated-sprint ability in women. Eur J Appl Physiol. 2004;92(4–5):540–547. | |
Bogdanis GC, Nevill ME, Boobis LH, Lakomy HK. Contribution of phosphocreatine and aerobic metabolism to energy supply during repeated sprint exercise. J Appl Physiol (1985). 1996;80(3):876–884. | |
McGawley K, Bishop DJ. Oxygen uptake during repeated-sprint exercise. J Sci Med Sport. 2015;18(2):214–218. |
 © 2015 The Author(s). This work is published and licensed by Dove Medical Press Limited. The
full terms of this license are available at https://www.dovepress.com/terms
and incorporate the Creative Commons Attribution
- Non Commercial (unported, 3.0) License.
By accessing the work you hereby accept the Terms. Non-commercial uses of the work are permitted
without any further permission from Dove Medical Press Limited, provided the work is properly
attributed. For permission for commercial use of this work, please see paragraphs 4.2 and 5 of our Terms.
© 2015 The Author(s). This work is published and licensed by Dove Medical Press Limited. The
full terms of this license are available at https://www.dovepress.com/terms
and incorporate the Creative Commons Attribution
- Non Commercial (unported, 3.0) License.
By accessing the work you hereby accept the Terms. Non-commercial uses of the work are permitted
without any further permission from Dove Medical Press Limited, provided the work is properly
attributed. For permission for commercial use of this work, please see paragraphs 4.2 and 5 of our Terms.