Back to Journals » International Journal of Nanomedicine » Volume 13
Dextran-coated superparamagnetic iron oxide nanoparticles for magnetic resonance imaging: evaluation of size-dependent imaging properties, storage stability and safety
Authors Unterweger H ![]() , Dézsi L
, Dézsi L ![]() , Matuszak J, Janko C
, Matuszak J, Janko C ![]() , Poettler M, Jordan J, Bäuerle T, Szebeni J
, Poettler M, Jordan J, Bäuerle T, Szebeni J ![]() , Fey T
, Fey T ![]() , Boccaccini AR
, Boccaccini AR ![]() , Alexiou C
, Alexiou C ![]() , Cicha I
, Cicha I ![]()
Received 9 November 2017
Accepted for publication 1 December 2017
Published 28 March 2018 Volume 2018:13 Pages 1899—1915
DOI https://doi.org/10.2147/IJN.S156528
Checked for plagiarism Yes
Review by Single anonymous peer review
Peer reviewer comments 2
Editor who approved publication: Dr Thomas Webster
Harald Unterweger,1 László Dézsi,2,3 Jasmin Matuszak,1 Christina Janko,1 Marina Poettler,1 Jutta Jordan,4 Tobias Bäuerle,4 János Szebeni,2,3 Tobias Fey,5 Aldo R Boccaccini,6 Christoph Alexiou,1 Iwona Cicha1
1ENT Department, Section of Experimental Oncology and Nanomedicine (SEON), Else Kröner-Fresenius-Stiftung Professorship, Universitätsklinikum Erlangen, Erlangen, Germany; 2Nanomedicine Research and Education Center, Institute of Pathophysiology, Semmelweis University, Budapest, Hungary; 3SeroScience Ltd., Budapest, Hungary; 4Institute of Radiology, Preclinical Imaging Platform Erlangen, Universitätsklinikum Erlangen, Erlangen, Germany; 5Institute of Glass and Ceramics, Department of Materials Science and Engineering, University Erlangen-Nuremberg, Erlangen, Germany; 6Institute of Biomaterials, Department of Materials Science and Engineering, University Erlangen-Nuremberg, Erlangen, Germany
Background: Rising criticism of currently available contrast agents for magnetic resonance imaging, either due to their side effects or limited possibilities in terms of functional imaging, evoked the need for safer and more versatile agents. We previously demonstrated the suitability of novel dextran-coated superparamagnetic iron oxide nanoparticles (SPIONDex) for biomedical applications in terms of safety and biocompatibility.
Methods: In the present study, we investigated the size-dependent cross-linking process of these particles as well as the size dependency of their imaging properties. For the latter purpose, we adopted a simple and easy-to-perform experiment to estimate the relaxivity of the particles. Furthermore, we performed an extensive analysis of the particles’ storage stability under different temperature conditions, showing their superb stability and the lack of any signs of agglomeration or sedimentation during a 12 week period.
Results: Independent of their size, SPIONDex displayed no irritation potential in a chick chorioallantoic membrane assay. Cell uptake studies of ultra-small (30 nm) SPIONDex confirmed their internalization by macrophages, but not by non-phagocytic cells. Additionally, complement activation-related pseudoallergy (CARPA) experiments in pigs treated with ultra-small SPIONDex indicated the absence of hypersensitivity reactions.
Conclusion: These results emphasize the exceptional safety of SPIONDex, setting them apart from the existing SPION-based contrast agents and making them a very promising candidate for further clinical development.
Keywords: CARPA, cross-linking, irritation potential, MRI, SPION, storage stability
Introduction
The development of suitable imaging modalities is one of the key requirements to detect diseases at the earliest possible stage, select an appropriate dose and timing of the therapy, and monitor the disease progression. One of the most important imaging tools in this regard is magnetic resonance imaging (MRI), which utilizes magnetic fields instead of ionizing radiation to excite protons. It also possesses acceptable spatial resolution and soft tissue contrast.1 In order to significantly enhance the contrast and to extend the application area of MRI, contrast agents are required. Since these agents are applied intravenously, certain prerequisites must be fulfilled, including low toxicity, good biocompatibility, suitable imaging properties, blood stability, as well as a defined biodistribution and elimination.2 Gadolinium-based contrast agents (GBCAs) are the current “gold standard” in MRI. However, despite their acceptable imaging properties as bright contrast agents, their functional imaging possibilities are very limited. Besides, GBCAs are often associated with side effects, usually due to the release of toxic gadolinium ions. Apart from minor side effects during administration, the use of GBCAs is also accompanied by an increased risk to renally impaired patients because of gadolinium retention in liver, spleen, heart, skin, kidneys, and bladder, which can lead to nephrogenic systemic fibrosis.3,4 Moreover, cerebral accumulation of gadolinium in patients with preexisting renal dysfunction can also trigger transient signs of neurological disorders.5 Recently, several studies demonstrated that upon repeated administration of GBCAs, their deposition in central nervous system structures of patients with normal renal functions occurs.6,7 These concerns prompted the Pharmacovigilance Risk Assessment Committee (PRAC) of the European Medicines Agency (EMA) to recommend the suspension of the marketing authorities for four linear GBCAs in March 2017.8 To answer to the need for safer MRI contrast agents, several approaches have been proposed in the recent years. As in many other research fields, these developments were supported by the introduction of nanotechnology-based approaches and nanomaterials. In general, nanomaterials are defined as natural or engineered materials with at least one characteristic size in the range between 1 and 100 nm. Properties of nanomaterials significantly differ from their conventional bulk forms due to this characteristic size, although they possess the same chemical composition.9 Superparamagnetic iron oxide nanoparticles (SPIONs) represent one of the promising candidates that emerged from these developments. Due to their size-dependent change in magnetic properties, they have potential to be used in many diverse applications, especially in medicine. SPIONs have strong T2 time and T2* time effects in MRI (ie, they produce dark contrast) and are detectable at relatively low concentrations. This allows an increase in MRI sensitivity almost to the cellular level and enables their use for in vivo cell visualization and tracking.10–12 Until now, three SPION-based agents have been clinically approved as intravascular contrast agents for MRI, namely, ferumoxide (trade names: Feridex, Endorem), ferucarbotran (trade name: Resovist), and ferumoxtran-10 (trade name: Sinerem). These contrast agents were in the clinical use for diagnostic applications such as imaging of lymph nodes, intestine, liver, and the cardiovascular system.13–15 The administration of these particles was reportedly associated with characteristic side effects, most commonly hypertension and leg pain, observed in 10% of ferumoxide- and 7.1% of ferucarbotran-receiving patients.16 Both agents were withdrawn from the market, mainly due to economic reasons, although diagnostic issues were also involved, leaving the need for T2 and T2* time contrast agents unanswered.
In our previous study,17 we described a novel SPION-based contrast agent, characterized by a remarkable biocompatibility and non-immunogenicity. Its safety and size tunability make it a highly interesting nanosystem for many imaging applications. In the current study, we closely investigated the synthesis optimization of these particles. In addition, we evaluated the relaxivity of differently sized particles and examined their storage stability under different temperature conditions. Subsequently, we tested the particle uptake in human endothelial and monocytic cells and determined their irritation potential in a chick chorioallantoic membrane (CAM) assay. Finally, we evaluated the risk of hypersensitivity reactions by performing complement activation-related pseudoallergy (CARPA) reaction tests in pigs.
Methods
Particle synthesis
In order to investigate the size-dependent imaging properties of dextran-coated SPIONs (SPIONDex), five different sizes, ranging from 30 to 130 nm, were fabricated according to a cold gelation method as previously described.17 The typical synthesis steps, leading to production of particles with a hydrodynamic diameter of ~50 nm, are briefly described here. In the beginning, 150 mM iron in the form of FeCl3 and FeCl2 was dissolved in a 10 wt% T-40 dextran solution. The formed solution was cooled in an ice bath, and the particle formation was initiated by the addition of ice-cooled 25 vol% ammonia. Afterward, the particles were heated and kept at 75°C for 30 minutes, followed by cooling to room temperature. Subsequently, the suspension was purified by dialysis and ultrafiltration.
In the next step, the dextran layer was cross-linked with epichlorohydrin (ECH) to ensure an enhanced particle stability. To investigate the optimal cross-linking conditions, three differently sized SPIONDex, ie, with sizes of 30, 50, and 80 nm, were used. Briefly, particles with an iron concentration range between 1 and 5 mg/mL were treated with ECH (5–20 vol%) under stirring for different time periods (0.5–24 h). After cross-linking, particles were again purified and concentrated via dialysis and ultrafiltration, leading to a colloidally stable particle suspension. Finally, the particles were sterile filtered through 0.22 μm syringe filters and stored at 4°C until further use.
Dynamic light scattering and determination of isoelectric point (IEP)
The hydrodynamic size of the particles was measured using a Nanophox device (Sympatec, Clausthal-Zellerfeld, Germany) by dynamic light scattering in a cross-correlation mode. The two He–Ne laser beams were operated at a wavelength of 623.8 nm with a focus point at 90/90% (x/y). The samples were equilibrated at 25°C and then measured for 2 minutes in triplicate, and the obtained results were averaged. For the determination of the IEP, a Stabino titration device (Particle Metrix, Meerbusch, Germany) was utilized. In an aqueous dispersion of the particles, the iron concentration was set to 100 μg Fe/mL and the pH was adjusted with 0.02 M HCl and 0.02 M NaOH. A 400 μm piston, with a mixing time of 10 seconds and a titration volume of 10 μL, was used for the measurement. The measurements were performed in triplicate, and the results were averaged.
Atomic emission spectroscopy (AES) and magnetic characterization
Iron concentrations of the samples were acquired with an AES device (MP-4200; Agilent Technologies, Santa Clara, CA, USA). For this purpose, samples were dissolved in nitric acid at 95°C for 10 minutes and afterward diluted with water. The concentration was determined by comparing the emission of the samples at 372 nm with the values from a calibration curve, which was derived from a commercial iron standard. The experiment was performed in triplicate, and the results were averaged.
The solid content of the particles was determined by measuring the weight before and after water evaporation of aliquots. With this result and by taking the iron concentration into account, the ratio of organic layer to iron oxide core within the different colloids was calculated.
The particles’ magnetic properties were evaluated by measuring the volume susceptibility with an MS2G magnetic susceptibility device (Bartington Instruments, Witney, UK). It was necessary to acquire the susceptibility of the particles at a fixed iron concentration, in this case 1 mg Fe/mL in an aqueous solution, because the magnetic susceptibility of a particle dispersion is dependent on the particle concentration. In addition, to investigate the behavior of the susceptibility in complex media such as blood, selected particles were dispersed in freshly drawn, EDTA-anticoagulated blood from human volunteers. After 24 h of incubation, concentration-related measurements were performed, with water-dispersed particles as a control. The experiment was performed in triplicate, and the results were averaged.
Fourier transform infrared spectroscopy
To analyze the cross-linking efficiency, Fourier transform infrared spectroscopy (FTIR) spectra were collected using the Alpha FTIR device (Bruker Optics Inc, Billerica, MA, USA) in the mid-infrared region from 4,000 to 400 cm−1 in the KBr mode. For this purpose, 2 mg of lyophilized particles were ground with 200 mg KBr and pressed into a pellet. For each sample, 128 spectra were recorded and averaged. All spectra were normalized to the C−O−C band of dextran at ~1,006 cm−1 in order to compare the intensities of the single bands.
X-ray diffraction (XRD)
θ/2θ XRD measurements were performed with a D500 XRD device (Bruker Optics Inc). The Cu·Kα1 beam (λ=0.15406 nm) was used as an X-ray source in an angular range between 25° and 80° with a step size of 0.02°/s. Using Bragg’s law, the interplanar spacing dhkl and the lattice parameter α for cubic crystal structures can be determined as follows:18
|
|
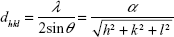
with θ as the diffraction angle and h, k, and l as the Miller indices of the diffraction plane.
The crystallite size DXRD of the sample can be calculated from the Debye–Scherrer formula:
|
|

where β is the full-width at half maximum value of the XRD diffraction lines.18
In order to distinguish between size and strain broadening of the XRD peaks, the Williamson–Hall method was applied, which can be expressed using the following equation:19
|
|
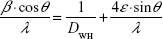
By plotting  vs 4sin θ/λ, the crystal size according to Williamson–Hall DWH and the strain ε can be obtained by the intercept and the slope of the acquired line.
MRI analyses
MRI measurements were performed at room temperature, with a 7 T MRI ClinScan®, equipped with a circular polarized 1H mouse whole body radiofrequency (RF) coil and a corresponding animal bed (Bruker BioSpin, Ettlingen, Germany). Table 1 summarizes the sequence parameters used to measure T1, T2, and T2* times. In order to investigate the correlation between relaxivity and susceptibility of the particles, SPIONDex with five different susceptibilities, ie, different particle sizes, were used. The particles at different iron concentrations (0–10 μg/mL) were filled in 0.25 mL microcentrifuge tubes containing 1 vol% agarose. To reduce the vibrations during the measurement, the tubes were additionally embedded in 5 vol% agarose. The MRI sequences were consecutively repeated five times, while imaging and calculation of relaxation times in voxel-by-voxel relaxation time maps were performed using the syngo® MR software (Siemens Healthineers, Erlangen, Germany). Analysis was performed with OsiriX (aycan Digitalsysteme GmbH, Würzburg, Germany). After MRI, the iron concentrations of the particle-containing gels were again determined to calculate the exact concentration. From the relaxation time T, the relaxation rate R was determined as:20
|
|

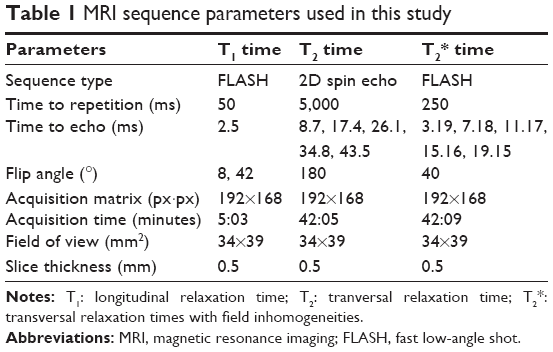 | Table 1 MRI sequence parameters used in this study |
Determination of the relaxation rate for different iron concentrations was used to calculate the relaxivity r, as described using the following equation:20
|
|

where cnp is the iron concentration of the particles and Rd is the diamagnetic relaxation rate of the dispersion medium. The experiments were performed three times in triplicate, ie, in total nine repetitions, and the results were averaged.
Storage stability
SPIONDex with three different sizes (~30, ~50, and ~80 nm) were stored at 4, 20, or 37°C for 12 weeks. Size, ζ potential, pH, FTIR spectra, susceptibility, and iron content of the supernatants were examined weekly, according to the methods described previously in this paper. In addition, the color change of the particles was determined with a Libra S22 UV/Vis spectrophotometer (Biochrom, Berlin, Germany) in the range between 300 and 800 nm. Furthermore, the osmolarity of undiluted particle dispersions was measured with an OM15 osmometer (Vogel Medizintechnik, Fernwald, Germany). Prior to these measurements, the device was calibrated with water and a 300 mOsm standard NaCl solution. All experiments were performed in triplicate, and the results were averaged.
Cell culture
Human umbilical vein endothelial cells (HUVECs) were isolated from freshly collected umbilical cords, kindly provided by Prof Beckmann (Department of Gynecology, Universitätsklinikum Erlangen, Erlangen, Germany), using an established technique.21 The cells were cultured in endothelial cell growth medium with an appropriate supplement, containing 5 vol% fetal calf serum, 4 μL/mL heparin, 10 ng/mL epidermal growth factor, and 1 μg/mL hydrocortisone. HUVECs at passages 1–2 were used in all experiments. THP-1 monocytic cells (TIB-202; American Type Culture Collection [ATCC], Manassas, VA, USA) were cultured in Roswell Park Memorial Institute (RPMI) 1640 medium supplemented with 2 mM glutamine, 100 U/mL penicillin, 100 μg/mL streptomycin, and 10 vol% fetal calf serum. THP-1-derived macrophages were obtained by treating THP-1 monocytes with 20 ng/mL phorbol myristate acetate for 72 hours. The resulting macrophages were washed and treated with different concentrations of SPIONs as described in the following. The use of human material was approved by the local ethics committee of the Universitätsklinikum Erlangen. All cells and cell lines were cultured at 37°C, 95% humidified air, and 5% CO2. Prior to the experiments, cells were counted and viability was assessed with a Muse® Cell Analyzer (EMD Millipore, Billerica, MA, USA).
Cell uptake of SPIONDex
To measure the uptake of SPIONDex30 (30 nm, 0–400 μg Fe/mL), cells were harvested 3, 6, and 24 hours after particle application, washed with medium, and counted with the Muse® Cell Analyzer. After harvesting, all samples were centrifuged to form a pellet, which was dissolved in 100 μL 65% nitric acid at 95°C for 10 minutes. After the addition of 450 μL water, the iron concentration of the samples was determined by AES as described earlier. The measured iron concentrations were normalized to the cell number of the samples. Experiments were performed in triplicate, and the results were averaged. The statistical significance was investigated using one-way analysis of variance (ANOVA; *p<0.05, **p<0.005, and ***p<0.001).
Chick CAM assay
The irritation potential of SPIONDex (6.6 mg Fe/mL) was tested with a CAM assay, as described by Luepke.22 Briefly, fertilized, pathogen-free eggs (VALO Biomedia, Osterholz-Scharmbeck, Germany) were incubated at 37.5°C±0.5°C and a relative humidity of 55%±7% (JANOEL8-48; WilTec, Eschweiler, Germany). At day 10, a hole with a diameter of 2 cm was made at the air cell’s position. The inner egg membrane was carefully removed, exposing the vascularized CAM. Then, 100 μL of the undiluted test sample was pipetted onto CAM, followed by incubation for 5 minutes. Afterward, the CAM was analyzed for potential irritant effects, including hyperemia, hemorrhage, and coagulation, which were scored from 0 (no effect) to 5 (very strong effect). Sodium dodecyl sulfate (SDS; 0.5 wt%) was used as a positive control and PBS as a negative control. The experiment was repeated three times for every substance, and the resulting scores were averaged.
CARPA reaction
The analysis of CARPA reaction to SPIONDex infusion was performed according to established protocol by Szebeni et al.23 In short, domestic male Yorkshire pigs (20–25 kg) were intubated with endotracheal tubes in order to maintain the respiratory passages free and were anesthetized with 2–3 vol% isoflurane in oxygen. The body temperature was measured rectally, and the oxygen saturation was noninvasively monitored using a pulse oximeter fixed on the tail. A CAP10 capnograph (Medlab, Stutensee, Germany) was utilized to monitor the respiratory rate and end-expiratory CO2 concentration. To measure the pulmonary artery pressure (PAP), a Swan-Ganz catheter (AI-07124; Teleflex, Athlone, Ireland) was introduced into the pulmonary artery via the right external jugular vein. The systemic arterial pressure (SAP) was measured in the femoral artery. All test substances were injected into the animals in bolus via the left external jugular vein. SPIONDex with a hydrodynamic size of 30 nm were injected at a concentration of 0.5 and 5 mg Fe/kg. Zymosan (0.1 mg/mL) served as a positive control and saline solution as a negative control. Hemodynamic changes were continuously monitored with an AD Instruments PowerLab System (Bella Vista, NSW, Australia) using LabChart Pro v6 software operated at a sampling rate of 1 kHz. In all, 20-second intervals of the heart rate (HR), PAP, and SAP were averaged and processed by AD Instruments LabChart Pro v6 software modules. Respective blood samples were collected before and after the application of the test substances, in order to determine the thromboxane B2 (TXB2) levels in plasma with enzyme-linked immunosorbent assay (ELISA; Cayman Chemical Co., Ann Arbor, Michigan, USA). Experiments were performed in duplicate. The study was approved by the local ethics committee (ÁTET, Hungary) for animal experimentation. The guidelines for animal welfare and animal testing of the Government of Hungary were followed in this study (Decree No 40/2013 [II. 14.]).
Results
SPIONDex were synthesized by a cold gelation process, which involves the coprecipitation of an ice-cold ferrous and ferric chloride salt solution with NH3 in the presence of dextran. As previously demonstrated, the size of the particle clusters can be easily tuned by varying the dextran and iron concentrations during the coprecipitation process.17 Another crucial part of the particle synthesis is the cross-linking of the polymer shell via ECH.
Investigation of the cross-linking reaction
For the parametrization of the cross-linking, it must be known whether the particle size influences this procedure. To test this, three differently sized particles were chosen, with different respective curvatures and steric accessibilities for ECH to react. The selected sizes were ~30 nm (SPIONDex30), ~50 nm (SPIONDex50), and ~80 nm (SPIONDex80). At first, ECH and iron concentration of the particle suspensions were varied at a fixed reaction time of 24 hours, and the resulting change in hydrodynamic size was monitored (Figure 1A–C). An increase of ~5 nm occurred at 1 mg Fe/mL for all three particle sizes. With rising iron concentration, corresponding to a higher amount of dextran, particles behaved differently. While a high ECH content had only little effect on the hydrodynamic size of SPIONDex80 and SPIONDex50, a dramatic change was observed in the size of SPIONDex30. Above 3 mg Fe/mL, as well as at higher ECH concentrations, the particle size grew very fast, and at the highest concentration, it was almost tripled. To investigate the time-dependency of the reaction, medium values of reactants’ concentrations were chosen, ie, 12.5 vol% ECH and 3 mg Fe/mL. During the first 6 hours, particles showed a gradual size increase, which went into saturation (Figure 1D). Corresponding FTIR measurements (Figure 1E) also demonstrated that the peak alteration was not significantly changed after 6 hours. For a more quantitative examination of the FTIR spectra, the intensity ratios of specific absorption peaks, indicated by red arrows (1,000/1,100; 920/850; 1,345/1,450; 1,415/1,450; and 1,275/1,450), were observed over the course of time. Again, within the first 6 hours of the cross-linking reaction, all ratios decreased and reached saturation (Figure 1F).
 | Figure 1 Iron concentration-dependent change in hydrodynamic size after the cross-linking procedure for 24 hours. |
Structural analysis of the particles
XRD patterns were acquired to characterize the formed inorganic crystalline phase (Figure 2A). In general, all spectra had the same peak distribution typical for the face-centered cubic spinel structure of magnetite (space group: Fd m), with a major peak at 35.4° corresponding to the (311) plane.24 Other peaks for this crystal structure were visible at 30.1° (220), 43.1° (400), 53.4° (422), 56.9° (511), and 62.5° (440). Application of Equation 1 led to the lattice parameter of the particles, which are 8.374±0.008, 8.364±0.009, and 8.395±0.003 Å for SPIONDex30, SPIONDex50, and SPIONDex80, respectively. Using the Debye–Scherrer formula (Equation 2), it was possible to attribute the peak broadenings of the XRD spectra to a certain crystal size. With this approach, the obtained results were 4.9±0.6, 4.8±0.6, and 5.5±0.6 nm for particles with 30, 50, and 80 nm hydrodynamic sizes. Besides size, microstrains were also a possible reason for peak broadening of the XRD peaks. To differentiate between those two sources of peak broadening, Williamson–Hall plots (Equation 3) were performed, which are displayed in Figure 2B–D. All samples showed a good linear correlation of the data points with a negative slope. With the Williamson–Hall method, the obtained crystallite sizes were 4.2, 4.3, and 4.5 nm for SPIONDex30, SPIONDex50, and SPIONDex80, respectively. Assuming that the particles’ core exists completely in a magnetite form, the dextran-to-magnetite ratio varied with an increasing size from 13.1%±1.5% (w/w) over 28.1%±1.7% to 30.4%±2.4% (data not shown). The ζ potential as a function of pH is displayed in Figure 2E. Regardless of size, the mean curve for all three samples was similar, with an IEP at ~4.6. At lower pH values, the ζ potential reached a weak positive charge with ~5 mV, and at high pH, the ζ potential was reduced to −8 mV.
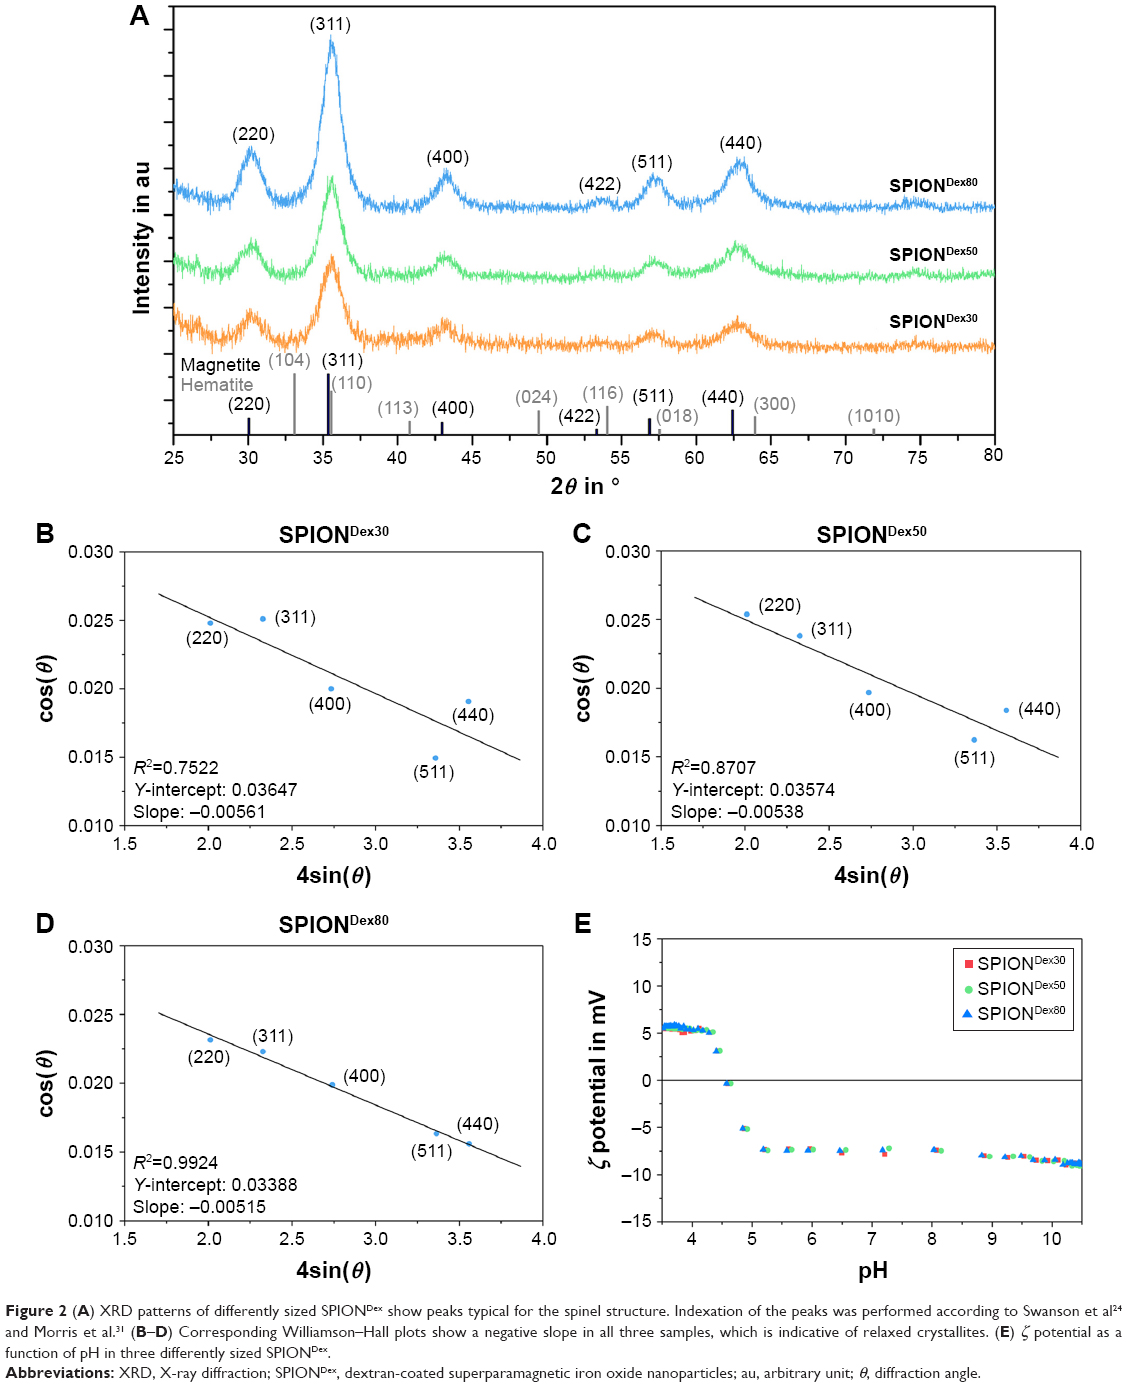 | Figure 2 (A) XRD patterns of differently sized SPIONDex show peaks typical for the spinel structure. Indexation of the peaks was performed according to Swanson et al24 and Morris et al.31 (B–D) Corresponding Williamson–Hall plots show a negative slope in all three samples, which is indicative of relaxed crystallites. (E) ζ potential as a function of pH in three differently sized SPIONDex. |
Imaging properties
One of the advantages of SPIONDex is that their size can be easily tuned by modifying the synthesis parameters and, as previously shown, that the achieved particle sizes are also in good correlation with their volume susceptibility.17 In order to analyze the relation between susceptibility and relaxivity for SPIONDex, particles with five different hydrodynamic sizes (30, 40, 50, 80, and 130 nm) were produced and the respective susceptibilities were chosen for assessing their imaging properties as described by T2 and T2* times and also T1 relaxation time map images (Table S1). For this purpose, the relaxation times of the samples, which were dispersed into agarose gels to achieve different iron concentrations, were measured using a 7 T MRI. While the data on the relaxation rate R1 and relaxivity r1 showed large standard deviations (SDs) and a poor correlation (Figure 3A and B), the data for R2 relaxation rates (Figure 3C and D) and R2* relaxation rates (Figure 3E and F) demonstrated an increase in relaxation rate with increasing iron concentration. Furthermore, a good quadratic correlation between relaxivity and susceptibility was observed. With a higher susceptibility, in this case corresponding to a larger particle size, the relaxivity values increased, ranging from 46.8 to 207.4 mM−1s−1 for r2 and from 105.8 to 319.2 mM−1s−1 for r2*, respectively.
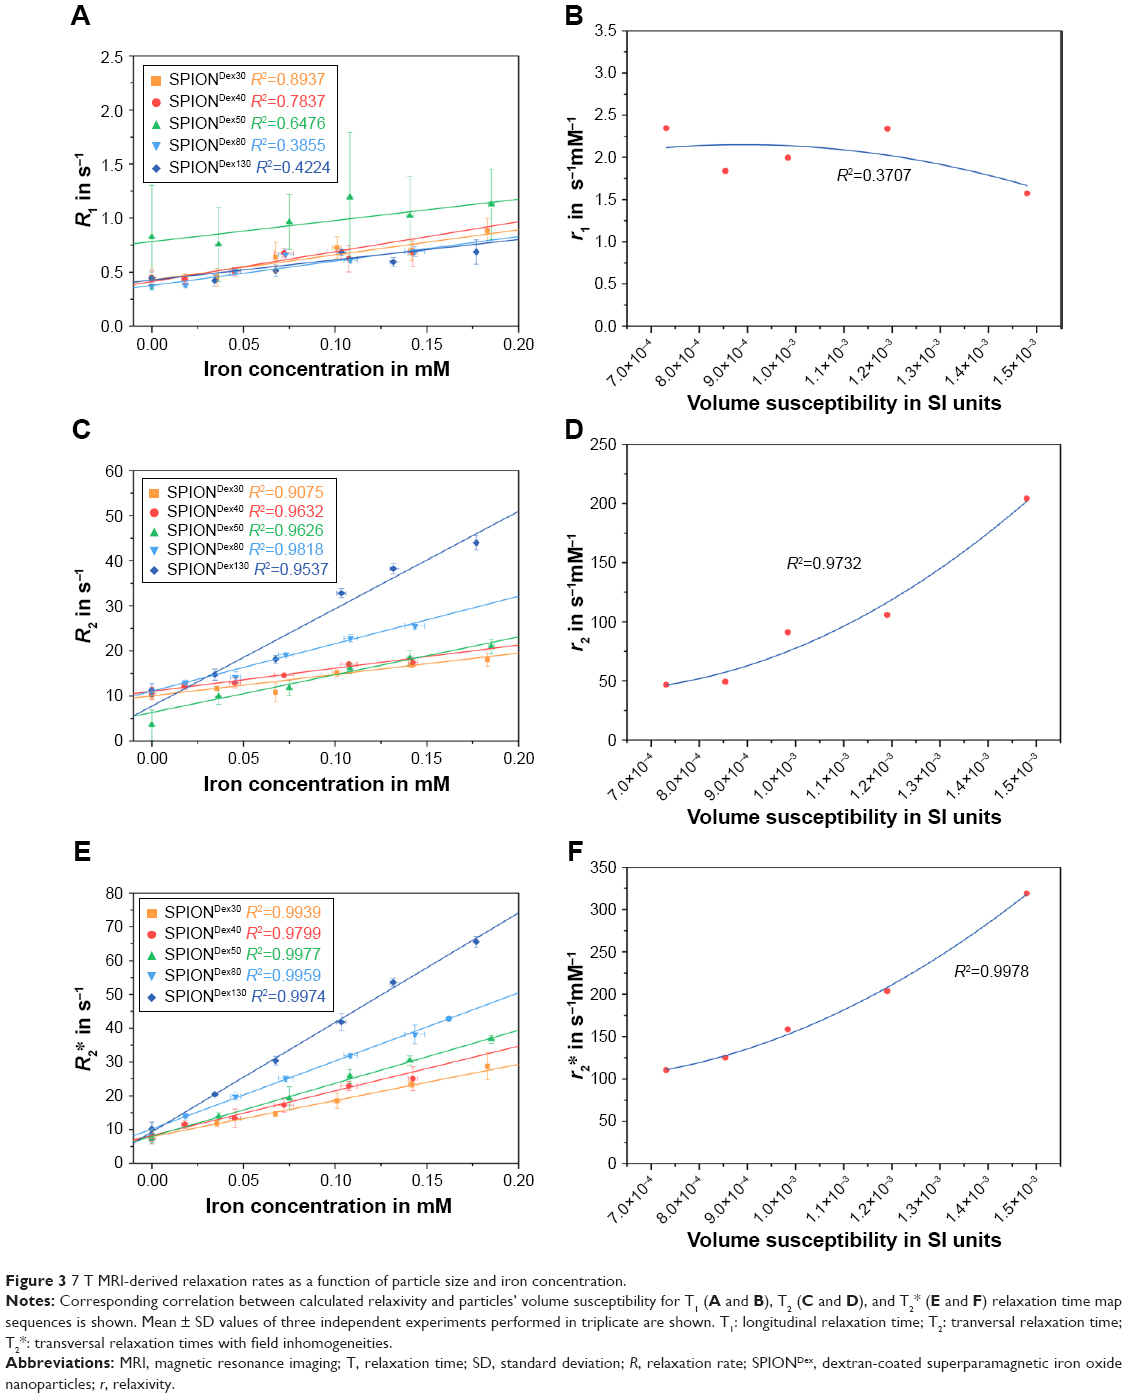 | Figure 3 7 T MRI-derived relaxation rates as a function of particle size and iron concentration. |
Storage stability
Because of their high surface-to-volume ratio, nanoparticles in general, and SPIONs in particular, have the tendency to agglomerate or sediment over time. This process can be prevented by a strong stabilizing coating, but it has also been shown that handling and storage conditions can significantly influence the behavior of nanoparticles.25 The influence of different storage conditions on the synthesized SPIONDex was assessed by storing 30, 50, and 80 nm particles for 12 weeks at three different temperatures, namely, 4, 20, or 37°C. After each week, the physicochemical properties of the particles were investigated. Over the course of time, no major differences related to the hydrodynamic size of the particles were observed, which is why only the example results of SPIONDex30 are presented here. Figure 4A shows that the different storage temperatures did not influence the hydrodynamic size of the particles. However, there was a temperature- and time-dependent change in color from brown-black to reddish-brown (Figure 4B), which was more pronounced at higher storage temperatures. The color change was quantified with relative absorbance at 478 nm by UV/Vis measurements (Figure 4C). After 12 weeks at 4°C, the original absorbance was reduced by 3% only (to 97%), but at 20°C, it was decreased over 12 weeks to 88%, and at 37°C, it was rapidly reduced to 84% and remained constant after that. XRD spectra were recorded in order to check if the change in color could be attributed to an alteration in the crystal structure (Figure 4D). Concerning peak positions and ratios, no significant differences between a sample that was stored at 37°C for 12 weeks and the freshly prepared sample were detected. However, after the storage, the calculation of the lattice constant resulted in 8.346±0.006 Å and the calculated crystallite size according to the Debye–Scherrer formula was 5.4±0.2 nm. Performing the Williamson–Hall plot (not shown) revealed a negative slope with a crystallite size of 4.7 nm. Taking the time- and temperature-dependent behavior of the change in susceptibility into account, it was possible to see a reduction in the value corresponding to the change in color (Figure 4E). Nevertheless, the FTIR spectra, hence the chemical surface of the particles, were not altered during the storage (Figure 4F).
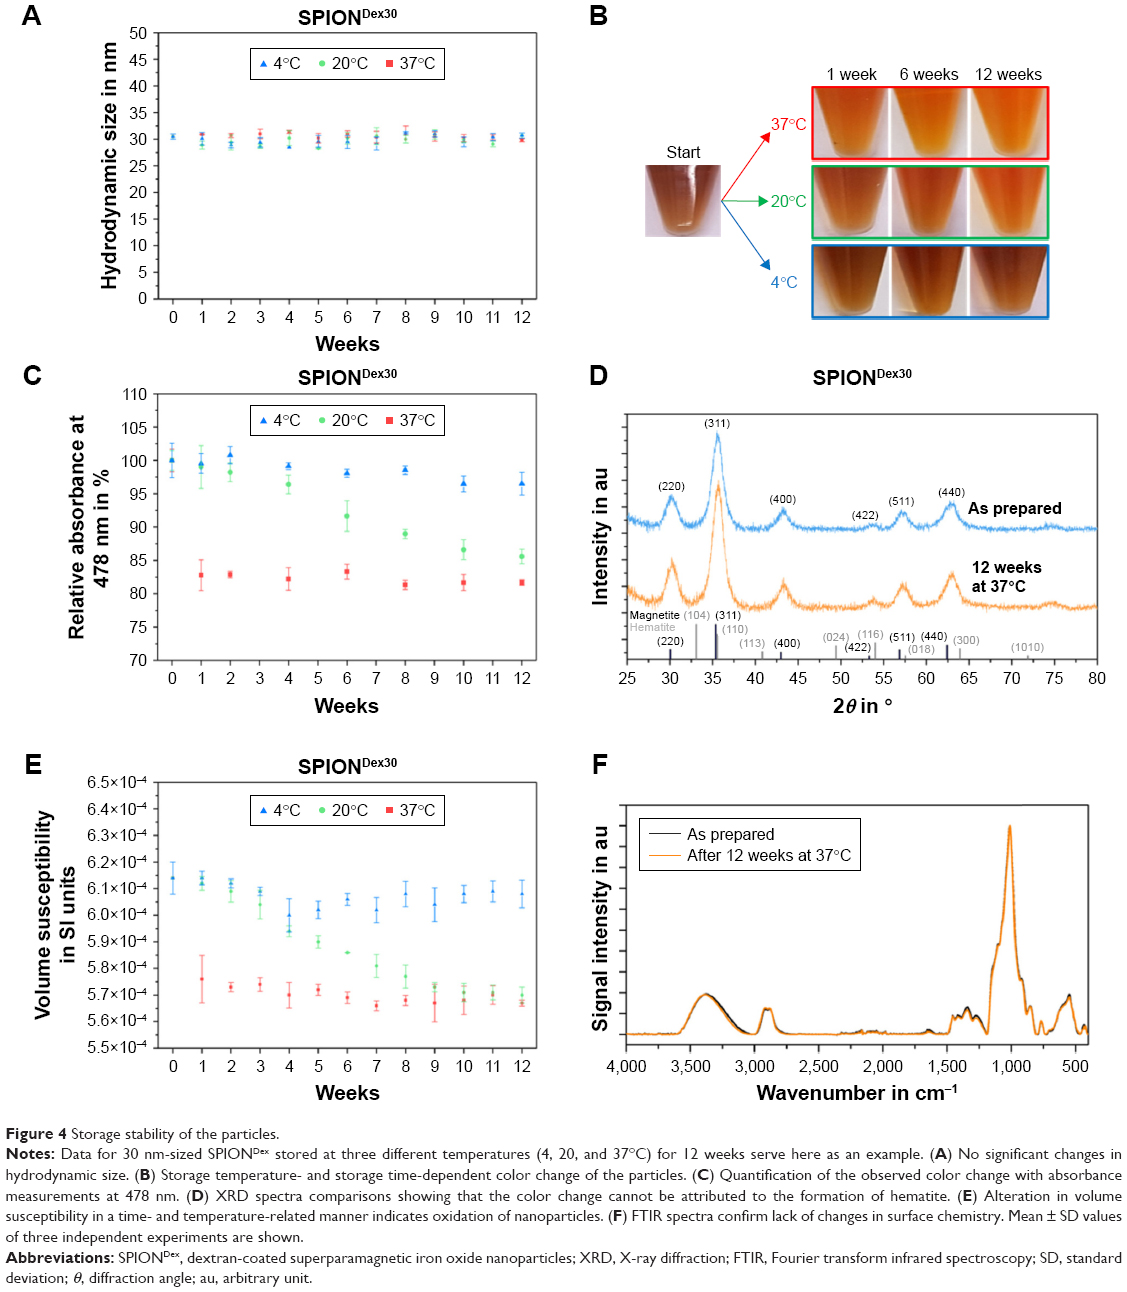 | Figure 4 Storage stability of the particles. |
Cell uptake
To evaluate the uptake of SPIONDex30 in THP-1 monocytic cells, macrophages, and HUVECs, the cells were incubated with different particle concentrations (25–400 μg/cm2) for 3, 6, and 24 hours. As expected, the highest uptake was observed for the phagocytic macrophages, leading to twofold (3 hours), fivefold (6 hours) and 11-fold (24 hours) increase in the iron load per cell in comparison to the control without particles (Figure 5). This led to maximum values of 3.5 pg Fe/cell. In HUVECs and THP-1 cells, the uptake was far less pronounced. For HUVECs, a significant increase was observed only at the highest concentration after 24 hours (400 μg/cm2). The incubation of HUVECs with 400 μg/cm2 for 24 hours resulted in an iron load of 0.5 pg Fe/cell, corresponding to three- to fourfold increase in the basal iron level. Cellular uptake of SPIONDex30 in THP-1 cells did not increase over time, but at the highest tested concentration, values of 0.15 pg Fe/cell were reached, corresponding to approximately two- to threefold increase in the basal iron level, independent of the incubation time.
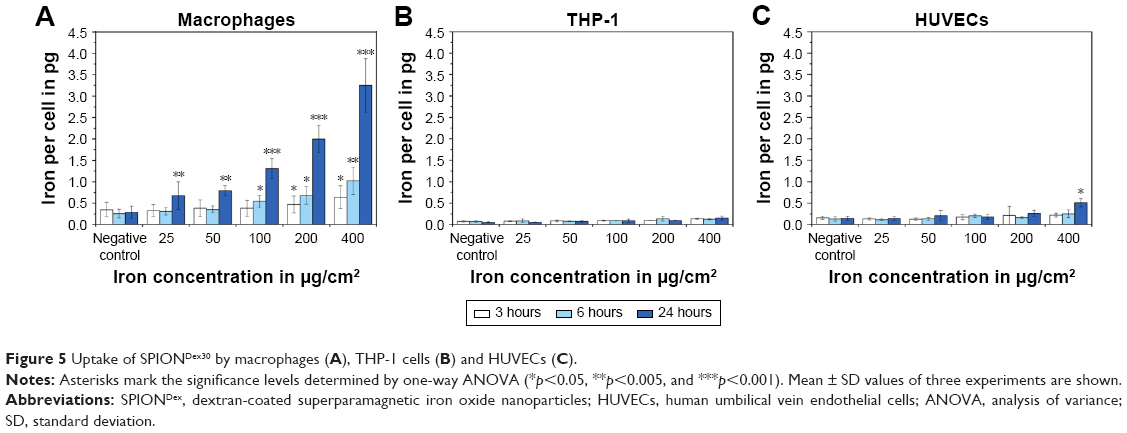 | Figure 5 Uptake of SPIONDex30 by macrophages (A), THP-1 cells (B) and HUVECs (C). |
Irritation potential and CARPA reactions
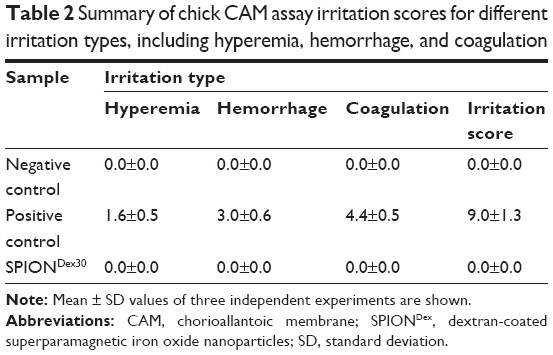
The irritation potential of SPIONDex with different sizes (30, 50 and 80 nm) was investigated using the CAM assay. Five minutes after the application of the particles (100 μL, iron concentration =6.6 mg/mL), the CAM was examined for hyperemia, hemorrhage, and coagulation, which were scored from 0 (no effect) to 5 (very strong effect). SDS, used as a positive control, achieved scores of 1.6±0.5 for hyperemia, 3.0±0.6 for hemorrhage, and 4.4±0.5 for coagulation (Figure 6A). This resulted in a total irritation score of 9.0±1.3 (Table 2). In contrast, all three SPIONDex produced an irritation score of 0.0±0.0. The data obtained using SPIONDex30 are shown in Figure 6A as an example.
 | Figure 6 In vivo application of SPIONDex. |
 | Table 2 Summary of chick CAM assay irritation scores for different irritation types, including hyperemia, hemorrhage, and coagulation |
In the next step, the risk of SPIONDex30 injection as a potential trigger of hypersensitivity reactions was evaluated using an established CARPA assay in a pig model. Pigs are highly sensitive toward injectable nanoformulations, with CARPA symptoms including rapid and massive hemodynamic changes, ie, rise in PAP and drop in SAP, rise of TXB2 levels in plasma in parallel to the PAP increase, and changes in blood cell counts, as well as skin rash and flushing.26 Our previous study showed that SPIONDex80 did not cause CARPA reactions in pigs.17 This time, the tests were repeated for SPIONDex30 with a hydrodynamic size of 30 nm. For this purpose, saline solution was first injected into the pigs via the left jugular vein as a negative control. After 10 minutes, particles were injected as a bolus at an iron concentration of 0.5 mg/kg, and if no reaction appeared for 30 minutes, the particle injection was repeated at a 10-fold concentration (5 mg/kg). If no reaction was observed 30 minutes later, zymosan was injected as positive control to confirm that the treated pigs were susceptible to CARPA. The relative mean values of the hemodynamic changes derived from two pigs are depicted in Figure 6B and the corresponding TXB2 plasma levels in Figure 6C. After the application of nanoparticles, no significant hemodynamic or blood cell count changes appeared and no skin rash or flushing was observed. In addition, the TXB2 plasma levels were not significantly altered. In contrast, the reaction to zymosan (positive control) was very strong. In both animals, zymosan evoked a severe PAP increase to 155%, as well as a short-lasting SAP and HR decrease to 90% and 94%, respectively. This pulmonary hypertension was strongly associated with the elevation in the TXB2 level from 1.1 to 3.8 ng/mL.
Discussion
The major challenge associated with the iron oxide-based contrast agents is their potential to induce hypersensitivity reactions or complement activation.27,28 Our previous study demonstrated that it is possible to design dextran-coated SPIONs that do not activate, complement, or trigger CARPA reactions in pigs, even at high concentrations.17 Within these studies, the feasibility of tuning the particle size by variation of iron and dextran concentration during the coprecipitation process was demonstrated. In the current study, the second part of the synthesis process, the cross-linking of the dextran shell, was investigated in detail using SPIONDex at different sizes (30, 50, and 80 nm). The cross-linking of the dextran shell is necessary for an increased particle stability, because the bonding between iron oxide and dextran based on hydrogen bonds is reversible.29 In the given concentration range of ECH and iron, there was only little effect on particles with a hydrodynamic size of 50 and 80 nm. Yet for 30 nm particles, particle sizes grew very fast at >3 mg Fe/mL and at higher ECH concentrations. At the highest concentration, they almost tripled their size, which indicates that the dextran coatings of multiple particles were cross-linked together. A possible explanation of this behavior of smallest particles is their higher surface-to-volume ratio and also their higher mobility, as compared to larger SPIONs. Thereby, the chances for hydroxyl groups of neighboring particles to come into close contact with each other, and to be linked by ECH, increase with rising concentrations during the cross-linking process. This is less likely to occur in bigger particles, which have smaller surface-to-volume ratio; hence, no dramatic increment in their size is observed. In these concentration-related investigations, the reaction time was set to 24 hours, as it was assumed that the cross-linking reaction is completed after this time. In order to prove that this is actually true, time-dependent measurements were performed for all particles at the concentrations of 3 mg Fe/mL and 12.5% ECH. During the first 6 hours of the reaction, a gradual hydrodynamic size increment was observed in all samples, which is indicative of dextran’s cross-linking. Theoretically, there is also a possibility that dextran from the supernatant can be bound to the particles and thereby contribute to this size increase. However, it has been reported that the attachment of unadsorbed dextran is low.30 Prolongation of the reaction time did not lead to further changes in hydrodynamic size, so it can be assumed that the cross-linking reaction was completed after 6 hours. This hypothesis was confirmed by time-dependent FTIR measurements. During the reaction, the peak distribution changed mainly in the range of 1,000–1,200 cm−1, due to the introduction of C-O-C groups during the cross-linking reaction. Different peak ratios of the FTIR spectra (1,000/1,100; 920/850; 1,345/1,450; 1,415/1,450; and 1,275/1,450) showed a decrease in the value within the first 6 hours of the reaction. Afterward, the signal remained constant. Taking all results of the cross-linking parametrization into account, an iron concentration of 3 mg/mL, an ECH concentration of 12.5 vol%, and a reaction time of 6 hours are sufficient to complete the cross-linking reaction in all investigated particle sizes, with no arbitrary size alterations.
In order to further examine the crystallinity of the formed inorganic phase, XRD patterns of the particles were acquired. In general, all spectra had the same peak distribution typical for the face-centered cubic spinel structure of magnetite (space group: Fdm). The missing peak at 33.2° corresponding to the (104) plane of hematite’s hexagonal corundum structure (space group: Rc) implied the absence of hematite impurities.31 In this regard, it is important to note that maghemite also crystallizes in a cubic spinel structure, but it possesses 2 1/3 vacancies confined to octahedral sites.32 As a consequence, peak positions only differ slightly from each other. This fact made it very difficult to discriminate whether magnetite, maghemite, or a mixture of both was created. The lattice parameters of the particles, which are 8.374±0.008, 8.364±0.009, and 8.395±0.003 Å for SPIONDex30, SPIONDex50, and SPIONDex80, respectively, are very close to the theoretical value of magnetite (a=8.396) and a bit further away from that of maghemite (a=8.347).32,33 It has been shown that the surface of magnetite nanoparticles is quickly oxidized upon their exposure to air.34 The slight deviations of the lattice parameters from the theoretical magnetite value observed in this study may thus be attributed to small alterations in stoichiometry resulting from partial oxidation. Taking this into account, it is likely that the fabricated SPIONDex were composed of magnetite, with a possible maghemite surface. Williamson–Hall plots showed a good linear correlation with a negative slope in all three samples. These negative slopes implied that microstrains were not the dominant factor for the peak broadening and that the crystallites were rather in a relaxed than a compacted state.35 The hydrodynamic size of the particles did not influence ζ potential as a function of pH and the IEP, nor the FTIR spectra (not shown), which indicates similar chemical surface properties, regardless of the particle size.
For their use as MRI contrast agents, the imaging properties of SPIONs are of great relevance. Measuring the T2/T2* relaxivity of every synthesized batch with an MRI device is not only time consuming but also very expensive. For this reason, one of the aims of the current study was to utilize the Koenig–Kellar model to estimate the relaxivity of the synthesized particles. This was achieved by determination of relaxivity as a function of susceptibility in five differently sized SPIONDex particles with different susceptibilities. As expected from the Koenig–Kellar model, the measurements revealed a good quadratic correlation between these two parameters in r2 and r2*. Correlation between relaxivity and susceptibility for r2* was better than that for r2, because the exposure of SPIONs to the magnetic field of an MRI tube leads to their magnetization and introduces field inhomogeneities. These inhomogeneities, which are taken into account in T2* time, accelerate the dephasing process of the proton spins, leading to higher relaxation rates. The actual relaxivity values ranged from 46.8 to 207.4 mM−1s−1 for r2 and from 105.8 to 319.2 mM−1s−1 for r2*. The T2 contrast agents previously used in clinical trials possess an r2 value of 98.3 (ferumoxide), 151 (ferucarbotran), and 60 mM−1s−1 (ferumoxtran).14,16 Compared to these contrast agents, SPIONDex have a higher relaxivity depending on the size and, therefore, better imaging qualities with lower required particle concentrations. These values can also compete with other polymer-coated SPIONs for MRI purposes, which are currently in development by other groups.36–38 Direct comparisons with Gd3+-based substances, which are currently the only approved and, at the same time, commercially available contrast agents, are difficult because of the different contrast mechanisms and appearances (T1 vs T2/T2* and bright vs dark contrast). Typical values for r1 and r2 of GBCAs are ~5 mM−1s−1.14 In terms of relaxivity, this means that the concentrations of GBCAs must be significantly higher in order to achieve the same contrast as SPIONDex. Given the potential toxicity concerns for gadolinium, this is a clear disadvantage of GBCAs. SPIONDex r1 values can also be calculated from the obtained data, but they are less meaningful, because the correlation in R1 was very poor. This was expected as T1 is not dependent on the magnetic susceptibility of the particles but on the interaction between unpaired electrons of the paramagnetic metal ion with protons from coordinated or diffusing water molecules. Nevertheless, our data showed that it is possible to estimate the MRI properties from the correlations for r2 and especially for r2* by simple, fast and cheap susceptibility measurements. This is an important quality control aspect for the transfer process toward upscaled and cGMP-compliant synthesis, as well as for the approximation of the imaging properties after handling and storage of the particles.
The latter aspect is crucial because nanoparticles, due to their high surface-to-volume ratio, have the potential to form clusters or agglomerate, as well as the tendency to sediment over time. Usually, a longer period of time between fabrication and application of the nanoparticles must be taken into account. Consequently, appropriate storage conditions have to be applied in order to achieve reproducible results during the respective applications. The influence of different storage conditions on the synthesized SPIONDex was assessed by storing 30, 50, and 80 nm particles for 12 weeks at three different temperatures, namely, 4, 20, or 37°C. Regardless of SPION size, the time-dependent color change and the corresponding drop in UV/Vis adsorption indicated the transformation from magnetite to maghemite, which is characterized by reddish-brown color. The XRD spectra showed that no significant differences concerning peak positions and ratios were detectable compared to the freshly prepared sample and that the color change could not be attributed to the formation of hematite. However, the calculation of the lattice constant resulted in 8.346±0.006 Å, which coincides with the lattice parameter of maghemite (8.347 Å).32 Crystallite size and strain, as determined by the Williamson–Hall plot, were not altered during the storage at 37°C. Another parameter indicating that the oxidation to maghemite occurred over the storage time was the time- and temperature-dependent change in the particles’ susceptibility. While the susceptibility stayed almost constant at 4°C, it decreased slowly over time at 20°C and was rapidly reduced at 37°C. Since the corresponding hydrodynamic sizes of the particles remained more or less unchanged, this decrease in susceptibility could only be attributed to the oxidation of iron oxide cores. Nevertheless, there have been studies showing that the oxidation of magnetite to maghemite can improve the biocompatibility of the particle system.31,32 It is noteworthy that there were no signs of agglomeration or sedimentation during the examined time frame at any conditions. AES measurements of the SPIONs’ supernatants did not show detectable release of iron into the solution even after 12 weeks at 37°C (data not shown). This is in accordance with the osmolarity of the particle suspensions, which was also not affected by storage (data not shown). Although iron oxide nanoparticles in general are prone to Ostwald ripening, coatings of organic molecules can passivate the particle surface and prevent iron ion release.39 Our data indicate the successful passivation of the iron oxide surface by the applied dextran coating. In addition, FTIR- and pH-dependent ζ potential measurements did not show a time- or temperature-dependent change in the signal. Judging from these findings, it can be assumed that the dextran coating was not influenced within the examined storage time frame even at 37°C and regardless of the particle size. Upon storage at 4°C, no significant changes in the particle properties were observed. Higher storage temperatures caused a reduction in susceptibility and, consequently, a potential decrease in relaxivity. With the previously obtained correlation, it can be estimated that the relaxivity of the particles would be reduced to ~70% of its original value upon storage at elevated temperatures for a longer period of time. In general, knowledge about temperature-related processes during mid- and long-term storage of iron oxide nanoparticles is scarce. As an example, Zaloga et al40 demonstrated that the storage of bovine serum albumin (BSA)-coated SPIONs also resulted in a time- and temperature-related oxidation of the particles, in parallel with a decrease in magnetic properties. The hydrodynamic sizes stayed constant, although the protein coating was exposed to 45°C. Oberle and Lüdtke-Buzug41 examined the storage stability of dextran-coated particles over 6 weeks at different temperatures. Unlike in our study, a significant increase in size and sedimentation were observed over time. Despite the fact that dextran was used as a coating material in these particles, their stability was much inferior to SPIONDex. This difference can be explained by the lack of a dextran cross-linking procedure in their particles. In contrast, the cross-linked dextran surface of SPIONDex ensures their very good stability for several months.
Concerning safety, the CAM assay demonstrated that, independent of their size, SPIONDex lack the irritation potential and exert no negative effects on vessels in vivo. As previously demonstrated for 80 nm particles,17 our present data showed that SPIONDex30 with a hydrodynamic size of 30 nm also did not cause CARPA reactions in pigs. This is a very remarkable finding, because SPIONs have been reported to induce hypersensitivity reactions triggered by the lectin or classical pathway.27,28,42 A tragic example for SPION-induced hypersensitivity reactions is ferumoxytol, which caused some cases of fatal anaphylactic reactions and received the strongest type of warning from the US Food and Drug Administration (FDA) in 2015.43 Other iron oxide-based contrast agents approved for MRI applications (eg, ferumoxide) have also been reported to induce hypersensitivity-like adverse effects,16 albeit milder than ferumoxytol. The molecular origin of these reactions is not fully understood. A possible explanation may be that the iron oxide cores of these particles were not fully coated by the polymer, due to short chain lengths and lack of polymer cross-linking, as shown by Jung44 for ferumoxtran and ferumoxide. These findings were supported by a study of Simberg et al45 who demonstrated the interactions of ferumoxide iron oxide core with histidine-rich glycoproteins and kininogens that led to the subsequent binding of the complement lectin and contact clotting factors. It has also been reported that the anionic charge pattern of the iron oxide core can be recognized by scavenging receptors.46 As a consequence, it seems that the exposure of the iron oxide core must be prevented in order to reduce the risk for CARPA. Recently, Wibroe et al47 demonstrated that spherical-shaped polystyrene particles possess a higher risk for adverse reactions compared to their rod- or disk-shaped counterparts. We previously demonstrated with transmission electron microscopy images that SPIONDex possess a branched chain like morphology.17 Taking this into account, our particles were not spherical but rather elongated particles, which might also contribute to their lack of complement activation. Another factor to be considered is the polymer itself. Although dextran is approved as plasma expander, chain lengths of 40 and 70 kDa also caused anaphylactoid reactions in some rare cases.48,49 Therefore, the cross-linking process is a vital step in the particle synthesis for not only stability reasons but also alteration of the sugar structure. In fact, it has been demonstrated that cross-linking of dextran prevented the complement activation in mice.50 This finding clearly shows the fact that the surface of nanoparticles is a key feature for biomedical applications, representing the first-contact surface for the blood cells and proteins. Both these potential reasons for CARPA-inducing effect of existing contrast agents were taken into account when designing SPIONDex particles. Blocking the sterical access to the iron oxide core and alteration of the sugar structure were achieved with a longer dextran chain (40 kDa instead of 10 kDa) and by cross-linking of the polymer. Consequently, SPIONDex did not induce complement activation or CARPA reactions in vivo. This result, setting it apart from the existing SPION-based contrast agents, makes SPIONDex a very promising candidate as a safe contrast agent.
Acknowledgments
This work was supported by the EU project NanoAthero (FP7-NMP-2012-LARGE-6-309820), the Deutsche Forschungsgemeinschaft (German Research Foundation; CI 162/2-1, CI 162/2-3, and AL552/8-1), FUMIN Bridge Funding appropriations, and the Bavarian State Ministry of the Environment and Consumer Protection. We acknowledge support by Deutsche Forschungsgemeinschaft and Friedrich-Alexander-Universität Erlangen-Nürnberg (FAU) within the funding program Open Access Publishing.
Disclosure
László Dézsi and János Szebeni are employed by SeroScience Ltd., Budapest, Hungary. The authors report no other conflicts of interest in this work.
References
Jackson SA, Thomas RM, Harrison SN. Cross-Sectional Imaging Made Easy. 2nd ed. London: Churchill Livingstone; 2004. | ||
Shokrollahi H. Contrast agents for MRI. Mater Sci Eng C Mater Biol Appl. 2013;33(8):4485–4497. | ||
Rogosnitzky M, Branch S. Gadolinium-based contrast agent toxicity: a review of known and proposed mechanisms. Biometals. 2016;29(3):365–376. | ||
Khawaja AZ, Cassidy DB, Al Shakarchi J, McGrogan DG, Inston NG, Jones RG. Revisiting the risks of MRI with gadolinium based contrast agents – review of literature and guidelines. Insights Imaging. 2015;6(5):553–558. | ||
Barbieri S, Schroeder C, Froehlich JM, Pasch A, Thoeny HC. High signal intensity in dentate nucleus and globus pallidus on unenhanced t1-weighted MR images in three patients with impaired renal function and vascular calcification. Contrast Media Mol Imaging. 2016;11(3):245–250. | ||
Errante Y, Cirimele V, Mallio CA, Di Lazzaro V, Zobel BB, Quattrocchi CC. Progressive increase of t1 signal intensity of the dentate nucleus on unenhanced magnetic resonance images is associated with cumulative doses of intravenously administered gadodiamide in patients with normal renal function, suggesting dechelation. Invest Radiol. 2014;49(10):685–690. | ||
Kanda T, Ishii K, Kawaguchi H, Kitajima K, Takenaka D. High signal intensity in the dentate nucleus and globus pallidus on unenhanced t1-weighted MR images: relationship with increasing cumulative dose of a gadolinium-based contrast material. Radiology. 2014;270(3):834–841. | ||
European Medicines Agency – Science Medicines Health. EMA/157486/2017. PRAC concludes assessment of gadolinium agents used in body scans and recommends regulatory actions, including suspension for some marketing authorisations. Available from: http://www.ema.europa.eu/docs/en_GB/document_library/Press_release/2017/03/WC500223209.pdf. Accessed February 5, 2018. | ||
Roduner E. Size matters: why nanomaterials are different. Chem Soc Rev. 2006;35(7):583–592. | ||
Richards JM, Shaw CA, Lang NN, et al. In vivo mononuclear cell tracking using superparamagnetic particles of iron oxide: feasibility and safety in humans. Circ Cardiovasc Imaging. 2012;5(4):509–517. | ||
Liu W, Frank JA. Detection and quantification of magnetically labeled cells by cellular MRI. Eur J Radiol. 2009;70(2):258–264. | ||
Diwoky C, Liebmann D, Neumayer B, et al. Positive contrast of spio-labeled cells by off-resonant reconstruction of 3d radial half-echo bssfp. NMR Biomed. 2015;28(1):79–88. | ||
Harisinghani MG, Barentsz J, Hahn PF, et al. Noninvasive detection of clinically occult lymph-node metastases in prostate cancer. N Engl J Med. 2003;348(25):2491–2499. | ||
Wang YX, Hussain SM, Krestin GP. Superparamagnetic iron oxide contrast agents: physicochemical characteristics and applications in MR imaging. Eur Radiol. 2001;11(11):2319–2331. | ||
Chavhan GB, Babyn PS, Thomas B, Shroff MM, Haacke EM. Principles, techniques, and applications of t2*-based MR imaging and its special applications. Radiographics. 2009;29(5):1433–1449. | ||
Wang YX. Superparamagnetic iron oxide based MRI contrast agents: current status of clinical application. Quant Imaging Med Surg. 2011;1(1):35–40. | ||
Unterweger H, Janko C, Schwarz M, et al. Non-immunogenic dextran-coated superparamagnetic iron oxide nanoparticles: a biocompatible, size-tunable contrast agent for magnetic resonance imaging. Int J Nanomedicine. 2017;12:5223–5238. | ||
Cullity BDSSR. Elements of X-Ray Diffraction. Upper Saddle River, NJ: Prentice Hall; 2001. | ||
Mittemeijer EJ, Welzel U. The “state of the art” of the diffraction analysis of crystallite size and lattice strain. Z Kristallogr. 2008;223(9):552–560. | ||
Frullano L, Meade TJ. Multimodal MRI contrast agents. J Biol Inorg Chem. 2007;12(7):939–949. | ||
Cicha I, Beronov K, Ramirez EL, et al. Shear stress preconditioning modulates endothelial susceptibility to circulating TNF-alpha and monocytic cell recruitment in a simplified model of arterial bifurcations. Atherosclerosis. 2009;207(1):93–102. | ||
Luepke NP. Hen’s egg chorioallantoic membrane test for irritation potential. Food Chem Toxicol. 1985;23(2):287–291. | ||
Szebeni J, Bedocs P, Csukas D, Rosivall L, Bunger R, Urbanics R. A porcine model of complement-mediated infusion reactions to drug carrier nanosystems and other medicines. Adv Drug Deliv Rev. 2012;64(15):1706–1716. | ||
Swanson HE, McMurdie HF, Morris MC, Evans EH. Powder Patterns Section 5. Standard X-Ray Diffraction Patterns. Washington: US Department of Commerce – National Bureau of Standards; 1967. | ||
Perfetti G, Aubert T, Wildeboer WJ, Meesters GMH. Influence of handling and storage conditions on morphological and mechanical properties of polymer-coated particles: characterization and modeling. Powder Technol. 2011;206(1–2):99–111. | ||
Szebeni J. Complement activation-related pseudoallergy: a stress reaction in blood triggered by nanomedicines and biologicals. Mol Immunol. 2014;61(2):163–173. | ||
Szebeni J, Fishbane S, Hedenus M, et al. Hypersensitivity to intravenous iron: classification, terminology, mechanisms and management. Br J Pharmacol. 2015;172(21):5025–5036. | ||
Banda NK, Mehta G, Chao Y, et al. Mechanisms of complement activation by dextran-coated superparamagnetic iron oxide (spio) nanoworms in mouse versus human serum. Part Fibre Toxicol. 2014;11(64):1–10. | ||
Carmen Bautista M, Bomati-Miguel O, del Puerto Morales M, Serna CJ, Veintemillas-Verdaguer S. Surface characterisation of dextran-coated iron oxide nanoparticles prepared by laser pyrolysis and coprecipitation. J Magn Magn Mater. 2005;293(1):20–27. | ||
Lin MM, Li S, Kim H-H, et al. Complete separation of magnetic nanoparticles via chemical cleavage of dextran by ethylenediamine for intracellular uptake. J Mater Chem. 2010;20(3):444–447. | ||
Morris MC, McMurdie HF, Evans EH, Paretzkin B, Parker HS, Panagiotopoulos NC. Powder Patterns Section 18. Standard X-Ray Diffraction Patterns. Washington: US Department of Commerce – National Bureau of Standards; 1981. | ||
Cornell RM, Schwertmann U. Crystal Structure. The Iron Oxides. Weinheim: Wiley-VCH Verlag, GmbH & Co. KGaA; 2004:9–38. | ||
Mohapatra S, Pramanik N, Ghosh SK, Pramanik P. Synthesis and characterization of ultrafine poly(vinylalcohol phosphate) coated magnetite nanoparticles. J Nanosci Nanotechnol. 2006;6(3):823–829. | ||
Santoyo Salazar J, Perez L, de Abril O, et al. Magnetic iron oxide nanoparticles in 10–40 nm range: composition in terms of magnetite/maghemite ratio and effect on the magnetic properties. Chem Mater. 2011;23(6):1379–1386. | ||
Langford JI, Cernik RJ, Louer D. The breadth and shape of instrumental line profiles in high-resolution powder diffraction. J Appl Crystallogr. 1991;24(5):913–919. | ||
Lassenberger A, Scheberl A, Stadlbauer A, Stiglbauer A, Helbich T, Reimhult E. Individually stabilized, superparamagnetic nanoparticles with controlled shell and size leading to exceptional stealth properties and high relaxivities. ACS Appl Mater Interfaces. 2017;9(4):3343–3353. | ||
Vismara E, Bongio C, Coletti A, et al. Albumin and hyaluronic acid-coated superparamagnetic iron oxide nanoparticles loaded with paclitaxel for biomedical applications. Molecules. 2017;22(7):E1030. | ||
Khalkhali M, Sadighian S, Rostamizadeh K, et al. Synthesis and characterization of dextran coated magnetite nanoparticles for diagnostics and therapy. Bioimpacts. 2015;5(3):141–150. | ||
Tóth IY, Illés E, Bauer RA, et al. Designed polyelectrolyte shell on magnetite nanocore for dilution-resistant biocompatible magnetic fluids. Langmuir. 2012;28(48):16638–16646. | ||
Zaloga J, Janko C, Agarwal R, et al. Different storage conditions influence biocompatibility and physicochemical properties of iron oxide nanoparticles. Int J Mol Sci. 2015;16(5):9368–9384. | ||
Oberle A, Lüdtke-Buzug K. Stability analysis of superparamagnetic iron oxide nanoparticles at 37°C. Biomed Tech (Berl). 2013;8:1–2. | ||
Wang G, Chen F, Banda NK, et al. Activation of human complement system by dextran-coated iron oxide nanoparticles is not affected by dextran/fe ratio, hydroxyl modifications, and crosslinking. Front Immunol. 2016;7:418. | ||
Smits LP, Coolen BF, Panno MD, et al. Noninvasive differentiation between hepatic steatosis and steatohepatitis with MR imaging enhanced with uspios in patients with nonalcoholic fatty liver disease: a proof-of-concept study. Radiology. 2016;278(3):782–791. | ||
Jung CW. Surface properties of superparamagnetic iron oxide MR contrast agents: ferumoxides, ferumoxtran, ferumoxsil. Magn Reson Imaging. 1995;13(5):675–691. | ||
Simberg D, Park JH, Karmali PP, et al. Differential proteomics analysis of the surface heterogeneity of dextran iron oxide nanoparticles and the implications for their in vivo clearance. Biomaterials. 2009;30(23–24):3926–3933. | ||
Chao Y, Makale M, Karmali PP, et al. Recognition of dextran-superparamagnetic iron oxide nanoparticle conjugates (feridex) via macrophage scavenger receptor charged domains. Bioconjug Chem. 2012;23(5):1003–1009. | ||
Wibroe PP, Anselmo AC, Nilsson PH, et al. Bypassing adverse injection reactions to nanoparticles through shape modification and attachment to erythrocytes. Nat Nanotechnol. 2017;12(6):589–594. | ||
Levy JH. Anaphylactic Reactions in Anesthesia and Intensive Care. Oxford: Elsevier Science; 2013. | ||
Videm V, Mollnes TE. Human complement activation by polygeline and dextran 70. Scand J Immunol. 1994;39(3):314–320. | ||
Wang G, Inturi S, Serkova NJ, et al. High-relaxivity superparamagnetic iron oxide nanoworms with decreased immune recognition and long-circulating properties. ACS Nano. 2014;8(12):12437–12449. |
Supplementary material
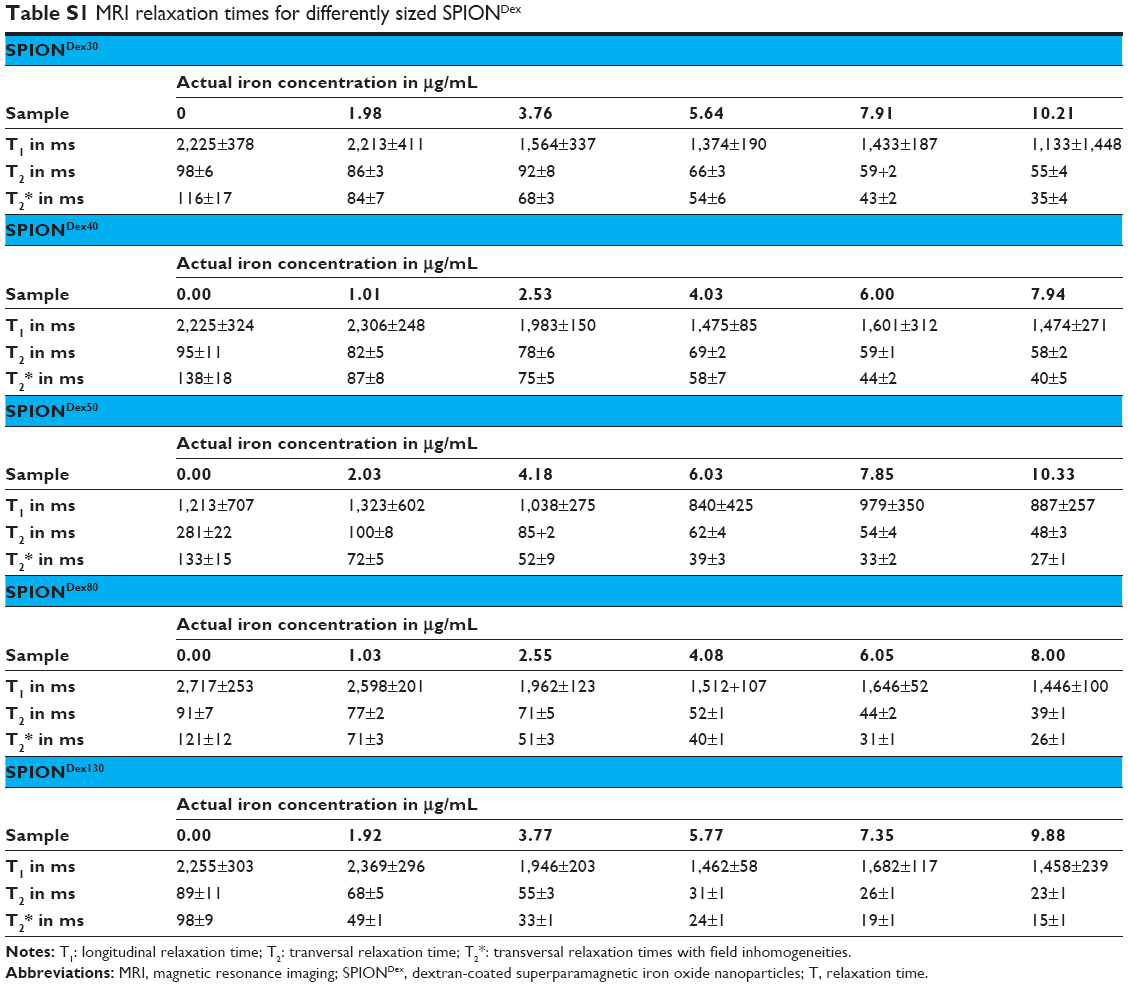 | Table S1 MRI relaxation times for differently sized SPIONDex |
 © 2018 The Author(s). This work is published and licensed by Dove Medical Press Limited. The
full terms of this license are available at https://www.dovepress.com/terms
and incorporate the Creative Commons Attribution
- Non Commercial (unported, 3.0) License.
By accessing the work you hereby accept the Terms. Non-commercial uses of the work are permitted
without any further permission from Dove Medical Press Limited, provided the work is properly
attributed. For permission for commercial use of this work, please see paragraphs 4.2 and 5 of our Terms.
© 2018 The Author(s). This work is published and licensed by Dove Medical Press Limited. The
full terms of this license are available at https://www.dovepress.com/terms
and incorporate the Creative Commons Attribution
- Non Commercial (unported, 3.0) License.
By accessing the work you hereby accept the Terms. Non-commercial uses of the work are permitted
without any further permission from Dove Medical Press Limited, provided the work is properly
attributed. For permission for commercial use of this work, please see paragraphs 4.2 and 5 of our Terms.