Back to Journals » Clinical Interventions in Aging » Volume 13
Determining functional activity profiles in patients with upper extremity disorders: is there effect modification by hand grip strength?
Authors Kim MJ, Park KS ![]() , Seo AR, Lee SI, Ha YC, Yoo JI
, Seo AR, Lee SI, Ha YC, Yoo JI ![]()
Received 10 September 2018
Accepted for publication 24 October 2018
Published 15 November 2018 Volume 2018:13 Pages 2351—2358
DOI https://doi.org/10.2147/CIA.S187066
Checked for plagiarism Yes
Review by Single anonymous peer review
Peer reviewer comments 2
Editor who approved publication: Dr Richard Walker
Mi-Ji Kim,1–3 Ki Soo Park,1–3 Ae-Rim Seo,1,2 Sang-Il Lee,4 Yong-Chan Ha,5 Jun-Il Yoo2,3,6
1Department of Preventive Medicine, Gyeongsang National University College of Medicine, Jinju, Republic of Korea; 2Institute of Health Sciences, Gyeongsang National University College of Medicine, Jinju, Republic of Korea; 3Center for Farmer’s Safety and Health, Gyeongsang National University Hospital, Jinju, Republic of Korea; 4Department of Internal Medicine, Institute of Health Sciences, Gyeongsang National University School of Medicine, Gyeongsang National University Hospital, Jinju, Republic of Korea; 5Department of Orthopedic Surgery, Chung-Ang University Hospital, Seoul, Republic of Korea; 6Department of Orthopedic Surgery, Gyeongsang National University Hospital, Jinju, Republic of Korea
Purpose: The purposes of this study were to investigate the effect of hand-grip strength (HGS) on the Disabilities of the Arm, Shoulder, and Hand (DASH) score in women with upper extremity musculoskeletal disorders (UEMDs) living in rural communities and examine whether upper extremity diseases affected upper extremity functional activity in each group (normal/low HGS) and whether grip strength (GS) was an effect modifier in upper extremity functional activity.
Methods: A total of 239 women older than 60 years who had completed a medical workup for epicondylitis, rotator cuff tears, and/or hand osteoarthritis were included in the final study. Functional activity was assessed by DASH, and muscle strength was measured by GS. Low HGS was defined according to the Asian Working Group for Sarcopenia (HGS <18 kg in women). Pearson correlation analysis was performed to evaluate the relationship between HGS and the DASH score. A multiple regression analysis was performed after defining DASH as a dependent variable and dividing subjects into two groups (low HGS and normal HGS). Statistical analyses were performed using SPSS Statistics V.24.
Results: HGS in the participants correlated with the DASH score (r=-0.320, P<0.001). In the low HGS group, waist circumference (B=-0.526, P=0.010) and the DASH score were significantly correlated. In addition, DASH scores were statistically significantly increased as the number of upper extremity diseases increased to 2 (B=11.592, P=0.016) and 3 (B=15.716, P=0.001). The DASH score in the normal HGS group was correlated with the Patient Health Questionnaire-2 score (β=2.680, P<0.001) after adjusting covariates.
Conclusion: We found that HGS in UEMD patients affected health-related quality of life as measured by the DASH. Maintaining hand muscle strength may improve patient functional activity in age-related UEMDs.
Keywords: hand-grip strength, quality of life, aging, rural, upper extremity musculoskeletal disorders, functional activity
Introduction
Musculoskeletal disorders are among the most frequently occurring chronic conditions in the general population, having substantial impact on physical activity, mental state, and health-related quality of life (HRQoL).1,2 The prevalence of musculoskeletal disorders increases with age, and they are a leading cause of disability among those older than 60 years.3 Several studies have reported that upper extremity musculoskeletal disorders (UEMDs) reduce activities of daily living, which causes reduced HRQoL in the elderly.4,5
As the elderly population grows, there is mounting interest in healthy aging.6 In addition, as the role of muscle function in the health of elderly populations becomes clearer, interest in sarcopenia is increasing.7 One of the most important evaluation instruments in the diagnosis of sarcopenia is the measurement of muscle strength using hand-grip strength (HGS).8 Several studies have shown that measurement of HGS is a simple, noninvasive test that reflects the function of all skeletal muscles in the body.8,9
Preservation of muscle strength in musculoskeletal disorders is well known to relieve patient disability and pain.10
It is already known that anatomical muscle injuries such as rotator cuff tear (RCT), as well as joint pathology and inflammation of the upper limb, influence scores on the Disabilities of the Arm, Shoulder, and Hand (DASH) instrument.11 However, since the importance of sarcopenia and muscle strength is increasingly recognized, studies are needed to quantify and demonstrate the value of maintenance and promotion of upper extremity muscle function.
A prior cross-sectional study with a total of 2,987 community-dwelling men and women aged 59–73 years from the Hertfordshire Cohort Study found that lower HGS was associated with reduced HRQoL in older men and women. This suggested that individuals with sarcopenia may benefit from interventions to improve muscle mass and strength before the onset of chronic disorders usually associated with poor HRQOL.12 Izawa et al13 examined the relationship between the physiological outcome of muscle strength and the DASH score in 50 consecutive cardiac patients who were undergoing cardiac surgery. They found that the DASH score negatively correlated with HGS and knee extensor muscle strength. However, there have been no studies on whether upper extremity diseases affect health outcomes (eg, functional activity) in each group (normal/low HGS) and whether grip strength (GS) is an effect modifier in upper extremity functional activity.
Therefore, the purposes of this study were to investigate the effect of HGS on the DASH score in women with UEMDs living in rural communities and examine whether upper extremity diseases affected upper extremity functional activity in each group (normal/low HGS) and whether GS was an effect modifier in upper extremity functional activity.
Methods
Participants
This cross-sectional study used data from the Namgaram cohort study. The Namgaram cohort study enrolled people living in six rural communities for research on musculoskeletal disorders. The participants were residents of these communities who were aged 40 years or older without stroke, cancer, or history of musculoskeletal surgery, and all agreed to participate in this cohort study from June 2013 to December 2015. The participants in the Namgaram cohort study answered questionnaires and underwent physical examinations, blood tests, plain radiographs, and magnetic resonance imaging (MRI). This study used data collected from these examinations.
In the Namgaram data, the study was limited to the following subjects: 1) women older than 60 years; 2) those who completed the DASH; 3) those with at least one upper extremity disease such as epicondylitis, RCT, and hand osteoarthritis (HOA); and 4) those who did not use medication related to UEMDs. We excluded participants who were unable to complete the questionnaire independently due to conditions such as severe cognitive impairment. In all, 239 women older than 60 years were included in the final study.
All participants were required to provide written informed consent. The study was approved by the Institutional Review Board of Gyeongsang National University Hospital (GNUH 2015-02-001) in accordance with the guidelines described in the Declaration of Helsinki involving humans.
Health examination survey
We included information on sociodemographic variables. This demographic information included sex, age, marital status (dichotomized as married “yes” or “no”), and educational attainment (categorized as “less than elementary school,” “middle school,” and “more than high school”). The dominant side was recorded as right, left, or ambidextrous.
Hypertension, diabetes mellitus, waist circumference (WC), depression, and laboratory testing were included. The presence of comorbidities was evaluated through history, measurement of blood pressure (BP), and laboratory testing. We classified a patient as having hypertension according to medical history and/or the detection of systolic BP >140 mmHg or diastolic BP >90 mmHg. BP was measured twice in a seated position after ≥5 minutes of rest using an automatic electronic sphygmomanometer (HBP-1300; Omron Healthcare®, Kyoto, Japan).14 We accepted prior diagnoses of diabetes; we also classified subjects with diabetes upon confirming serum levels of hemoglobin A1c (HbA1c) higher than 6.5%.15 WC was measured horizontally at the midpoint between the lowest border of the rib cage and the iliac crest at the end of a normal expiration, while participants were in a standing position with the feet 25–30 cm apart.16 WC was measured using a measuring tape. Depressive symptomatology was measured using the Patient Health Questionnaire-2 (PHQ-2). The PHQ-2 is a two-item questionnaire measured using a 4-point scale (0=not at all to 3=early every day).17 Higher scores indicate greater depression. The laboratory tests included hemoglobin, total cholesterol, C-reactive protein (CRP), HbA1c, and free thyroxine (T4) levels.
Measurement of HGS
Since the measurement of HGS is one of the most commonly used methods for the diagnosis of sarcopenia, we defined the presence of sarcopenia based on the HGS values.8 HGS was measured using a digital hand dynamometer (digital GS dynamometer, T.K.K 5401; Takei Scientific Instruments Co. Ltd., Tokyo, Japan). The measurement of HGS was performed in a standing position with the forearm away from the body and the hand held at the thigh level. Participants were asked to apply maximum grip strength (GS) three times with the left and right hands. Between each measurement, at least 30 seconds of resting interval was allowed. HGS was defined as the maximally measured GS of the dominant hand. Low HGS was defined according to the criteria set by the Asia Working Group for Sarcopenia (HGS <18 kg in women).18
Identification of UEMDs
The patients were diagnosed based on the judgment of an orthopedic surgeon with 10 years of experience in a tertiary university hospital. Patients were classified as having UEMDs when the orthopedic surgeon identified any disorder of the shoulder, hand, or wrist based on physical examination and/or radiologic findings.
RCT included partial and full-thickness tears. RCT was diagnosed with MRI. A 3.0-Tesla magnetic resonance (MR) unit (Ingenia; Philips Medical Systems®, Eindhoven, the Netherlands) was used to obtain MR images, which included axial, sagittal, and coronal T2-weighted images (repetition time/echo time [TR/TE]=2,800/60), coronal T1-weighted images (TR/TE=500/20), and coronal fat-saturated fast spin-echo images. The slice thickness was 3 mm without gaps. On MRI, partial-thickness RCT was diagnosed when a focus of high signal intensity was apparent on T2-weighted images in either the bursal or joint surface of the tendon that did not involve the entire thickness of the cuff, and full-thickness RCT was diagnosed when focal or diffuse high signal intensity on T2-weighted images extended from the bursal to the joint surface of the tendon or when the tendinous portion of the cuff was not visualized.19
Epicondylitis included lateral and medial epicondylitis. Epicondylitis was defined as self-reported pain at either epicondyle on 2 or more days in the previous month and at least one of the following on examination: presence of pain at the lateral epicondyle with resisted active wrist extension, pain at the medial epicondyle with resisted active wrist flexion, or tenderness to palpation over the medial and/or lateral epicondyle.20
For diagnosis of HOA, anteroposterior plain radiographs of both hands were obtained from all participants. The second to fifth distal interphalangeal, proximal interphalangeal, first to fifth metacarpophalangeal, thumb interphalangeal, and first carpometacarpal joints for each hand were graded for OA using the modified Kellgren–Lawrence (KL) scale to assess the existence and severity of osteophytes (OPs), joint space narrowing (JSN), sclerosis, and erosion. The modified KL scale was graded from 0 to 4, with 0 being no OA; 1 being questionable OPs and/or JSN; 2 being definite small OPs and/or mild JSN; 3 being moderate OPs and/or moderate JSN, sclerosis, and possible presence of erosion; and 4 being large OPs and/or severe JSN, sclerosis, and possible presence of erosions.21 Radiological HOA was defined when the result of plain radiography was determined to be higher than KL grade 2 in at least one joint.22
Radiographic interpretation was performed by a musculoskeletal radiologist with 20 years of experience and an orthopedic surgeon with 10 years of experience in a tertiary university hospital. Both readers were blinded to patient histories.
DASH questionnaire
The functional activity of the upper extremity was assessed using the DASH questionnaire. The DASH is a self-administered, upper extremity-specific questionnaire consisting of 30 questions: 21 on physical function, five on symptoms, and four on social-role functions. Each question has five response choices that range from 1 (without difficulty or symptom absent) to 5 (unable to engage in activity or very severe symptom). The DASH provides a best possible score of 0 and a worst possible score of 100. It is user-friendly, reliable, and validated for a range of upper extremity disorders.23
Statistical analyses
To compare mean values and proportions between groups, Student’s t-tests and chi-squared (χ2) tests were performed. Pearson correlation analysis was performed to evaluate the relationship between HGS and the DASH score. A multiple regression analysis was performed after defining DASH as a dependent variable and dividing subjects into two groups (low HGS and normal HGS); multiple regression analysis was performed, and 95% CI was calculated for the association between variables including UEMDs and the DASH score. All statistical tests were two tailed. Statistical significance was defined at P<0.05. Statistical analyses were performed using SPSS Statistics V.24 (IBM Corporation, Armonk, NY, USA).
Results
Baseline characteristics of study subjects
The mean age of the subjects was 65.8±4.67 years (range, 60–79 years), and all were women. The majority (74.5%) lived with a partner. The most common education level (60.3%) was less than or equal to graduation from elementary school. The mean PHQ-2 score of the participants was 1.5±1.39 (range, 0–6). The dominant HGS was 18.5±6.77 kg (range, 2.0–40.0 kg), and 42.3% of the participants belonged to the low-HGS group. The prevalence of hypertension and diabetes mellitus in the study group was 40.2% and 11.7%, respectively. In the study population, 33.4% of participants had one UEMD, 32.6% of participants had two UEMDs, and 33.9% had all three UEMDs (Table 1).
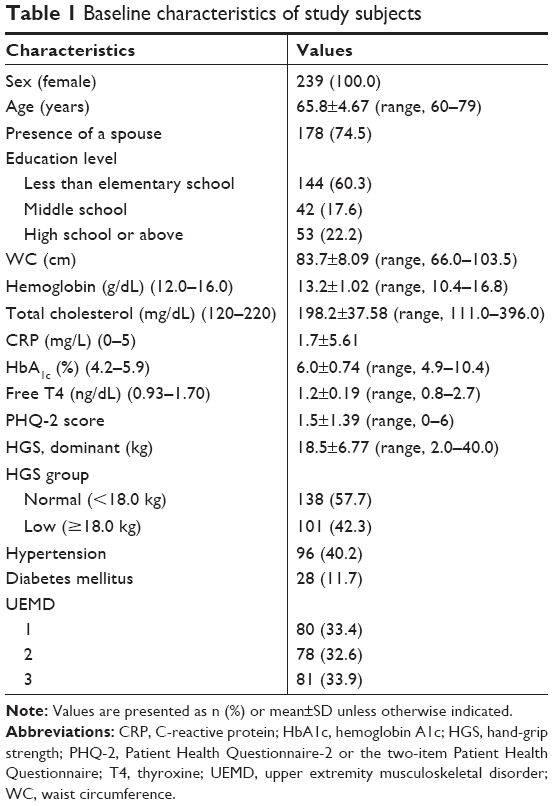 | Table 1 Baseline characteristics of study subjects |
Association between HGS and the DASH score in participants
HGS in participants correlated with the DASH score, having a correlation coefficient of −0.320 (P<0.001), adjusted for sociodemographic (age, presence of a spouse, and education level) and health-related characteristics (WC, hypertension, diabetes mellitus, hemoglobin, total cholesterol, CRP, HbA1c, free T4, and depression measured by the PHQ-2; Figure 1).
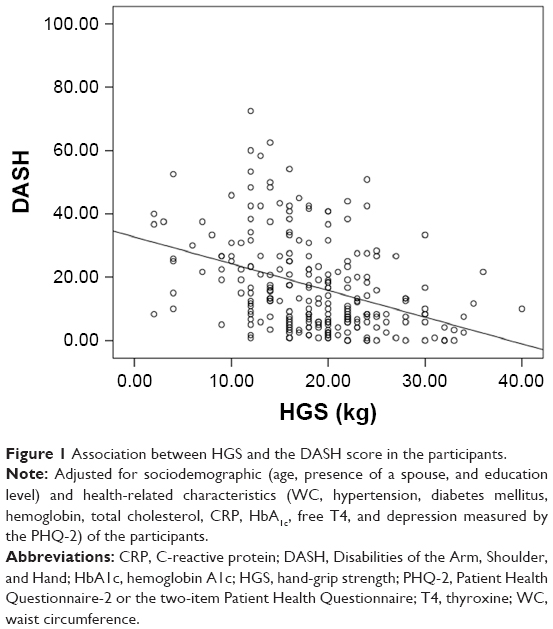 | Figure 1 Association between HGS and the DASH score in the participants. |
Comparison of the DASH score between the low- and normal-HGS groups
The mean±SD of the DASH score in the normal-HGS group was 12.2±11.25, whereas that in the low-HGS group was 23.8±16.17, with the difference being statistically significant (P<0.001). After adjusting for sociodemographic and health-related characteristics, the DASH score remained statistically significantly different (12.2±4.84 in the normal-HGS group vs 23.8±4.72 in the low-HGS group, P<0.001; Figure 2).
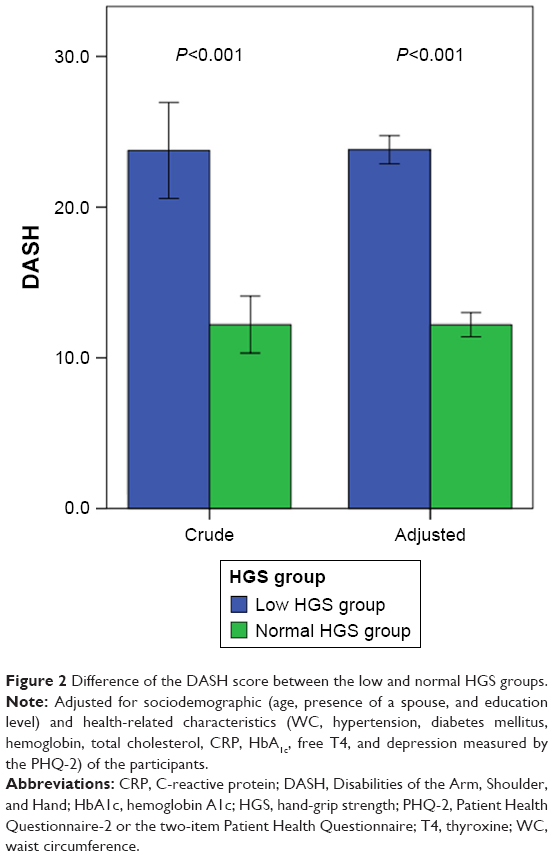 | Figure 2 Difference of the DASH score between the low and normal HGS groups. |
Regression analysis for the DASH
After adjusting for age, presence of spouse, education, WC, hypertension, diabetes mellitus, hemoglobin, total cholesterol, CRP, HbA1c, free T4, and depression, the DASH total score remained significantly correlated with WC (B=−0.230, P=0.039) and the PHQ-2 score (B=2.363, P<0.001). Additionally, the DASH total score was significantly positively correlated with three UEMDs (B=6.799, P=0.004) and negatively correlated with normal HGS (B=−7.552, P<0.001; Table 2).
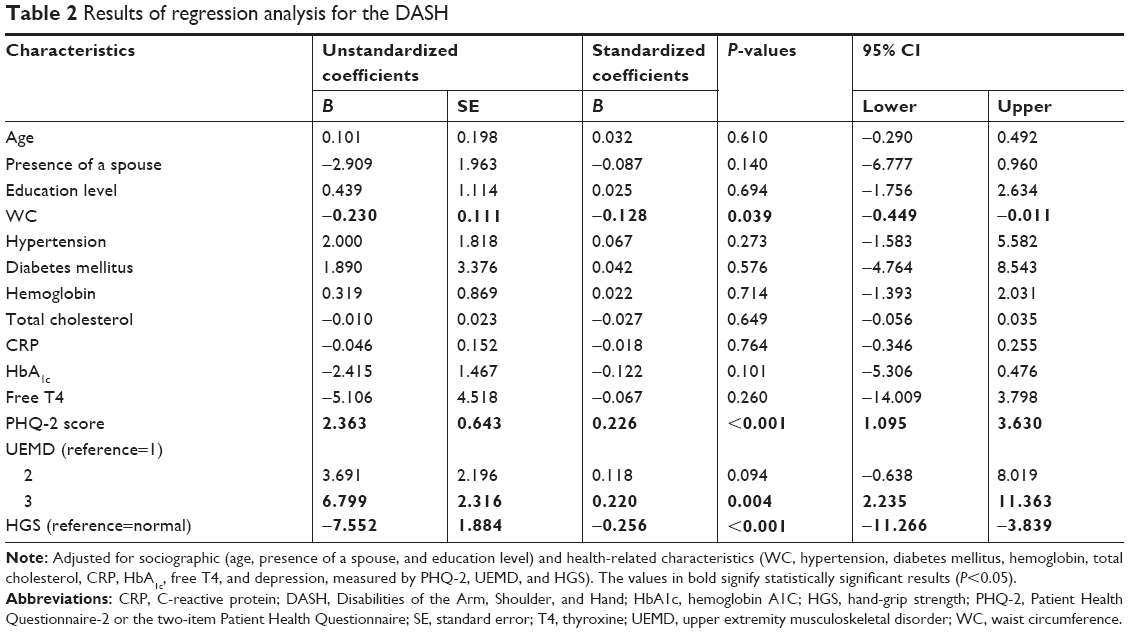 | Table 2 Results of regression analysis for the DASH |
Regression analysis for DASH in the low-HGS group
When adjusted for age, presence of spouse, education level, WC, hypertension, diabetes mellitus, hemoglobin, total cholesterol, CRP, HbA1c, free T4, UEMD, and depression measured by the PHQ-2, the DASH score in the low-HGS group was negatively correlated with WC (B=−0.526, P=0.010) and positively correlated with two or three UEMDs (B=11.592, P=0.016, B=15.716, P=0.001; Table 3).
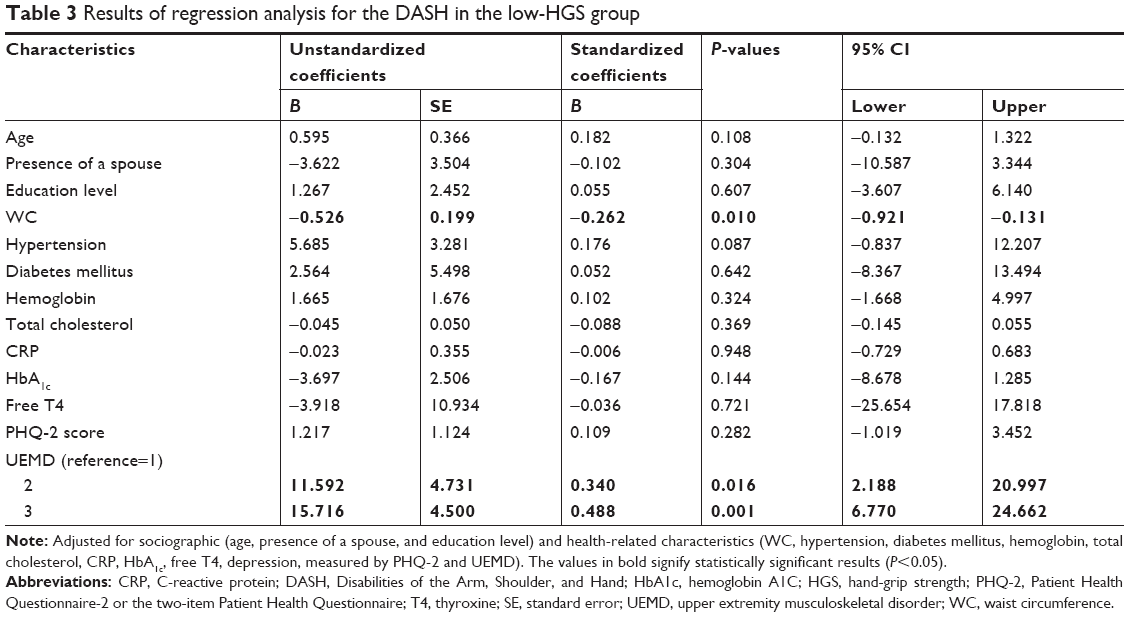 | Table 3 Results of regression analysis for the DASH in the low-HGS group |
Regression analysis for DASH in the normal-HGS group
When adjusted for age, presence of spouse, education level, WC, hypertension, diabetes mellitus, hemoglobin, total cholesterol, CRP, HbA1c, free T4, UEMD, and depression measured by the PHQ-2, the DASH score in the normal-HGS group was significantly correlated with only the PHQ-2 score (B=2.680, P<0.001; Table 4).
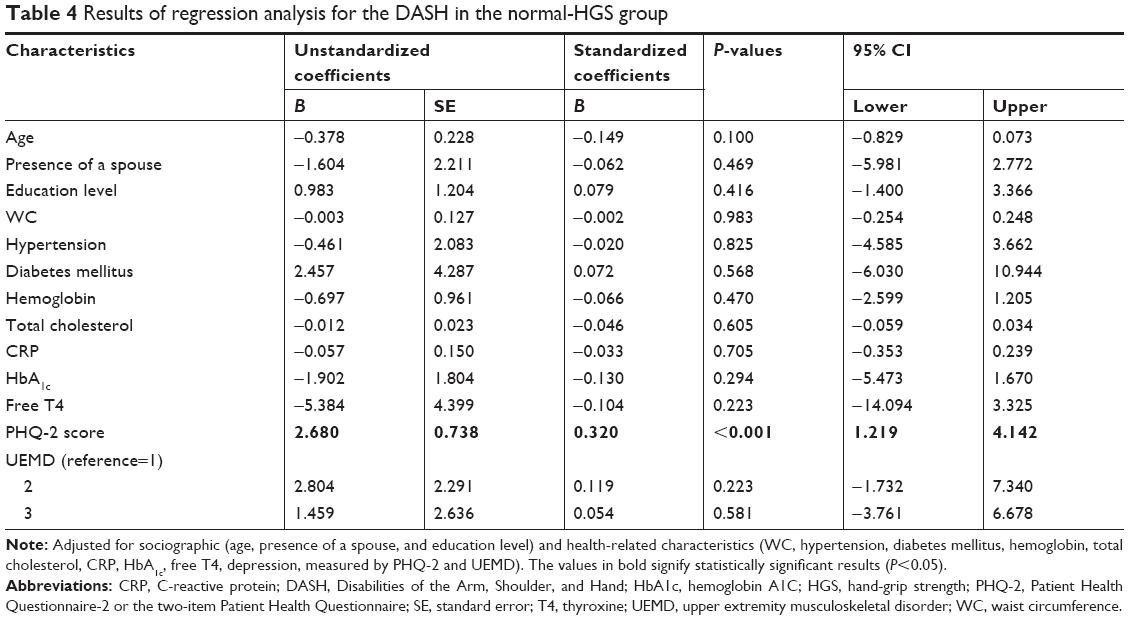 | Table 4 Results of regression analysis for the DASH in the normal-HGS group |
Discussion
This study thus demonstrated the degrading effect of reduced HGS on functional activity in upper extremity disorders. The DASH score (functional activity) was maintained in patients with normal HGS even in the presence of UEMD, and the presence of two or more upper extremity diseases in patients with a low GS was associated with lower functional activity in the upper extremity. We suggested that there was a relationship between GS and upper extremity function.
Beumer and Lindau24 performed a retrospective study with 37 patients with hand and wrist conditions to assess whether GS and the GS ratio correlated with the DASH scores. Significant correlations were found between the GS ratio and the DASH scores, as well as with the DASH subsection scores in all groups, and between the DASH scores and GS in some groups. The correlations between the GS ratio and the DASH scores were much stronger than the correlations between the GS and the DASH scores.
However, Dale et al25 performed a study with 1,107 recently-hired workers in jobs requiring either high- or low-hand intensity who completed physical examinations, including GS measurements, to evaluate the association between GS and upper extremity symptoms, work disability, and UEMDs. They reported that 26% of men and 20% of women had low baseline hand strength compared to normative data. Multivariate logistic regression analyses showed no consistent associations between GS and three health outcomes (upper extremity symptoms, work disability, and musculoskeletal disorders) in this young cohort (mean age: 30 years). Past musculoskeletal disorders and work type were significant predictors of these outcomes. Therefore, they suggested that physical hand-strength testing was not useful for identifying workers at risk of developing UEMDs and might be an inappropriate measure for post-offer job screens. In our study, functional activity was lower in the group with a low HGS. In addition, even when sociodemographic and health-related characteristics were adjusted, it was found that the upper-limb-related functional activity was lower in the group with a low HGS. Even if the same type and number of UEMDs are present, the upper limb-related functional activity of patients with a lower GS is further reduced.26
Meaningful threshold change values of outcome tools are essential for decision making regarding a patient’s status and to facilitate the communication of results. The reported minimal clinically important difference for the DASH outcome measure is 10–10.81.27,28 If the DASH score increases by >10 points, functional activity decreases clinically. In the low-GS group, the DASH score was 11–15 points worse than that of the group with only two or three upper extremity diseases. Therefore, even if the patient visited the hospital with a single disease, the GS would be reduced, and if there is a limit to the DASH of the upper extremity, the presence or absence of the upper extremity should be identified.
An assessment of functioning in elderly patients is also a much better predictor of survival and other outcomes than the presence of diseases or even the extent of comorbidities.29 Our results showed that lower GS was associated with lower functional activity related to the upper limb, consistent with the findings of earlier research. Moreover, we found that reduced GS modified the association between upper extremity disease and functional activity.
There are several limitations to this study. First, the study was cross-sectional, which restricts our ability to determine the causal relationship between the patients’ regional musculoskeletal status and disease-specific functional activity. Exploring the causal relationship would require considering complex psychological and social factors. Second, our study was limited to a single ethnic population recruited from a rural area, which signifies that their characteristics may not be representative of other elderly populations. Furthermore, the subjects did not necessarily seek medical treatment for their musculoskeletal complaints, which denotes that their personal characteristics, associated health conditions, and level of illness may differ from those of hospital- or clinic-based populations.
Conclusion
We found that HGS in rural women with UEMDs affected functional activity as measured by the DASH. Furthermore, maintaining muscle strength may improve patient functional activity limitation even if upper extremity diseases occur due to aging.
Disclosure
The authors report no conflicts of interest in this work.
References
Fultz NH, Ofstedal MB, Herzog AR, Wallace RB. Additive and interactive effects of comorbid physical and mental conditions on functional health. J Aging Health. 2003;15(3):465–481. | ||
Fried LP, Bandeen-Roche K, Kasper JD, Guralnik JM. Association of comorbidity with disability in older women: the Women’s Health and aging study. J Clin Epidemiol. 1999;52(1):27–37. | ||
Palmer KT, Goodson N. Ageing, musculoskeletal health and work. Best Pract Res Clin Rheumatol. 2015;29(3):391–404. | ||
McPhee CS, Lipscomb HJ. Upper-extremity musculoskeletal symptoms and physical health related quality of life among women employed in poultry processing and other low-wage jobs in northeastern North Carolina. Am J Ind Med. 2009;52(4):331–340. | ||
Campos-Fumero A, Delclos GL, Douphrate DI, et al. Upper extremity musculoskeletal pain among office workers in three Spanish-speaking countries: findings from the CUPID study. Occup Environ Med. 2016;73(6):394–400. | ||
Christensen K, Doblhammer G, Rau R, Vaupel JW. Ageing populations: the challenges ahead. Lancet. 2009;374(9696):1196–1208. | ||
Papa EV, Dong X, Hassan M. Skeletal muscle function deficits in the elderly: current perspectives on resistance training. J Nat Sci. 2017;3(1):e272. | ||
Yoo JI, Choi H, Ha YC. Mean hand grip strength and cut-off value for sarcopenia in Korean adults using Knhanes VI. J Korean Med Sci. 2017;32(5):868–872. | ||
Lauretani F, Russo CR, Bandinelli S, et al. Age-associated changes in skeletal muscles and their effect on mobility: an operational diagnosis of sarcopenia. J Appl Physiol. 2003;95(5):1851–1860. | ||
Lee JS, Kang SJ. The effects of strength exercise and walking on lumbar function, pain level, and body composition in chronic back pain patients. J Exerc Rehabil. 2016;12(5):463–470. | ||
Razmjou H, Davis AM, Jaglal SB, Holtby R, Richards RR. Disability and satisfaction after rotator cuff decompression or repair: a sex and gender analysis. BMC Musculoskelet Disord. 2011;12:66. | ||
Sayer AA, Syddall HE, Martin HJ, Dennison EM, Roberts HC, Cooper C. Is grip strength associated with health-related quality of life? findings from the hertfordshire cohort study. Age Ageing. 2006;35(4):409–415. | ||
Izawa KP, Kasahara Y, Hiraki K, Hirano Y, Watanabe S. Relation between the disability of the arm, shoulder and hand score and muscle strength in post-cardiac surgery patients. Diseases. 2017;5(4):E31. | ||
Chobanian AV, Bakris GL, Black HR, et al; National Heart, Lung, and Blood Institute Joint National Committee on Prevention, Detection, Evaluation, and Treatment of High Blood Pressure; National High Blood Pressure Education Program Coordinating Committee. The seventh report of the joint national committee on prevention, detection, evaluation, and treatment of high blood pressure: the JNC 7 report. JAMA. 2003;289(19):2560–2572. | ||
Marathe PH, Gao HX, Close KL. American Diabetes Association Standards of Medical Care in Diabetes 2017. J Diabetes. 2017;9(4):320–324. | ||
Lee SY, Park HS, Kim DJ, et al. Appropriate waist circumference cutoff points for central obesity in Korean adults. Diabetes Res Clin Pract. 2007;75(1):72–80. | ||
Kroenke K, Spitzer RL, Williams JB. The patient health questionnaire-2: validity of a two-item depression screener. Med Care. 2003;41(11):1284–1292. | ||
Chen LK, Liu LK, Woo J, et al. Sarcopenia in Asia: consensus report of the Asian working group for Sarcopenia. J Am Med Dir Assoc. 2014;15(2):95–101. | ||
Reinus WR, Shady KL, Mirowitz SA, Totty WG. MR diagnosis of rotator cuff tears of the shoulder: value of using T2-weighted fat-saturated images. AJR Am J Roentgenol. 1995;164(6):1451–1455. | ||
Sluiter JK, Rest KM, Frings-Dresen MH. Criteria document for evaluating the work-relatedness of upper-extremity musculoskeletal disorders. Scand J Work Environ Health. 2001;27(Suppl 1):1–102. | ||
Kellgren JH, Lawrence JS. Radiological assessment of osteo-arthrosis. Ann Rheum Dis. 1957;16(4):494–502. | ||
Haugen IK, Englund M, Aliabadi P, et al. Prevalence, incidence and progression of hand osteoarthritis in the general population: the Framingham osteoarthritis. Ann Rheum Dis. 2011;70(9):1581–1586. | ||
Hudak PL, Amadio PC, Bombardier C. Development of an upper extremity outcome measure: the DASH (disabilities of the arm, shoulder and hand) [corrected]. The Upper Extremity Collaborative Group (UECG). Am J Ind Med. 1996;29(6):602–608. | ||
Beumer A, Lindau TR. Grip strength ratio: a grip strength measurement that correlates well with DASH score in different hand/wrist conditions. BMC Musculoskelet Disord. 2014;15:336. | ||
Dale AM, Addison L, Lester J, Kaskutas V, Evanoff B. Weak grip strength does not predict upper extremity musculoskeletal symptoms or injuries among new workers. J Occup Rehabil. 2014;24(2):325–331. | ||
Ekstrand E, Lexell J, Brogårdh C. Grip strength is a representative measure of muscle weakness in the upper extremity after stroke. Top Stroke Rehabil. 2016;23(6):400–405. | ||
Sorensen AA, Howard D, Tan WH, Ketchersid J, Calfee RP. Minimal clinically important differences of 3 patient-rated outcomes instruments. J Hand Surg Am. 2013;38(4):641–649. | ||
Franchignoni F, Vercelli S, Giordano A, Sartorio F, Bravini E, Ferriero G. Minimal clinically important difference of the disabilities of the arm, shoulder and hand outcome measure (DASH) and its shortened version (QuickDASH). J Orthop Sports Phys Ther. 2014;44(1):30–39. | ||
Beard JR, Officer A, De Carvalho IA, et al. The World report on ageing and health: a policy framework for healthy ageing. Lancet. 2016;387(10033):2145–2154. |
 © 2018 The Author(s). This work is published and licensed by Dove Medical Press Limited. The
full terms of this license are available at https://www.dovepress.com/terms
and incorporate the Creative Commons Attribution
- Non Commercial (unported, 3.0) License.
By accessing the work you hereby accept the Terms. Non-commercial uses of the work are permitted
without any further permission from Dove Medical Press Limited, provided the work is properly
attributed. For permission for commercial use of this work, please see paragraphs 4.2 and 5 of our Terms.
© 2018 The Author(s). This work is published and licensed by Dove Medical Press Limited. The
full terms of this license are available at https://www.dovepress.com/terms
and incorporate the Creative Commons Attribution
- Non Commercial (unported, 3.0) License.
By accessing the work you hereby accept the Terms. Non-commercial uses of the work are permitted
without any further permission from Dove Medical Press Limited, provided the work is properly
attributed. For permission for commercial use of this work, please see paragraphs 4.2 and 5 of our Terms.