Back to Journals » International Journal of Nanomedicine » Volume 10 » Issue 1
Detection of hepatitis C virus core protein in serum by atomic force microscopy combined with mass spectrometry
Authors Ivanov Y, Kaysheva A, Frantsuzov P, Pleshakova TO, Krohin N, Izotov A, Shumov I, Uchaikin V ![]() , Konev V, Ziborov V, Archakov A
, Konev V, Ziborov V, Archakov A
Received 25 July 2014
Accepted for publication 16 October 2014
Published 25 February 2015 Volume 2015:10(1) Pages 1597—1608
DOI https://doi.org/10.2147/IJN.S71776
Checked for plagiarism Yes
Review by Single anonymous peer review
Peer reviewer comments 4
Editor who approved publication: Dr Thomas Webster
Yuri D Ivanov,1 Anna L Kaysheva,1,2 Pavel A Frantsuzov,1 Tatyana O Pleshakova,1 Nikolay V Krohin,1 Alexander A Izotov,1 Ivan D Shumov,1 Vasiliy F Uchaikin,1 Vladimir A Konev,1 Vadim S Ziborov,1 Alexander I Archakov1
1Institute of Biomedical Chemistry, 2PostgenTech Ltd, Moscow, Russia
Abstract: A method for detection and identification of core antigen of hepatitis C virus (HCVcoreAg)-containing particles in the serum was proposed, with due account taken of the interactions of proteotypic peptides with Na+, K+, and Cl- ions. The method is based on a combination of reversible biospecific atomic force microscopy (AFM)-fishing and mass spectrometry (MS). AFM-fishing enables concentration, detection, and counting of protein complexes captured on the AFM chip surface, with their subsequent MS identification. Biospecific AFM-fishing of HCVcoreAg-containing particles from serum samples was carried out using AFM chips with immobilized antibodies against HCVcoreAg (HCVcoreAgim). Formation of complexes between anti-HCVcoreAgim and HCVcoreAg-containing particles on the AFM chip surface during the fishing process was demonstrated. These complexes were registered and counted by AFM. Further MS analysis allowed reliable identification of HCVcoreAg within the complexes formed on the AFM chip surface. It was shown that MS data processing, with account taken of the interactions between HCVcoreAg peptides and Na+, K+ cations, and Cl- anions, allows an increase in the number of peptides identified.
Keywords: hepatitis C virus, molecular detector, biospecific fishing
Introduction
Development of high-sensitive analytical methods for proteomic analysis is a challenging problem for biochemical studies. The availability of such methods will enable new systems to be devised for early disease diagnostics and for control of the effectiveness of therapy. Atomic force microscopy (AFM) is commonly used to visualize proteins and their complexes in near-native conditions.1–4 The advantage of an AFM-based molecular detector lies in its ability to detect protein macromolecules and their complexes in single-molecule counting mode.1 Detection of protein immune complexes in pure solutions has been the subject of a large number of studies, which have shown that the difference between the immune complexes and immobilized antibodies can be determined from the difference in the heights of the objects detected by AFM.1,5–10 This approach was used to identify viral particles in solutions and biological fluids, eg, sputum and urine.11 Since the size of viral particles exceeds that of proteins, viral particles can be detected more easily as compared with pure proteins. In the case of detection of protein immune complexes in blood plasma, the situation is more complicated because this biological fluid contains a large number of nonspecific objects with a height comparable with that of immune complexes, which hinders AFM analysis. In some studies, radiolabeled nanoparticles were used to stain immune complexes upon their detection by AFM in blood plasma.12 However, the nanoparticles are unstable (prone to aggregation), so it is difficult to achieve high reproducibility of AFM analysis using nanoparticles. Therefore, in this paper, we propose a simpler method for direct label-free detection of immune complexes in serum by AFM that involves use of AFM chips with low nonspecific adsorption of serum components. In the present work, the AFM method is used in combination with biospecific fishing. The biospecific AFM fishing approach proposed herein allowed concentration of the target protein molecules from a large volume of analyte solution in a small sensor area of the AFM chip. The AFM chip is a piece of atomically flat, chemically modified support with immobilized antibodies against the target protein.1,13 With respect to serum, the novelty of this approach is that it allows visualization of all the immune complexes formed on the AFM chip with immobilized antibodies containing not only the antigen protein, but also its partner proteins.
The disadvantage of using AFM-based detectors in biomedical studies is their inability to identify objects visualized, which is particularly important in the analysis of multicomponent protein mixtures and biological material. Currently, unambiguous and reliable identification of protein molecules is done by mass spectrometry (MS). To carry out matrix-assisted laser desorption/ionization mass spectrometry (MALDI-MS) analysis, conventional conductive supports (targets) are used. Thus, gold-coated supports can be used for covalent immobilization of antibodies. However, firstly, the surface of these supports is not atomically smooth, and is not suitable for AFM analysis. Secondly, a gold surface promotes nonspecific adsorption of serum components. Therefore, the proposed combination of AFM fishing and MS analysis cannot be achieved using gold chips. In this work, we used AFM chips with an aminosilane surface. These chips show low nonspecific adsorption of serum components that can easily be washed off from the chip surface. Therefore, in our study, we combined AFM fishing with MS based on these chips for detection of proteins in serum.
According to the World Health Organization, 130–150 million people globally have chronic hepatitis C virus (HCV) infection. A significant number of those who are chronically infected will develop liver cirrhosis or liver cancer, and 350,000–500,000 people die every year from HCV-related liver disease. Antiviral medicines can cure HCV infection, but access to diagnosis and treatment is low (http://www.who.int/mediacentre/factsheets/fs164/en/). Given that acute HCV infection is usually asymptomatic, early diagnosis of this disease is rare. In those people who go on to develop chronic HCV infection, the disease may remain undiagnosed, often until serious liver damage has developed (http://www.who.int/mediacentre/factsheets/fs164/en/). In this study, an approach is proposed that combines the advantages of AFM plus biospecific fishing and the capabilities of MS analysis for identification of proteins captured onto the sensor area of the AFM chip.13 To conduct the biospecific AFM fishing, an AFM chip with monoclonal antibodies against the core antigen of HCV (HCVcoreAg), immobilized onto its surface (anti-HCVcoreAgim), was used.1,14,15 As a first step, fishing of HCVcoreAg-containing particles from serum samples was undertaken, as well as their concentration on the surface of the AFM chip with subsequent AFM visualization and counting of complexes formed. As a second step, the complexes were identified by MS. The MS data obtained were processed in two ways: the fished-out protein was identified using proteotypic peptides without considering the interactions with the most common blood plasma ions (Na+, K+, and Cl−) and by considering the possible modifications of these peptides with blood plasma ions. Such an approach enabled AFM imaging of immune complexes containing HCVcoreAg, and allowed us to perform an MS analysis of these complexes, taking into account modifications of the protein peptides by Na+, K+, and Cl− ions. At that, the accounting of these modifications enabled to perform more reliable detection of target protein in the serum. Thus, the proposed approach demonstrates certain promises in the course of disease diagnostics.
Materials and methods
Materials
Acetonitrile, isopropanol, and formic acid were sourced from Merck (Whitehouse Station, NJ, USA). Trifluoroacetic acid, ammonium bicarbonate, 1-ethyl-3-(3-dimethylaminopropyl)-carbodiimide hydrochloride (EDC), and N-hydroxysuccinimide (NHS) were obtained from Sigma-Aldrich (St Louis, MO, USA), α-cyano-4-hydroxycinnamic acid from Acros Organics (Fair Lawn, NJ, USA), trifluoroacetic acid from Fluka (St Louis, MO, USA), and phosphate-buffered saline containing 0.05% Tween-80 from Vector-Best (Novosibirsk, Russia). Ultrapure water used for preparation of all solutions was obtained using a Milli-Q deionizer (Millipore, Billerica, MA, USA).
All the solutions used in the AFM analysis (excluding stock solutions of proteins and solutions used for washing of AFM chips after their incubation in serum samples) were filtered using Amicon Ultra microconcentrators (3 kDa molecular weight cut-off, Millipore). The impurity content in the filtered solutions was monitored by AFM. An insignificant amount (0.5–1.0 particles/μm2) of particles of randomly distributed sizes (not greater than 1 nm) was observed in all solutions.
Muscovite mica pieces (muscovite grade V4, SPI Supplies, West Chester, PA, USA) were used to create the AFM chips. Modification of the mica surface was carried out with aminopropyltriethoxysilane according to the techniques described in detail by Archakov et al.1 Monoclonal antibodies against HCVcoreAg (clone 1E5, Virogen, Watertown, MA, USA); trypsin (Promega, Madison, WI, USA).
The serum samples were kindly provided by the Department of Infectious Diseases in Children No 1 of Pirogov Russian National Medical University of Ministry of Health of Russia and Federal Budget Institution of Science “Gabrichevski Research Institute of Epidemiology and Microbiology of Moscow” of Rospotrebnadzor of Russia. All the serum samples were previously tested for HCV marker (HCV RNA) content by polymerase chain reaction (PCR). HCV RNA content in patient serum presupposes intensive replication of the virus in hepatocytes, and, hence, production and excretion of viral particles and HCV proteins in blood. Therefore, according to PCR, all serum samples containing HCV RNA were considered to be HCV-positive.
Covalent immobilization of monoclonal antibodies against HCVcoreAg
Monoclonal antibodies against HCVcoreAg were immobilized onto the amino-modified mica surface via a standard NHS/EDC technique. For this purpose, 0.5 µL of buffer solution (50 mM potassium phosphate, pH 7.4) containing 0.1 µM antibodies and the EDC/NHS mixture (EDC:NHS molar ratio 0.16:0.04 M) was deposited onto the mica surface and incubated for three minutes. Next, the substrate was washed in deionized water for 30 minutes and dried. In this study, two types of AFM chips were used, ie, AFM chips with immobilized antibodies and control AFM chips with an amino-modified surface but without immobilized antibodies. The efficiency of immobilization of antibodies onto the AFM chip surface was estimated using AFM.
Biospecific AFM fishing of HCVcoreAg from human serum samples
The following technique was used for biospecific fishing of HCVcoreAg from human serum samples. The sample to be analyzed was diluted 100-fold with phosphate-buffered saline containing 0.05% Tween-80 (PBS-t; 10 μL of serum and 990 μL of PBS-t). The AFM chip with immobilized monoclonal antibodies was placed into a microtube with diluted serum and incubated in a thermoshaker at 600 rpm and 37°C for 30 minutes. After incubation in serum, the AFM chip was washed twice in PBS-t in a shaker (600 rpm, 37°C, 30 minutes) and then once in deionized water (600 rpm, 37°C, 30 minutes). After washing, the AFM chip was dried under an air stream whereupon AFM scanning was performed. After brief drying of the mica in the air stream, the thin water layer remains on mica surface.16 Therefore, protein molecules immobilized on the surface are kept in near-native conditions during AFM scanning after the drying process. AFM analysis was repeated at least twice for each serum sample.
AFM measurements
In the study, a multimode NTEGRA Prima atomic force microscope (NT-MDT, Zelenograd, Russia) was used to obtain AFM chip surface images and to measure the height of the objects registered.
AFM measurements were carried out in tapping mode in air. The AFM chip with immobilized monoclonal antibodies or the control chip was incubated in a diluted serum sample. The AFM chip was then washed and dried under an air flow. The experimental conditions for AFM scanning were as follows: standard AFM tips (NSG10, NT-MDT), relative humidity of 60%, and temperature 22°C. The free oscillation amplitude of the cantilever was 50–100 nm. The scan resolution was 256×256 pixels. The scan size was from 2×2 to 5×5 µm2, and the number of scans collected for each sample was no less than ten.
Nova software (NT-MDT) was used for signal treatment and formation of images. Analysis of AFM images was carried out using AFM data processing software developed in the Institute of Biomedical Chemistry, Russian Academy of Medical Sciences (Rospatent registration 2010613458) that determined the heights of the objects visualized. Height distribution plots were constructed using MS Excel software.
During analysis of the distributions obtained for fished-out objects with heights, no less than 1,000 particles of each type were registered and counted. The density of the AFM-visualized objects distribution with height, ρ(h), was calculated analogous to the study by Archakov et al:1 ρ(h)=(Nh/N)×100%, where Nh is the number of imaged objects, with height h, and N is the total number of imaged objects.
MS analysis
Proteolysis on AFM chip surface
Trypsinolysis of proteins, biospecifically fished out onto anti-HCVcoreAgim, was carried out directly on the AFM chip surface. To this end, 1 μL of 10−9 M trypsin solution and 1 μL of acetonitrile were added to 5 μL of 50 mM NH4HCO3 buffer solution (pH 7.4). This mixture was transferred onto the AFM chip surface for trypsinolysis, which was carried out at constant air humidity and temperature using a standard technique analogous to that described by Shevchenko et al.17,18 Briefly, the procedure was as follows: 7 μL of trypsinolytic mixture was dispensed onto the AFM chip surface and incubated for 5 hours at 42°C and 90% humidity. Next, another 7 μL of trypsinolytic mixture was dispensed onto the chip surface and incubated for 13 hours. The trypsinolytic mixture (sample) was then washed off with 20 μL of 80% acetonitrile in 0.7% trifluoroacetic acid. The sample was dried in a SpeedVac vacuum concentrator (Eppendorf, Hauppauge, NY, USA). For MS analysis, the dried sample was dissolved by adding 5 μL of 0.7% trifluoroacetic acid. The sample was then sonicated in an ultrasonic bath for several minutes at room temperature. The samples were stored at −80°C.
MALDI-MS analysis
Protein identification was carried out using an Autoflex III MALDI-TOF/TOF mass spectrometer (Bruker Daltonics, Leipzig, Germany), equipped with a 337 nm nitrogen laser. The data were obtained using peptide calibration standards for the reflector positive ion mode (reflector voltage 5 kV). The range of registered masses was 800–3,000 m/z and the pulse delay time was 200 nsec. Peptide calibration standards were represented by the following peptides, with monoisotopic mass shown in brackets: bradykinin (757.3992 Da), angiotensin II (1,046.5420 Da), angiotensin I (1,296.6853 Da), peptide P (1,347.7361 Da), bombesin (1,619.230 Da), rennin (1,758.9326 Da), adrenocorticotropic hormone fragment 1–17 (2,093.0868 Da), adrenocorticotropic hormone fragment 18–39 (2,465.1990 Da), and somatostatin (3,147.4714 Da). Matrix peaks and trypsin autolysis peaks were not considered in spectra analysis. MS spectrum data accumulation occurred in automatic mode (~10,000 shots). To obtain mass spectra of the analyzed samples, the trypsinolytic mixture was mixed with an excess of matrix (α-cyano-4-hydroxycinnamic acid in a 50% solution of acetonitrile in 0.7% trifluoroacetic acid) in a ratio ranging from 1:1,000 to 1:10,000. The mixture obtained was dispensed onto an MTP AnchorChip 384 target.
The mass spectra were processed using flexAnalysis software (version 2.0, Bruker, Germany). Protein identification was carried out with Mascot software (http://www.matrixscience.com) using the National Center for Biotechnology Information protein sequences data library. The following search parameters were chosen: one missed site of hydrolysis; monoisotopic mass measurement accuracy <100 ppm; and an oxidized methionine indicated as a possible amino acid modification.
Results
Control of quality of anti-HCVcoreAg immobilization onto AFM substrate surface
AFM scanning of the aminosilanized mica surface after immobilization of antibodies allowed us to estimate the quality of the AFM chip.
A typical AFM image and distribution of the anti-HCVcoreAgim molecules with heights ρ(h) is shown in Figure 1A and B. Figure 1A shows objects, lying closely to each other on the chip surface. These objects can be classified as immobilized antibodies (anti-HCVcoreAgim).1,16,19 In the present study, the ρ(h) distribution maximum of anti-HCVcoreAgim was estimated to be 1.6±0.2 nm (Figure 1B). These data are in good agreement with the values for anti-HCVcoreAgim height (1.5±0.2 nm) previously reported by Archakov et al1 and the results reported by Thomson where the measured height of immunoglobulin G molecules was shown to be 1.5–2.5 nm.16
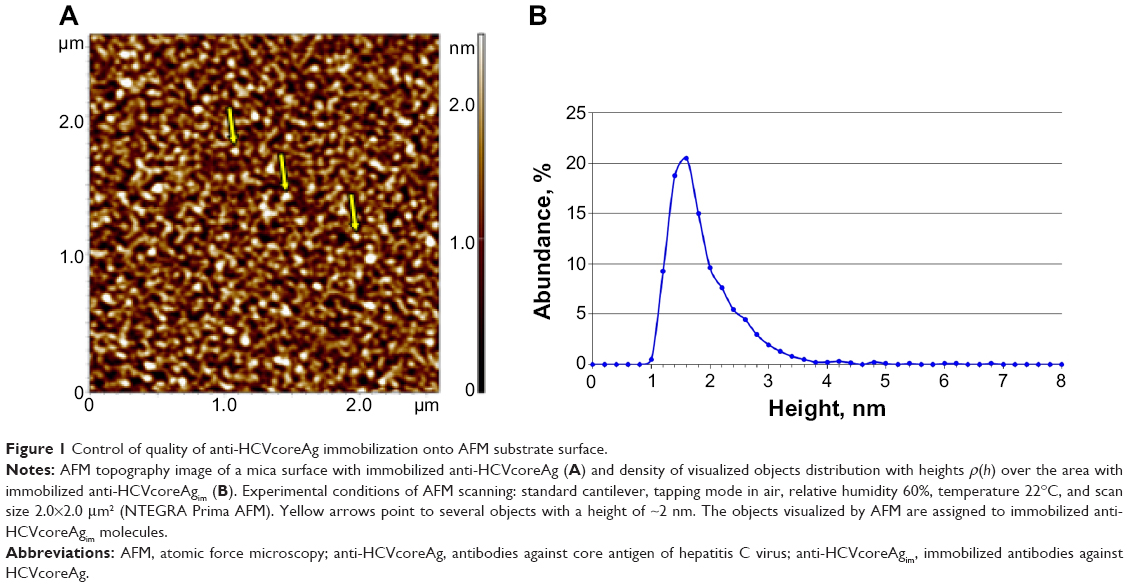 | Figure 1 Control of quality of anti-HCVcoreAg immobilization onto AFM substrate surface. |
MALDI-MS analysis of samples from the surfaces of the AFM chips with anti-HCVcoreAgim enabled identification of ten peptides relating to anti-HCVcoreAgim. The corresponding mass spectrum is shown in Figure 2. At the same time, MS analysis of control samples from the surfaces of AFM chips without anti-HCVcoreim did not reveal any objects of a protein nature (data not shown).
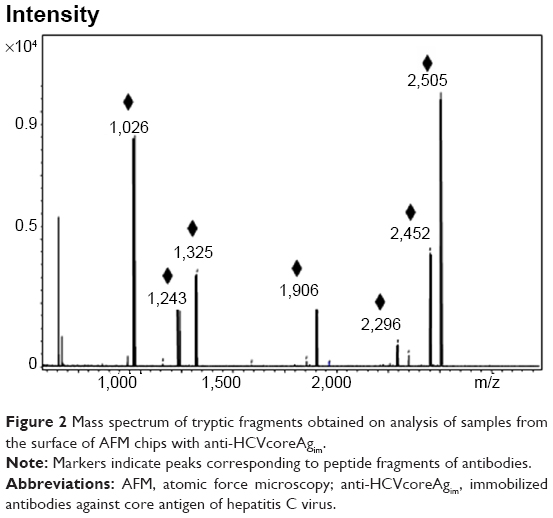 | Figure 2 Mass spectrum of tryptic fragments obtained on analysis of samples from the surface of AFM chips with anti-HCVcoreAgim. |
Detection of HCVcore-containing particles in serum by AFM fishing
Human serum is a multicomponent material containing a variety of proteins (albumins, globulins, fibrinogen) and lipoproteins. The serum components show strong adhesion to the AFM chip surface and are able to nonspecifically adsorb onto it. Therefore, to eliminate the impact of nonspecific adsorption of serum components on the results of AFM analysis, an AFM chip washing procedure with use of buffer containing Tween-80 detergent was developed. For the same purpose, serum diluted with this buffer was used throughout the AFM chip incubation procedure.
As a control experiment, amino-modified mica without immobilized antibodies was incubated in serum according to the developed protocol. Figure 3 shows an AFM image of the surface of this mica chip obtained after incubation in the serum sample with subsequent washing. As shown, the heights of objects imaged by AFM did not exceed 5 nm, while their quantity was no more than 0.5–1.0 objects per 1 μm2. Thus, the serum components nonspecifically bound to the AFM chip surface may well be neglected if the quantity of biospecifically fished-out objects makes up about 30 objects per 1 μm2.
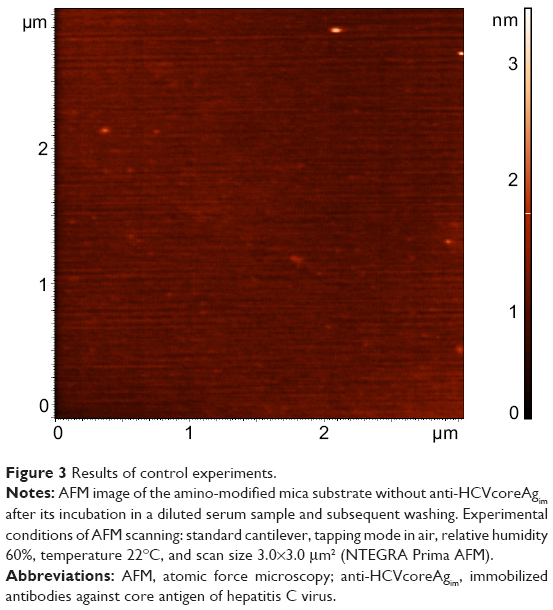 | Figure 3 Results of control experiments. |
Analysis of sera was carried out according to the technique described earlier (see AFM measurements section). A total of 20 serum samples (17 HCV RNA-positive and three HCV RNA-negative by PCR data) were tested.
Upon AFM visualization of anti-HCVcoreAgim, the heights of most (>90%) objects were found to be within the range of 1–3 nm, with no objects having a height greater than 5 nm (Figure 1). Accordingly, a 5 nm height threshold (cut-off line) was chosen for attributing each of the objects formed on the surface during biospecific fishing to anti-HCVcoreAgim/HCVcoreAg complexes.19
Objects with heights greater than 5 nm were visualized on AFM analysis of HCV-negative (by PCR data) serum samples. However, these comprised no more than 5% of all registered objects. Therefore, to attribute the serum samples to either positive or negative ones according to AFM analysis data, the following criterion was established: serum was considered to be positive if, after incubation of AFM chip in the sample, ≥5% of all AFM-registered objects on the chip surface had heights ≥5 nm.19 The AFM data on particles with heights >5 nm contain are shown in Table S1.
Figure 4A–D shows the AFM images and distribution of registered objects with height, as obtained by AFM analysis of two serum samples, ie, a negative one not containing HCV (Figure 4A and B) and a positive one containing HCV (Figure 4C and D). As seen from Figure 4A, after incubation of the AFM chip in the HCV-negative sample, no objects with heights greater than 5 nm appeared. This was confirmed by constructing distribution with height (Figure 4B). At the same time, in the course of AFM analysis of the HCV-positive sample (Figure 4C and D), a significant amount of objects with heights up to 10–15 nm appeared. An area marked in gray in Figure 4D indicates the presence of objects with heights of ≥5 nm in the distribution. Objects with heights ≥5 nm appearing during incubation of mica in the positive serum sample corresponded to the complexes of anti-HCVcoreim and HCVcoreAg-containing particles present in the analyzed samples. The relative content of such objects on the AFM chip surface for this serum sample makes up 17% of all AFM-registered objects.
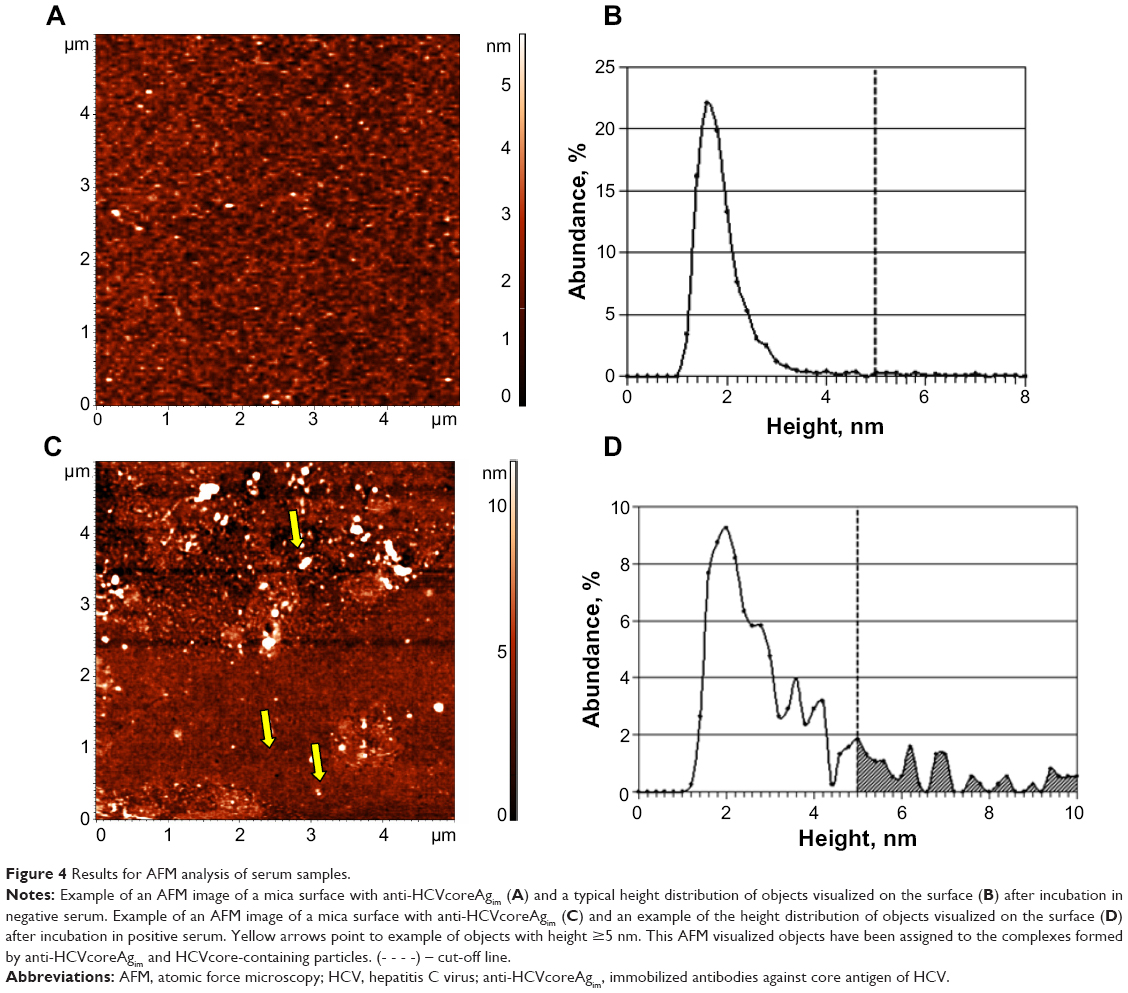 | Figure 4 Results for AFM analysis of serum samples. |
The AFM data are in good agreement with the data obtained by PCR and are confirmed by appropriate serum tests (Table S1), ie, 17 samples of HCV RNA-containing serum may be considered positive (based on both PCR and AFM data). Analogously, three serum samples not containing HCV RNA (by PCR data) may be considered negative (by AFM data). The criteria for classification of serum samples as positive or negative based on HCVcoreAg content are described at length in our earlier paper.19
Discussion
The AFM measurements obtained in this study demonstrate the possibility of using AFM chips with immobilized antibodies against HCVcoreAg for visualization of immune complexes formed on the surface of AFM chips after their incubation in serum samples. Previously, we have shown that the height of immune complexes formed on the AFM chip surface between anti-HCVcoreim and recombinant HCVcoreAg fished out from buffer solution is 3–6 nm.1,19 However, in the present study, AFM analysis of serum samples revealed objects with heights ≥6 nm (up to 35 nm in particular samples). These objects may also represent target immune complexes. The presence of objects of this height on the AFM chip surface following analysis of serum samples is inconsistent with our earlier data on recombinant HCVcoreAg AFM fishing from buffer solution.1 The divergence in the data can possibly be explained by formation of more complicated structures of anti-HCVcoreim with HCVcoreAg-containing viral fragments.20 It is noteworthy that HCV nucleocapsids, surrounded by HCVcoreAg, have been found in the blood of HCV-infected patients,21 and the size of aggregates of such particles with antibodies exceeds the height of immune complexes formed by recombinant HCVcoreAg and chip-immobilized antibodies. Moreover, it is quite possible that other types of complexes of HCVcoreAg-containing particles with immobilized antibodies (for instance, the aggregates of HCVcoreAg with immunoglobulins and other blood proteins) can be formed.
MS identification of AFM-registered HCVcoreAg-containing viral particles in serum
Figure 5 shows a typical MALDI-MS spectrum obtained by analysis of a sample from the AFM chip after incubation in HCVcoreAg-containing serum. This spectrum shows eleven peptides corresponding to HCVcoreAg, along with those related to anti-HCVcoreAgim.
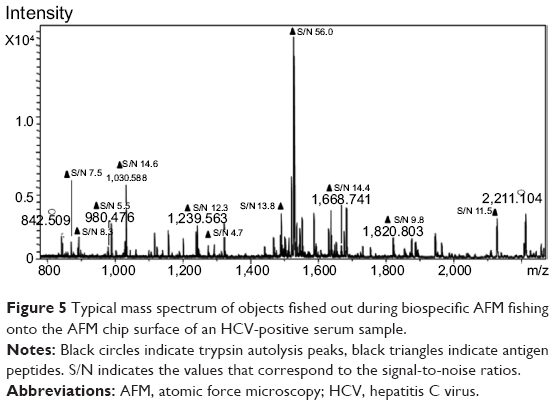 | Figure 5 Typical mass spectrum of objects fished out during biospecific AFM fishing onto the AFM chip surface of an HCV-positive serum sample. |
Processing of the AFM-MS data obtained for the 17 HCV-positive samples revealed seven common HCVcoreAg peptides (Table 1). Three peptides (m/z 900.5, 1,030.5, 1,468.7) corresponding to the seven most often identified HCVcoreAg peptides were detected in this HCV-positive serum samples. Analysis of the location of these seven peptides in the HCVcoreAg amino acid sequence showed that all of them may be related to the conservative regions of HCVcoreAg.
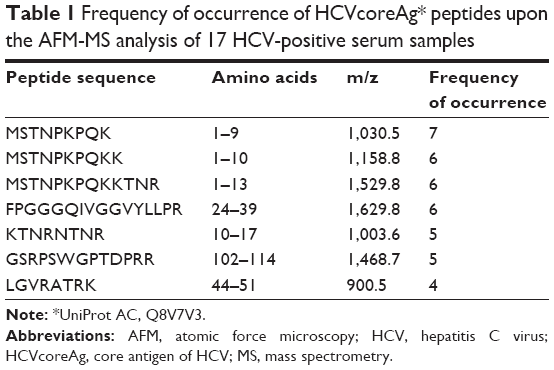 | Table 1 Frequency of occurrence of HCVcoreAg* peptides upon the AFM-MS analysis of 17 HCV-positive serum samples |
Detection of HCVcoreAg peptide fragments, containing cations, in serum samples
As already known, the concentration of Na+ and K+ cations in serum is rather high (150 mM and 5 mM, respectively). These cations may interact with HCVcoreAg molecules in tested samples.22,23 To verify this suggestion, the MS data obtained were processed taking into account the interaction of HCVcoreAg peptides with Na+ and K+ cations, and also with Cl− anions.
The experimental part of this section implied occurrence of HCVcoreAg peptide fragments in their complexes with Na+ and K+ cations. We analyzed the mass spectra obtained for 17 serum samples, in which HCVcoreAg peptides modified with Na+ and K+ cations along with unmodified peptides were identified.
Peptides modified with Na+ and K+ were found over the entire HCVcoreAg amino acid sequence (UniProt AC Q8V7V3, Table 2). Based on analysis of the peptide maps obtained for HCV-positive samples, having due regard for modifications of HCVcoreAg peptides with Na+ and K+, an increase (by 1–3 peptides) in the number of identified hepatitis C marker protein peptides was established (Figure 6). Following processing of the MS data obtained upon analysis of HCV-negative samples, no peptide fragments corresponding to modifications of HCVcoreAg peptides were detected.
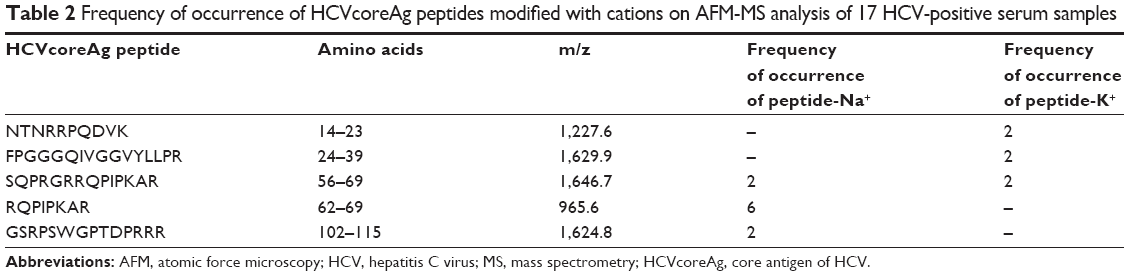 | Table 2 Frequency of occurrence of HCVcoreAg peptides modified with cations on AFM-MS analysis of 17 HCV-positive serum samples |
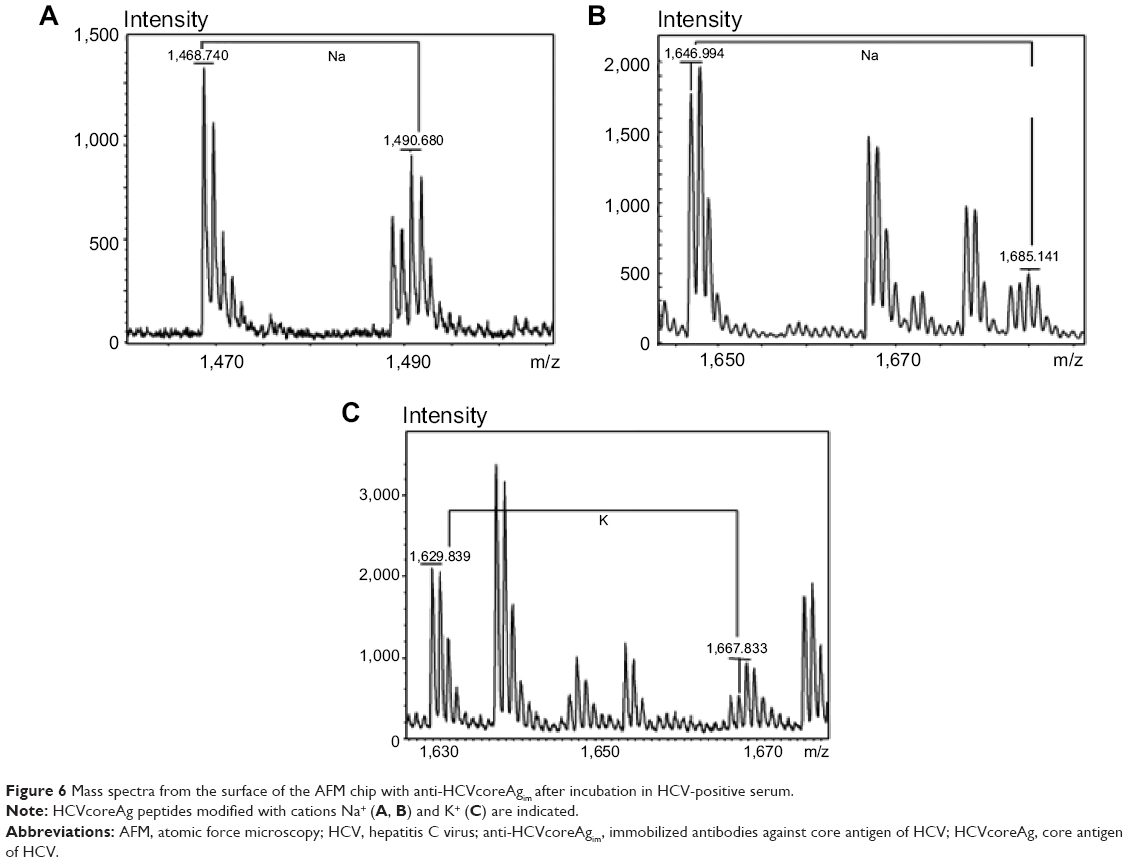 | Figure 6 Mass spectra from the surface of the AFM chip with anti-HCVcoreAgim after incubation in HCV-positive serum. |
We also analyzed MS peptide maps (obtained for positive serum samples containing HCV viral particles) for occurrence of interactions with K2Cl+ and Na2Cl+ ions, and found that the number of registered peptides necessary for identification of hepatitis C marker protein increased. This increase made up 1–5 peptides for 14 of 17 HCV-positive samples. No modified peptides were detected in three of the 17 HCV-positive samples (Table 3, Figure 7); however, in these three samples, 3–4 nonmodified peptides corresponding to HCVcoreAg marker protein were identified (Table 3).
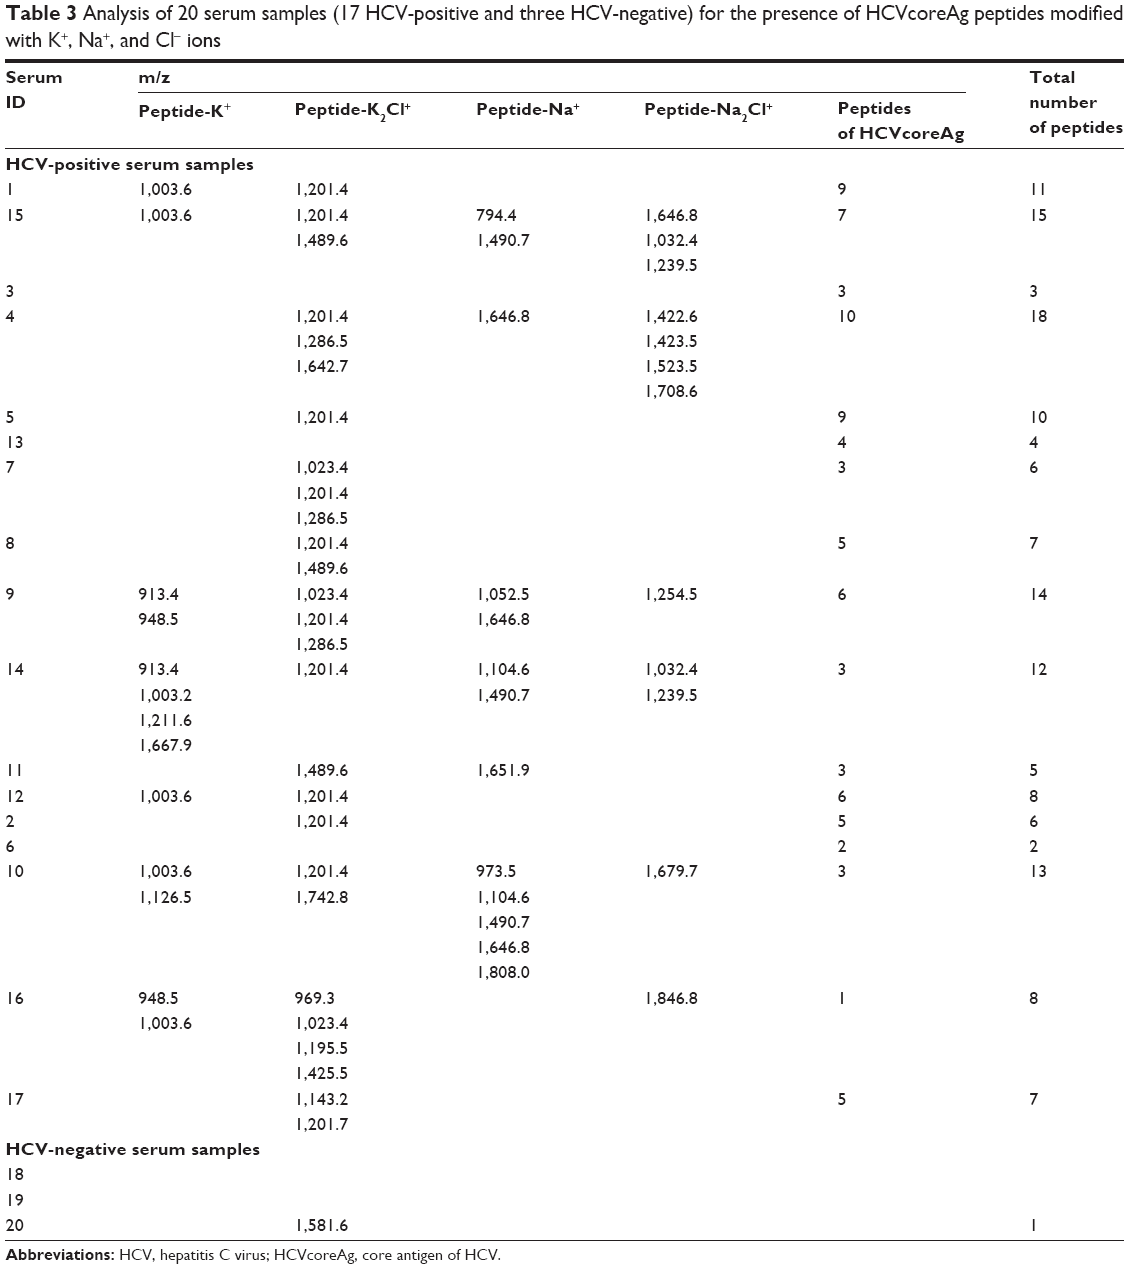 | Table 3 Analysis of 20 serum samples (17 HCV-positive and three HCV-negative) for the presence of HCVcoreAg peptides modified with K+, Na+, and Cl− ions |
 | Figure 7 Number of peptides revealed in the analyzed HCV-positive and HCV-negative serum samples by MALDI-MS analysis. Unmodified HCVcoreAg peptides are shown in blue and HCVcoreAg peptides modified with K2Cl+ are shown in red. The data for HCV-positive samples are shown to the left of the dashed line; the data for HCV-negative samples are shown to the right of the dashed line. |
Upon analysis of three mass MS peptide maps obtained for the negative serum samples (ie, for those without HCV RNA), a peak corresponding to modification of HCVcoreAg peptide (with m/z =1,581.63) was identified in one of the three HCV-negative serum samples. This peak was excluded as nonspecific on the analysis of MS data for the HCV-negative serum samples.
As seen in Table 3, the number of HCVcoreAg peptides, detected without due account taken of interactions with ions in the sera, was equal to 6 – for 17 HCV-positive serum samples. Taking into account the modification of HCV marker protein with K+, Na+, or K2Cl+ enables an increase in the number of detected HCVcoreAg fragments by two peptides on average. This represents a twofold increase in the number of detected peptides of the target protein.
Thus, it has been demonstrated that analysis of MS data regarding modification of marker protein peptides with Na+, K+, K2Cl+, and Na2Cl+ ions enables to enhance the reliability of marker proteins detection in the serum thereby demonstrating a high diagnostic potential. The originality of our technology based on the combination of AFM with MS for disease diagnostics proposed in this study lies in its ability to visualize immune complexes on the AFM chip surface while enabling their identification. This approach may be used for detection of other viral particles in serum upon using the appropriate AFM chips with immobilized probes against the marker proteins characteristic for these viruses.
It should be noted that the data yielded in this study were obtained using standard AFM with a low (1 Hz) scanning speed. Therefore, the time required for selective scanning of the AFM chip surface was in the order of 3 hours. At the same time, a number of scientific groups are developing high-speed AFM devices with scanning speeds up to 20 Hz (http://www.bruker.com/) and even 1.25 kHz,24 which allow a reduced scanning time. The use of high-speed AFM opens up the opportunity to use it in medical diagnostics, as the time required for the analysis of the AFM chip is reduced 100–1,000 times.
Acknowledgment
This study was supported by RFBR Grant No. 15-04-08368 A and RSCF Grant No. 14-25-00132.
Author contributions
All authors contributed toward data analysis, drafting and revising the paper and agree to be accountable for all aspects of the work.
Disclosure
The authors report no conflicts of interest in this work.
References
Archakov A, Ivanov Y, Lisitsa A, Zgoda V. Biospecific irreversible fishing coupled with atomic force microscopy for detection of extremely low-abundant proteins. Proteomics. 2009;9:1326–1343. | ||
Ivanov YD, Frantsuzov PA, Zollner A, et al. Atomic force microscopy study of protein-protein interactions in the cytochrome CYP11A1 (P450scc)-containing steroid hydroxylase system. Nanoscale Res Lett. 2011;6:54–67. | ||
Ivanov YD, Bukharina NS, Frantsuzov PA, et al. AFM study of cytochrome CYP102A1 oligomeric state. Soft Matter. 2012;8: 4602–4608. | ||
Ivanov YD, Bukharina NS, Pleshakova TO, et al. Atomic force microscopy fishing and mass spectrometry identification of gp120 on immobilized aptamers. Int J Nanomedicine. 2014;9:4659–4670. | ||
Ouerghi O, Touhami A, Othmane A, Ben Ouada H. Investigating antibody-antigen binding with atomic force microscopy. Sens Actuators B Chem. 2002;84:167–175. | ||
Maliuchenko NV, Agapov II, Tonevitskii AG, et al. [Detection of immune complexes using atomic force microscopy]. Biofizika. 2004;49: 1008–1014. Russian. | ||
Lynch M, Curtis M, Huff J, Nettikadan S, Johnson J, Henderson E. Functional protein nanoarrays for biomarker profiling. Proteomics. 2004;4:1695–1702. | ||
Ramanaviciene A, Snitka V, Mieliauskiene R, Kazlauskas R, Ramanavicius A. AFM study of complement system assembly initiated by antigen-antibody complex. Central European Journal of Chemistry. 2006;4:194–206. | ||
Ierardi V, Ferrera F, Millo E, Damonte G, Filaci G, Valbusa U. Bioactive surfaces for antibody-antigen complex detection by atomic force microscopy. J Phys Conf Ser. 2013;439:02001. | ||
Basheer N, Shanmuganathan R, Palanichamy G, Tamilmani E, Shanmugam K. Topographical imaging of antigen-antibody interaction and hepatitis B surface antigen on self-assembled monolayer of mica. Int J Pharm Bio Sci. 2014;5(B):319–325. | ||
Nettikadan S, Johnson J, Vengasandra S, Muys J, Henderson E. ViriChip: a solid phase assay for detection and identification of viruses by atomic force microscopy. Nanotechnology. 2004;15:383–389. | ||
Lee KB, Kim EY, Mirkin CA, Wolinsky SM. The use of nanoarrays for highly sensitive and selective detection of human immunodeficiency virus type 1 in plasma. Nano Lett. 2004;4:1869–1872. | ||
Archakov AI, Ivanov YD. Analytical nanobiotechnology for medicine diagnostics. Mol Biosyst. 2007;3:336–342. | ||
Archakov AI, Govorun VM, Dubanov AV, et al. Protein-protein interactions as a target for drugs in proteomics. Proteomics. 2003;3: 380–391. | ||
Ivanov YD, Govorun VM, Bykov VA, Archakov AI. Nanotechnologies in proteomics. Proteomics. 2006;6:1399–1414. | ||
Thomson NH. Imaging the substructure of antibodies with tapping-mode AFM in air: the importance of a water layer on mica. J Microsc. 2005;217 Pt 3:193–199. | ||
Shevchenko A, Keller P, Mann M, Simons K. Identification of components of trans-Golgi network-derived transport vesicles and detergent-insoluble complexes by nanoelectrospray tandem mass spectrometry. Electrophoresis. 1997;18:2591–2600. | ||
Kussmann M, Roepstorf P. Sample preparation techniques for peptides and proteins analyzed by MALDI-MS. Methods Mol Biol. 2000; 146:405–424. | ||
Ivanov ID, Frantsuzov PA, Pleshakova TO, et al. [Atomic force microscopy detection of serological markers of viral hepatites B and C]. Biomed Khim. 2009;55:689–701. Russian. | ||
Kanto T, Hayashi N, Takehara T, et al. Buoyant density of hepatitis C virus recovered from infected hosts: two different features in sucrose equilibrium density-gradient centrifugation related to degree of liver inflammation. Hepatology. 1994;19:296–302. | ||
Prince AM, Huima-Byron T, Parker TS, Levine DM. Visualization of hepatitis C virions and putative defective interfering particles isolated from low-density lipoproteins. J Viral Hepat. 1996;3:1–7. | ||
Jolivet-Reynaud C, Dalbon P, Viola F, et al. HCV core immunodominant region analysis using mouse monoclonal antibodies and human sera: Characterization of major epitopes useful for antigen detection. J Med Virol. 1998;56:300–309. | ||
Aghasadeghi MR, Sadat SM, Budkowska A, et al. Evaluation of a native preparation of HCV core protein (2–122) for potential applications in immunization, diagnosis and mAb production. Iran J Public Health. 2006;35:1–10. | ||
Ando T, Kodera N, Maruyama D, Takai E, Saito K, Toda A. A high-speed atomic force microscope for studying biological macromolecules in action. Jpn J Appl Phys. 2002;41:4851–4856. |
Supplementary material
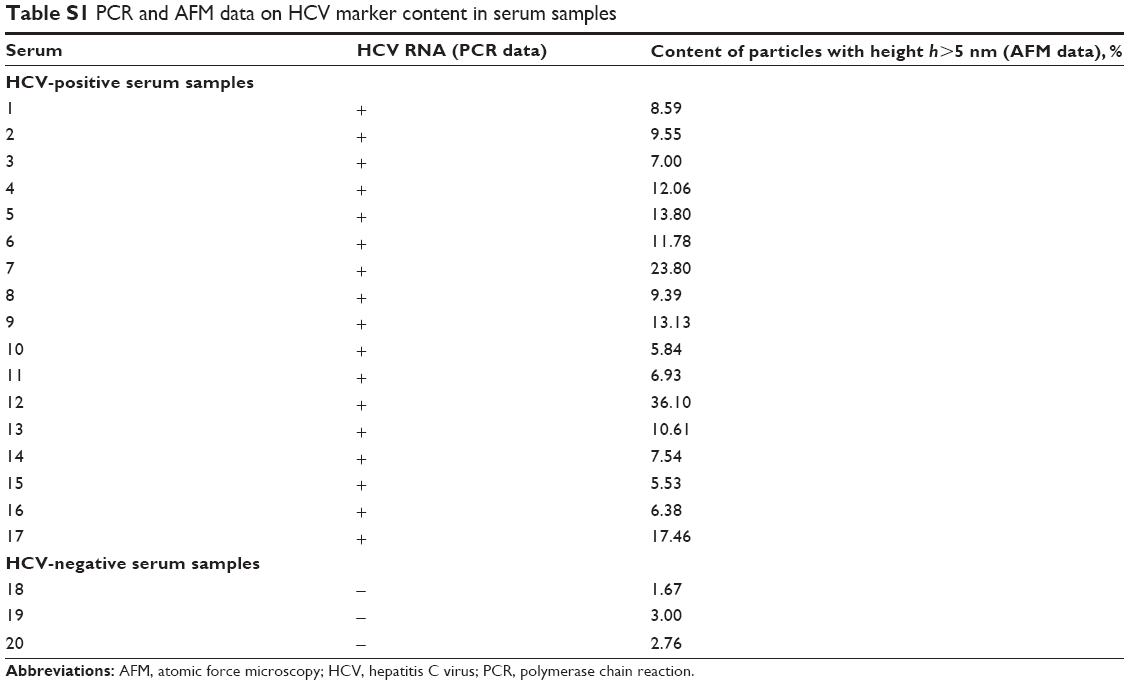 | Table S1 PCR and AFM data on HCV marker content in serum samples |
 © 2015 The Author(s). This work is published and licensed by Dove Medical Press Limited. The
full terms of this license are available at https://www.dovepress.com/terms
and incorporate the Creative Commons Attribution
- Non Commercial (unported, 3.0) License.
By accessing the work you hereby accept the Terms. Non-commercial uses of the work are permitted
without any further permission from Dove Medical Press Limited, provided the work is properly
attributed. For permission for commercial use of this work, please see paragraphs 4.2 and 5 of our Terms.
© 2015 The Author(s). This work is published and licensed by Dove Medical Press Limited. The
full terms of this license are available at https://www.dovepress.com/terms
and incorporate the Creative Commons Attribution
- Non Commercial (unported, 3.0) License.
By accessing the work you hereby accept the Terms. Non-commercial uses of the work are permitted
without any further permission from Dove Medical Press Limited, provided the work is properly
attributed. For permission for commercial use of this work, please see paragraphs 4.2 and 5 of our Terms.