Back to Journals » International Journal of Nanomedicine » Volume 12
Design, optimization and characterization of coenzyme Q10- and D-panthenyl triacetate-loaded liposomes
Authors Çelik B ![]() , Sağıroğlu AA
, Sağıroğlu AA ![]() , Özdemir S
, Özdemir S
Received 1 May 2017
Accepted for publication 13 June 2017
Published 7 July 2017 Volume 2017:12 Pages 4869—4878
DOI https://doi.org/10.2147/IJN.S140835
Checked for plagiarism Yes
Review by Single anonymous peer review
Peer reviewer comments 5
Editor who approved publication: Dr Thomas Webster
Burak Çelik,1 Ali Asram Sağıroğlu,1 Samet Özdemir2
1Department of Pharmaceutical Technology, Faculty of Pharmacy, Bezmialem Vakif University, 2Department of Pharmaceutical Technology, Faculty of Pharmacy, Yeditepe University, Istanbul, Turkey
Abstract: Coenzyme Q10 (CoQ10) is a lipid-soluble molecule found naturally in many eukaryotic cells and is essential for electron transport chain and energy generation in mitochondria. D-Panthenyl triacetate (PTA) is an oil-soluble derivative of D-panthenol, which is essential for coenzyme A synthesis in the epithelium. Liposomal formulations that encapsulate both ingredients were prepared and optimized by applying response surface methodology for increased stability and skin penetration. The optimum formulation comprised 4.17 mg CoQ10, 4.22 mg PTA and 13.95 mg cholesterol per 100 mg of soy phosphatidylcholine. The encapsulation efficiency of the optimized formulation for CoQ10 and PTA was found to be 90.89%±3.61% and 87.84%±4.61%, respectively. Narrow size distribution was achieved with an average size of 161.6±3.6 nm, while a spherical and uniform shape was confirmed via scanning electron microscopy and transmission electron microscopy images. Cumulative release of 90.93% for PTA and 24.41% for CoQ10 was achieved after 24 hours of in vitro release study in sink conditions. Physical stability tests indicated that the optimized liposomes were suitable for storage at 4°C for at least 60 days. The results suggest that the optimized liposomal formulation would be a promising delivery system for both ingredients in various topical applications.
Keywords: coenzyme Q10, D-panthenyl triacetate, liposomes, response surface methodology, stability
Introduction
Coenzyme Q10 (CoQ10), which consists of a p-benzoquinone ring with 10 isoprene units (Figure 1), is a lipid-soluble molecule found naturally in many eukaryotic cells.1 CoQ10 is primarily used as an electron transporter inside the cell and is essential in mitochondrial respiration that generates energy in the form of adenosine triphosphate (ATP); moreover, it has strong antioxidant capabilities inhibiting lipid peroxidation in the reduced form.2 Previous studies have demonstrated that topical CoQ10 application is effective in oxidative stress,3 photo protection4 and wound healing.5 However, large molecular weight (863 g/mol) and poor aqueous solubility (0.7 ng/mL) of CoQ10 limits its penetration through the skin.6
 | Figure 1 Chemical structures of CoQ10 and PTA. |
D-Panthenyl triacetate (PTA) is an oil-soluble derivative of D-panthenol (Figure 1), a precursor of pantothenic acid. In the epithelium, pantothenic acid is essential for synthesizing coenzyme A, a coenzyme responsible for carbohydrate, fatty acid and protein metabolism. D-Panthenol is being used extensively to increase cutaneous wound healing, and protect and repair the skin barrier through stimulation of lipid synthesis.7–9 PTA was found to slowly deacetylate into D-panthenol over 24 hours, acting as a reservoir inside the skin. Moreover, it was shown that PTA treatment results in significant stimulation of energetic pathways (glycolysis, citric acid cycle) and synthesis pathways (isoprenoids and lipid synthesis).10
Skin, the largest organ in the body, is composed of 3 layers: epidermis, dermis and hypodermis. Stratum corneum (SC), the outmost layer of the epidermis, is the rate-limiting barrier responsible for poor percutaneous absorption of most drugs.11 Delivery of active ingredients to deeper layers of the skin, mainly to fibroblasts found inside the dermis, is necessary for obtaining desired effect. Fibroblasts, the main skin cells, are an important target in antioxidant,12 photoaging13 and wound-healing14 applications. Nanoparticulate carrier systems, especially lipid-based carriers, are generally used to enhance penetration and overcome poor absorption problem of both hydrophilic and lipophilic compounds.
Liposomes are spherical vesicles composed of lipid bilayers formed around an aqueous core. This unique structure allows liposomes to encapsulate both hydrophilic and hydrophobic drugs.15,16 Usually, liposomes prepared with natural lipids can act as highly biocompatible and biodegradable drug delivery systems that decrease toxicity and increase therapeutic efficiency of the encapsulated drug. Liposomes have been investigated extensively over the years as potential carriers for different drugs, nucleic acids, imaging agents, peptides and proteins as well as cosmetic ingredients.17 Topically applied liposomes act as a local reservoir and allow sustained delivery of active ingredients. Moreover, liposomes protect encapsulated ingredients from external effects such as oxidation, light and hydrolysis, and may enhance permeation through deeper layers of the skin.18
Conventional formulation design involves changing a single factor at a time while maintaining other variables constant. This approach requires a large number of experiments for determining optimum levels, which takes considerable time and effort, eventually leading to increased development costs. Response surface methodology (RSM) is an efficient statistical model for formulation design, which investigates the interaction between different variables and their effects on different responses.19–21 This study aims to develop a liposomal formulation encapsulating both CoQ10 and PTA for the first time to enhance their skin penetration and provide controlled drug release. Also, a central composite design (CCD) was utilized for the purpose of formulation optimization. Liposomes were prepared by thin-film hydration method followed by extrusion through polycarbonate membrane filters. Moreover, physicochemical characteristics were determined, and in vitro drug release and stability studies were conducted on the optimized liposomal formulation.
Materials and methods
Materials
CoQ10 and cholesterol (Ch) were purchased from Sigma–Aldrich, Inc. (St Louis, MO, USA). Soy phosphatidylcholine (SPC) and mini-extruder were purchased from Avanti Polar Lipids, Inc. (Alabaster, AL, USA). PTA was obtained from Cosmer Cosmetic (Istanbul, Turkey). Filters were acquired from Sartorius (Göttingen, Germany). All solvents used in this study were of analytical grade and obtained from EMD Millipore (Billerica, MA, USA).
Liposome preparation
Liposomes were prepared by the thin-film hydration method.22 Briefly, SPC, Ch, CoQ10 and PTA were weighed at different ratios obtained from the experimental design and dissolved in 10 mL chloroform. The solution was transferred into a 250 mL round-bottomed flask, and the organic solvent was evaporated under a reduced pressure at 45°C and 100 rpm by a rotary evaporator (Heidolph, Schwabach, Germany). The resulting lipid film was dried overnight under a nitrogen gas flow to remove remaining traces of chloroform. The lipid film was hydrated with 10 mL phosphate-buffered saline (PBS; pH 7.4) by rotary evaporation at 45°C and 100 rpm without applying vacuum. For size reduction, liposomes were extruded 15 times through 200 nm pore-sized polycarbonate membranes (Whatman, Maidstone, UK) using the Avanti mini-extruder. The large unilamellar vesicles obtained were centrifuged at 3,000 g for 10 minutes in order to separate excess lipid and un-encapsulated drugs. Liposome formulations were maintained at 4°C and used within 3 days of preparation.
Analytical quantification of CoQ10 and PTA
Two different methods were employed for detecting CoQ10 and PTA in the liposomal formulations using RP-HPLC system (Shimadzu LC20-AT; Shimadzu, Kyoto, Japan) equipped with a UV–Vis detector (Shimadzu SPD-20A). Mobile phase consisted of acetonitrile:water (70:30, v/v) for PTA and acetonitrile:isopropanol (35:65, v/v) for CoQ10. The corresponding mobile phase was degassed and delivered isocratically at a flow rate of 1 mL/min through GL Sciences InertSustain C18 (150×4.6 mm, 5 μm) column maintained at 25°C. UV detector was set at 210 nm for PTA and 275 nm for CoQ10 detection.
Validation of HPLC methods for both PTA and CoQ10 was performed based on the International Conference of Harmonization (ICH) Q2 (R1) guidelines. Linearity was analyzed through standard curves in 0.1–10 μg/mL range prepared from stock solutions of PTA and CoQ10. Regression equation was found by plotting peak area (y) versus drug concentration (x). The results were found as y =7388x+476.08 for PTA with correlation coefficient r2=0.9996 and y =20083x+145.97 for CoQ10 with r2=0.9998. Intra-day and inter-day precision expressed as relative standard deviation (RSD) and accuracy results expressed as relative mean error were below 2% for all parameters. Recovery results were found as 98.77%±1.05%–100.89%±0.92% for PTA and 99.57%±0.54%–100.32%±0.76% for CoQ10.
Determination of encapsulation efficiency
Liposomal formulations were diluted (1:100) with acetonitrile and vortexed for 5 minutes to disrupt the structure. Prior to analysis, sample solutions were filtered through 0.22 μm PTFE filter and analyzed with the above-mentioned validated RP-HPLC method. Encapsulation efficiency (EE) was calculated for each drug from the following equation:
|

where Wd is the amount of encapsulated drug in the liposomes and Wi is the total quantity of drug initially added.
Experimental design
CoQ10- and PTA-loaded liposomes were optimized by the response surface methodology. According to preliminary studies and literature review, Ch/SPC (w/w, %), CoQ10/SPC (w/w, %) and PTA/SPC (w/w, %) were selected as 3 important factors. SPC concentration was kept constant (10 mg/mL) in all formulations. Three factors were studied at 5 different levels (−α, −1, 0, +1, +α) using a CCD. The α value of 1.68 was chosen to maintain rotatability and orthogonality of the design. Total 20 experiments were carried out with 8 factorial points, 6 axial points and 6 replications of the central point to improve precision of the method (Table 1). Response variables were chosen as EE of CoQ10 (EEQ) and EE of PTA (EEP).
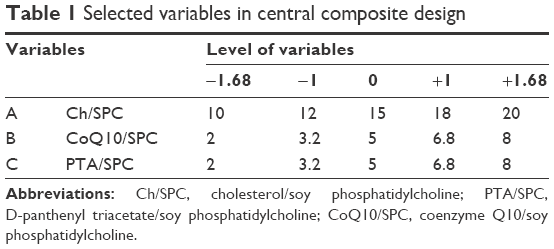 | Table 1 Selected variables in central composite design |
Design-Expert software (version 10.0.3.0; Stat-Ease, Inc., Minneapolis, MN, USA) was used for experiment design and statistical analysis. Response was predicted by the quadratic polynomial equation:
|
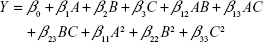
where Y is the predicted response; A, B and C are independent variables; β0 is the intercept; β1, β2 and β3 are linear coefficients; β12, β13 and β23 represent interaction coefficients; and β11, β22 and β33 represent quadratic coefficients.19
Analysis of variance (ANOVA) was performed to evaluate the effect of independent variables on the responses, and P<0.05 was considered to be statistically significant. Predicted (pred.) and adjusted (adj.) correlation coefficient (R2) was calculated to evaluate the fitness of model. Three-dimensional surface graphs were drawn to display the experimental region and effects of independent variables on the responses. Optimal responses were selected as maximum EE for both CoQ10 and PTA while maintaining the drug amounts as high as possible in the formulation. The optimized formulation was prepared in triplicate, and the obtained experimental results were compared to the predicted values.
Determination of particle size (PS), polydispersity index (PdI) and zeta potential (ZP)
PS and PdI of liposomes were determined by dynamic light scattering technique using Zetasizer Nano ZSP (Malvern Instruments Ltd, Malvern, UK). ZP was determined by laser Doppler micro-electrophoresis method by using a folded capillary zeta cell (Malvern Instruments Ltd). Prior to measurement, samples were diluted (1:20) with deionized water to reach phospholipid concentration of 0.5 mg/mL. All measurements were carried out at 25°C, and each sample was measured 3 times.
Liposome morphology
Scanning electron microscopy (SEM)
Liposomes were diluted (1:50) with deionized water, and a drop of formulation was placed on a glass slide, which was then dried at room temperature. Dried samples were sputter-coated with a thin layer of gold with a diameter of ~10 nm. Morphology of coated samples was analyzed by a scanning electron microscope (Carl Zeiss Evo 40; Carl Zeiss, Jena, Germany).
Transmission electron microscopy (TEM)
Liposomes were diluted (1:50) with deionized water, and 1 drop of the formulation was applied onto a carbon-coated copper grid. After drying and adhesion, samples were negatively stained by 2% phosphotungstic acid and analyzed with a 120-kV transmission electron microscope (FEI Tecnai G2 Spirit BioTwin; FEI Company, Hillsboro, OR, USA).
In vitro release study
In vitro drug release from optimized liposomes was studied using dialysis method in triplicate. Dialysis membranes (molecular weight cut-off 10 kDa) were immersed in distilled water at room temperature overnight to remove the preservative and rinsed thoroughly before the experiment. Liposomal formulation (2 mL) was carefully placed inside dialysis bag, which was then sealed tightly at both ends with standard closures. Dialysis bag was immersed in 100 mL of release medium containing PBS pH 7.4:acetonitrile:tween 80 (70:25:5, v/v/v) to ensure sink conditions. Analysis was carried out at 32°C±0.5°C and 100 rpm in a shaking incubator (Stuart SI500; Stuart, Stone, UK). Two-milliliter solutions of PTA (0.5 mg/mL) and CoQ10 (0.5 mg/mL) were also subjected to dialysis as controls using the above-mentioned method. At predetermined times (0.5, 1, 2, 4, 6, 8, 24 hours), 0.5 mL of sample was taken from the release medium, and an equal volume of fresh dissolution medium was immediately supplied to maintain constant volume. Samples were diluted with acetonitrile to 1 mL and analyzed by the RP-HPLC method described to determine the CoQ10 and PTA content. For evaluating drug release kinetics for both ingredients, zero-order,23 first-order,24 Higuchi root-square,25 Hixson–Crowell26 and Korsmeyer–Peppas27 mathematical models were used.
Stability studies
Stability of optimized liposomal formulation was evaluated during storage at 4°C and 25°C for 60 days. PS, PdI, ZP and EE for CoQ10 and PTA were measured as described. All measurements were done in triplicate. Drug leakage rate (LR) was calculated from the following equation for both ingredients:
|

where Wt is the amount of encapsulated drug after storage time and W0 is the initial amount of drug inside the liposomes.
Results and discussion
Experimental design
Design model and data analysis
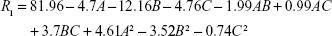
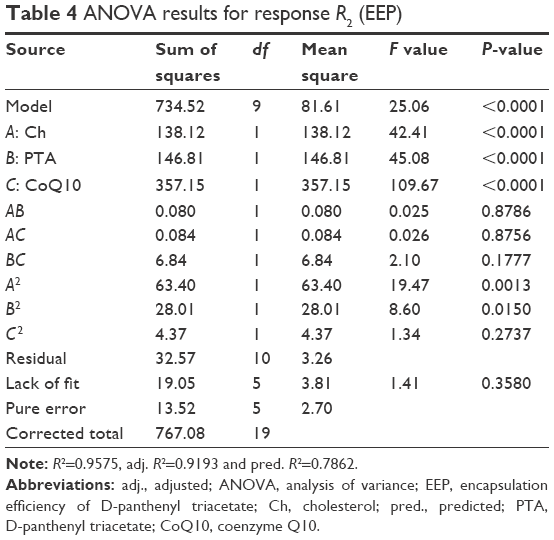
CCD setup and obtained responses from a total of 20 experiments are presented in Table 2. The following quadratic, second-order equation was used to predict the maximum EE for CoQ10:
|
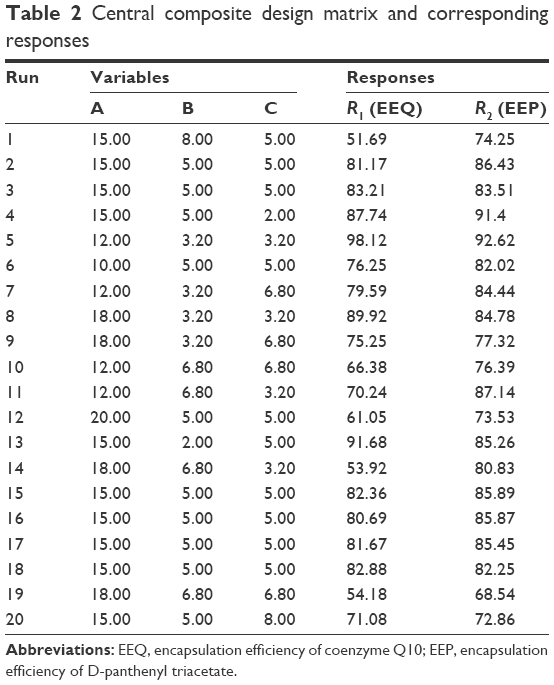 | Table 2 Central composite design matrix and corresponding responses |
where R1 is EEQ (%), while A, B and C are coded values for Ch/SPC, CoQ10/SPC and PTA/SPC weight ratios (%), respectively. Regression model was tested by ANOVA as presented for EEQ in Table 3. According to the results, a high F value (386.12) and a low P-value (<0.0001) indicated that the model equation was statistically significant. Lack-of-fit value of the model was statistically insignificant (P=0.546), which implies that the model fits well. Confidence level of the regression model was verified by a coefficient R2 value of 0.9971 that indicated 99.71% of variability in the response can be explained by this model. The pred. R2 value of 0.9876 is in close agreement with the adj. R2 value of 0.9945, which demonstrated high correlation between observed and the predicted values in this case.
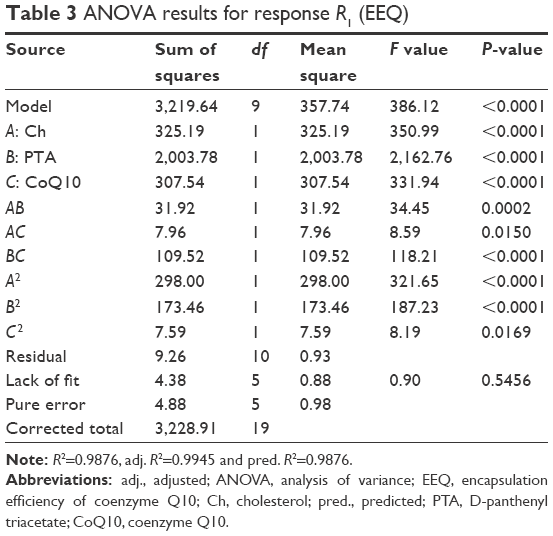 | Table 3 ANOVA results for response R1 (EEQ) |
The following second equation was used to predict the maximum EE for PTA:
|
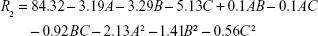
where R2 is EEP (%), while A, B and C are coded values for Ch/SPC, CoQ10/SPC and PTA/SPC weight ratios, respectively. The model F value (25.06) and low P-value (<0.0001) implied the significance of the model equation as displayed in Table 4. Lack of fit of the model (P=0.358) was not significant. According to the coefficient R2 value of 0.9578, 95.75% of variability in EEP could be explained by the model. There was a correlation between the adj. R2=0.9193 and the pred. R2=0.7862, which ensured predictability of the model as the difference is below 0.2.
 | Table 4 ANOVA results for response R2 (EEP) |
Optimization study
Optimum conditions were determined by Design-Expert software based on the obtained results from CCD study. Desired limits were set as maximized EE for both CoQ10 and PTA. It was also important to have an optimum amount of active ingredients in the formulation to achieve effective drug delivery. Therefore, CoQ10 and PTA amounts were marked as important independent variables. Three-dimensional surface plots for R1 (EEQ) as a function of PTA and Ch weight ratios at fixed CoQ10 content, CoQ10 and Ch weight ratios at fixed PTA content and CoQ10 and PTA weight ratios at fixed Ch content are presented in Figure 2A–C, respectively. Three-dimensional surface plots for R2 (EEP) as a function of PTA and Ch weight ratios at fixed CoQ10 content, CoQ10 and Ch weight ratios at fixed PTA content and CoQ10 and PTA weight ratios at fixed Ch content are presented in Figure 2D–F, respectively.
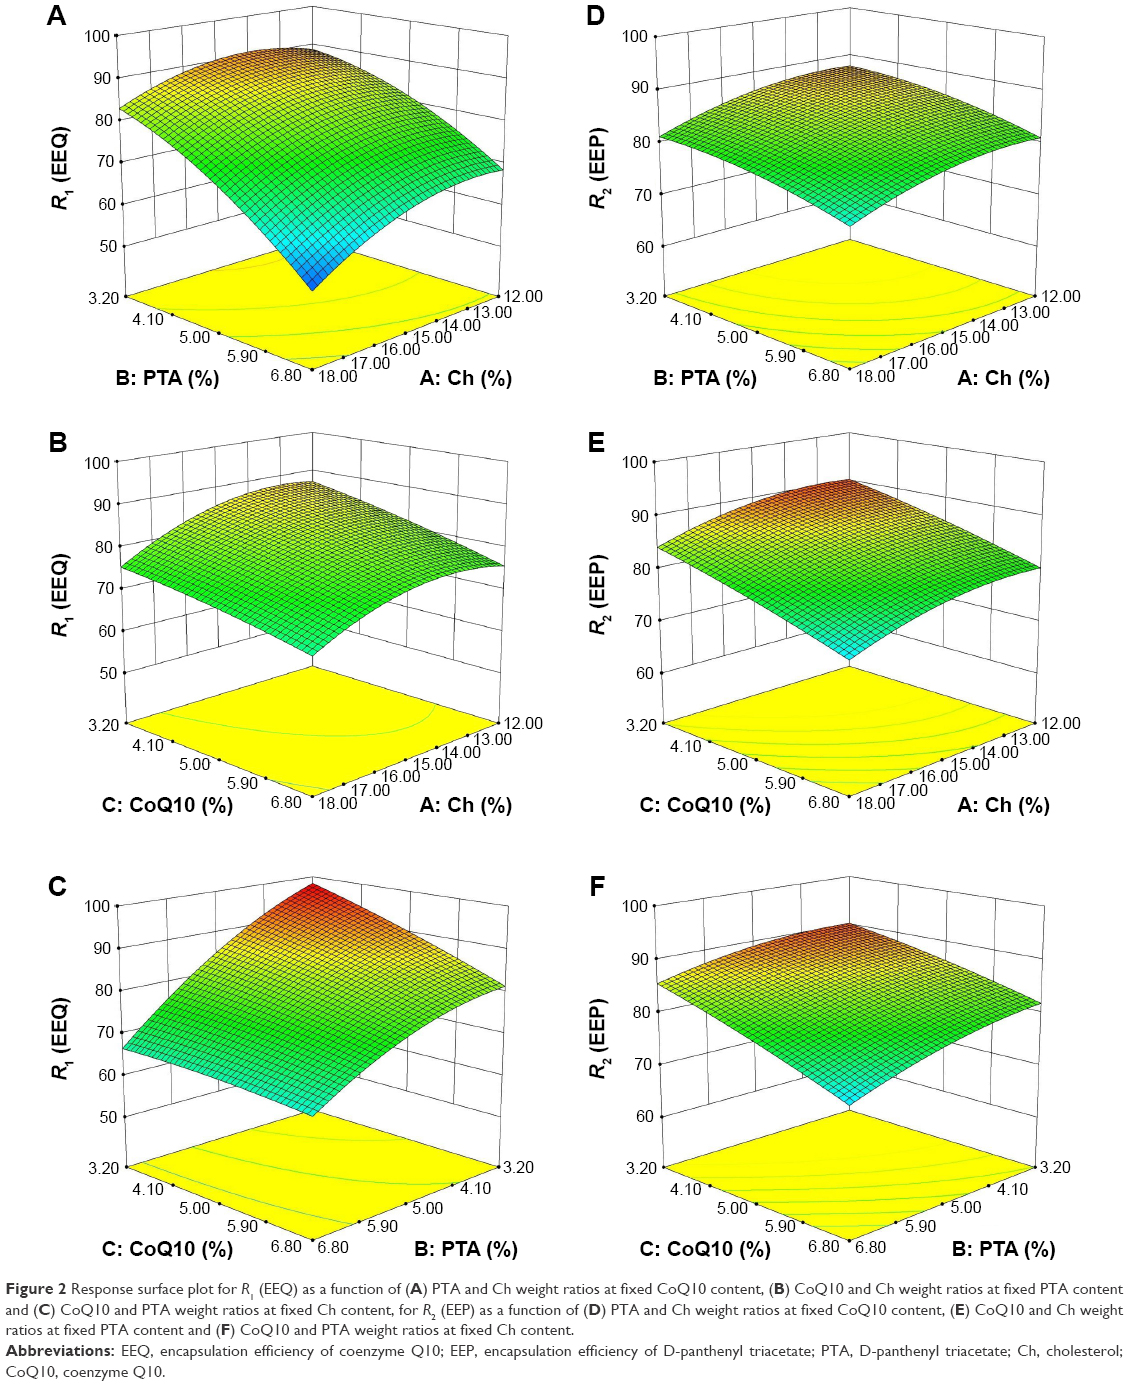 | Figure 2 Response surface plot for R1 (EEQ) as a function of (A) PTA and Ch weight ratios at fixed CoQ10 content, (B) CoQ10 and Ch weight ratios at fixed PTA content and (C) CoQ10 and PTA weight ratios at fixed Ch content, for R2 (EEP) as a function of (D) PTA and Ch weight ratios at fixed CoQ10 content, (E) CoQ10 and Ch weight ratios at fixed PTA content and (F) CoQ10 and PTA weight ratios at fixed Ch content. |
Figure 2C shows that a steeper surface was obtained, which indicates that the PTA amount in the formulation was the main factor affecting EEQ value. Similarly, the CoQ10 amount in the formulation was the most significant factor for EEP as seen in Figure 2F. Ch acts as a stabilizing agent that reduces the permeability of liposomal bilayer by decreasing the flexibility of phospholipid chains, leading to an increased physical stability. Ch also enhances hydrophobicity of the bilayer, which results in increased affinity and loading of lipophilic drugs.19,28 This phenomenon can be observed clearly in Figure 2A as an increase in Ch content resulted in increased EEQ until a critical value near 14% was reached. Higher values led to a decrease in EEQ possibly due to the limited space in the hydrophobic region of the lipid bilayer. Increased PTA and CoQ10 content in the formulation also negatively affected the EE of each other as expected.
Coded variables for optimized formulation were found as A=13.95, B=4.17 and C=4.22. The optimized formulation was prepared in triplicate to evaluate the model accuracy for the optimum conditions. Optimized liposomal formulation incorporated 381 μg/mL of CoQ10 and 376 μg/mL of PTA, based on EE results. Predicted and experimental responses for optimized variables are presented in Table 5. Observed experimental values were in close agreement with the predicted values (RSD <2%). Coordination between the results indicated the significance and validity of the model. Previous studies demonstrated that increase in lipophilic character (log P) also resulted in an increased EE due to the higher affinity of drug molecules to the lipids inside the bilayer structure.29–31 Moreover, an EE >90% for CoQ10 was achieved by other studies with comparable results.32,33
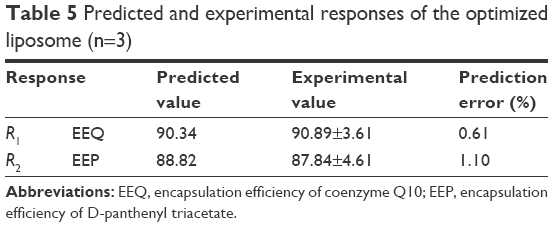 | Table 5 Predicted and experimental responses of the optimized liposome (n=3) |
PS, PdI, ZP and morphology
PS, PdI and ZP measurements were conducted for all liposomal formulations prepared for studying the experimental design. The size distribution was found to be between 155.3 and 186.6 nm, while PdI of these liposomes was below 0.3, suggesting narrow size distribution and uniform particle formation. ZP results varied between −6.96 and −8.35 mV, which indicate a slight negative charge on the liposomal surface. As shown in Figure 3, spherical structure and smooth surface of the optimized liposome was confirmed with SEM and TEM analyses.
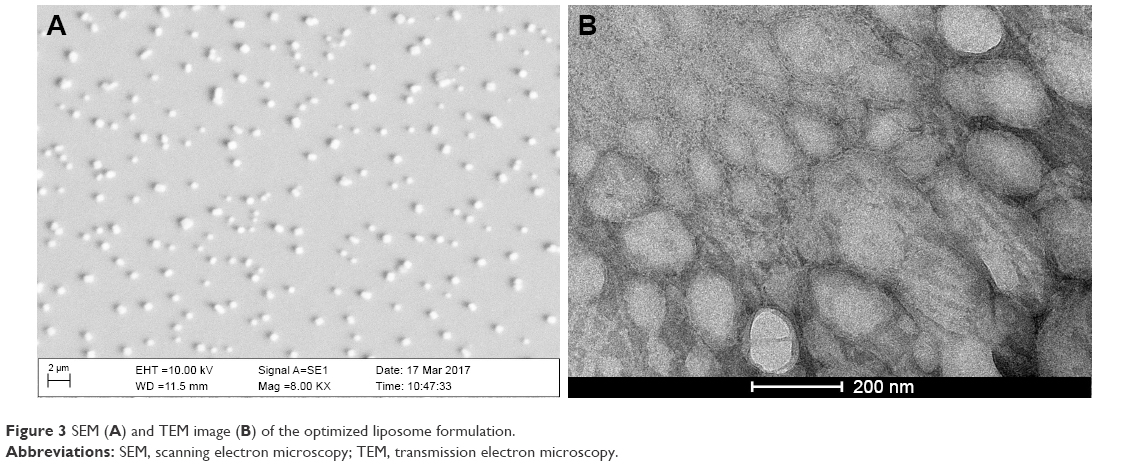 | Figure 3 SEM (A) and TEM image (B) of the optimized liposome formulation. |
PS is an important parameter for topical delivery and investigated by different research groups to determine its optimum range. Generally, it was concluded that smaller PS did not correspond to higher permeation and particles below 200 nm were sufficient for delivery to deeper layers.11,34,35 In a recent study, it was shown that liposomes were shown to not penetrate below 5 μm in the SC; rather, they fused with the lipid layer inside the skin and released their cargo.36 Moreover, extrusion method in liposome preparation is known to produce monodisperse particles, and PS is adjustable depending on the membrane pore size. For these reasons, PS and PdI parameters were not investigated thoroughly during the optimization study. PS of the optimized formulation was measured as 161.6±3.6 nm with PdI of 0.106±0.013, and the particles displayed ZP of −7.59±0.91 mV. The obtained results indicate that the optimized formulation had narrow size distribution and reproducible particle characteristics.
In vitro release study
In vitro release profile of the optimized liposomes coencapsulating CoQ10 and PTA was obtained as shown in Figure 4. According to the results, an initial burst release of 9.4% for CoQ10 and 42.7% for PTA occurred in the first 2 hours followed by a second slower release phase. Lipophilic drugs were found to be positioned inside the bilayer structure or the surface and outer lamellae of the liposomes. The initial release is generally attributed to drug detachment from the surface, while the second slower release phase results from the sustained release of the lipophilic drug trapped inside the bilayer structure and inner lamellae.19,37 After 24 hours, a cumulative release of 90.93%±3.97% for PTA and 24.41%±2.98% for CoQ10 was achieved. High lipophilic character of CoQ10 (log P>10) causes the molecule to position itself in the interior of the bilayer structure, leading to an increased affinity towards the phospholipid bilayer. In the presence of long-chain fatty acids, CoQ10 is easily miscible and places itself either completely parallel to the fatty acid chains or in a folded conformation similar to a sterol structure.38–40 This positioning of the molecule may be the reason for slower release profile. The results are consistent with a previous study by Zhao et al that reported an ~20% release over 24 hours from CoQ10-loaded liposomes.33 In the case of PTA, faster release can be attributed to the possible positioning of the molecule near the polar head group of SPC in the liposome membrane.
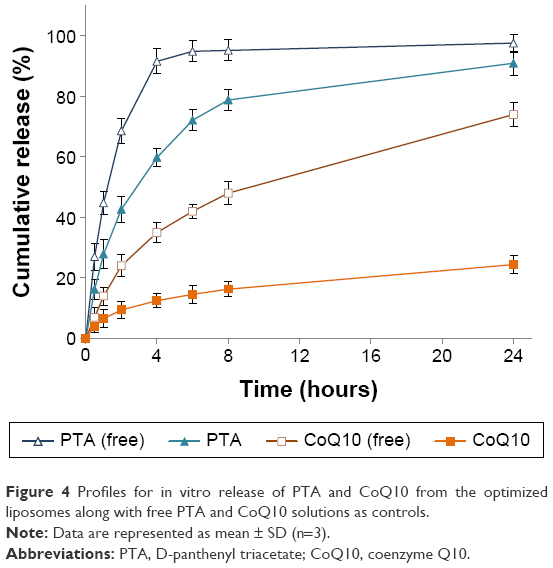 | Figure 4 Profiles for in vitro release of PTA and CoQ10 from the optimized liposomes along with free PTA and CoQ10 solutions as controls. |
In vitro release data obtained for both PTA and CoQ10 were fitted to different models to analyze drug release mechanism. Correlation coefficients (r2) and release kinetic constants (k) obtained for each model are presented in Table 6. PTA showed a good fit to the first-order kinetics (r2=0.9923), indicating that the release rate of drug is dependent on the drug concentration. On the other hand, CoQ10 followed the Higuchi model (r2=0.9883), which assumes drug release is achieved primarily by diffusion. According to Korsmeyer–Peppas model, PTA displayed non-Fickian (anomalous) transport kinetics (0.43≤n<0.85), which means coupled diffusion and erosion-based mechanism. The n value being closer to 0.43 and also a linear fit to the Higuchi model (r2=0.9834) suggests that diffusion is the predominant mechanism of drug release. In the case of CoQ10, Fickian diffusion was the predominant mechanism of drug release from the liposomes (n≤0.43). Differences in release kinetics may occur depending on the physicochemical properties and the localization of drugs inside the bilayer structure. In another study, Mohan et al prepared liposomal formulations of resveratrol (Res) and 5-fluorouracil (5-FU) and investigated their drug release mechanisms. They reported that 5-FU followed zero-order release kinetics, while Res followed the Higuchi model of diffusion.41 Similar results have been reported in other studies with different nanoparticle formulations.42,43
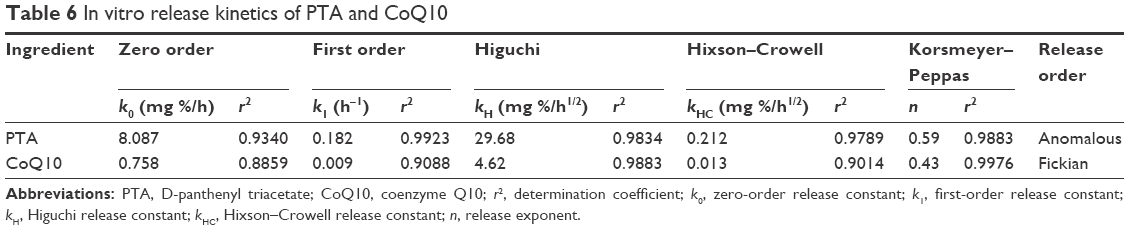 | Table 6 In vitro release kinetics of PTA and CoQ10 |
Stability studies
PS, PdI, EEQ and EEP changes during 60 days of storage time are listed in Table 7. PS, EEQ and EEP results obtained after 60 days at 4°C and 25°C along with production day parameters are also presented in Figure 5. PS and PdI remained unchanged during storage time at 4°C, while significant increase in both parameters was observed at 25°C (P<0.05). Change in PS and PdI may be caused by increased liposome fusion and aggregation at 25°C, while storage at 4°C decreased fluidity of the bilayer structure and inhibited the particle fusion.15 ZP measurements were close to the initial value of −7.62±0.69 mV at both temperatures during storage time (P>0.05). For this reason, ZP results are not listed in Table 6. There was a significant decrease in EEQ at 25°C with a CoQ10 leakage of 25.09%, compared to 10.77% at 4°C after storage time. Changes in EEP values were more dramatic, as the LRs were 26.87% at 4°C and 50.28% at 25°C. Accelerated hydrolysis and oxidation of lipids at 25°C compared to 4°C may be the cause of increased drug leakage and decreased EE. The more lipophilic character of CoQ10 compared to PTA may result in higher retention inside the bilayer during storage period.32,33 These findings are also compatible with the results obtained previously from the in vitro release study, wherein PTA was released at a faster and higher rate compared to CoQ10.
 | Table 7 Stability of the optimized liposome formulation at 4°C and 25°C during 60 days (n=3) |
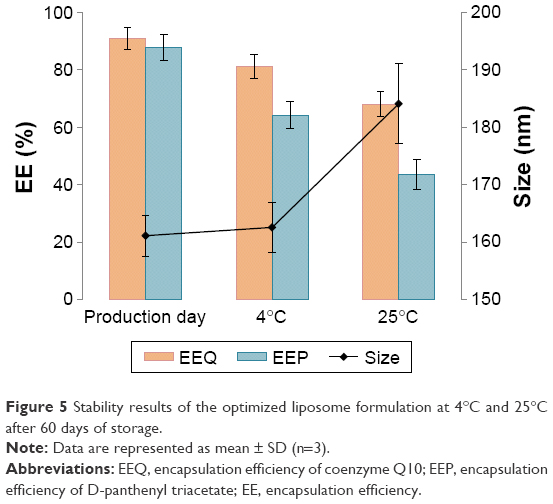 | Figure 5 Stability results of the optimized liposome formulation at 4°C and 25°C after 60 days of storage. |
Conclusion
In this study, liposomal formulations containing PTA and CoQ10 were successfully prepared for the first time and optimized to achieve high EE% and drug loading using RSM. Liposomes were prepared by thin-film hydration followed by membrane extrusion. PS, PdI and ZP results of the optimized liposomes were satisfactory for topical delivery of active ingredients. Furthermore, SEM and TEM images confirmed spherical structure and uniform size distribution. In vitro release profiles demonstrated a faster release of PTA compared to CoQ10 from the liposomal formulation. Storage temperature was an important factor for liposome stability, as significant leakage of both ingredients was seen at 25°C. Liposomes were found to be stable for 60 days at a storage temperature of 4°C. Thus, it can be concluded that encapsulating both PTA and CoQ10 is a promising way for prolonged effect and simultaneous delivery of both ingredients. Based on these findings, the possible effects on wound-healing mechanism of our optimized liposomal formulation will be further investigated in cell culture studies.
Acknowledgments
This study was supported by Bezmialem Vakif University Research Fund (project no: 12.2015/31). The TEM analysis was conducted at Middle East Technical University Central Laboratory.
Disclosure
The authors report no conflicts of interest in the work.
References
Lee WC, Tsai TH. Preparation and characterization of liposomal coenzyme Q10 for in vivo topical application. Int J Pharm. 2010;395(1–2):78–83. | ||
Bentinger M, Tekle M, Dallner G. Coenzyme Q – biosynthesis and functions. Biochem Biophys Res Commun. 2010;396(1):74–79. | ||
Gokce EH, Korkmaz E, Tuncay-Tanriverdi S, et al. A comparative evaluation of coenzyme Q10-loaded liposomes and solid lipid nanoparticles as dermal antioxidant carriers. Int J Nanomedicine. 2012;7:5109–5117. | ||
Yue Y, Zhou H, Liu G, Li Y, Yan Z, Duan M. The advantages of a novel CoQ10 delivery system in skin photo-protection. Int J Pharm. 2010;392(1–2):57–63. | ||
Choi BS, Song HS, Kim HR, et al. Effect of coenzyme Q10 on cutaneous healing in skin-incised mice. Arch Pharm Res. 2009;32(6):907–913. | ||
Teeranachaideekul V, Souto EB, Junyaprasert VB, Muller RH. Cetyl palmitate-based NLC for topical delivery of Coenzyme Q10 – development, physicochemical characterization and in vitro release studies. Eur J Pharm Biopharm. 2007;67(1):141–148. | ||
Ebner F, Heller A, Rippke F, Tausch I. Topical use of dexpanthenol in skin disorders. Am J Clin Dermatol. 2002;3(6):427–433. | ||
Heise R, Skazik C, Marquardt Y, et al. Dexpanthenol modulates gene expression in skin wound healing in vivo. Skin Pharmacol Physiol. 2012;25(5):241–248. | ||
Camargo FB Jr, Gaspar LR, Maia Campos PM. Skin moisturizing effects of panthenol-based formulations. J Cosmet Sci. 2011;62(4):361–370. | ||
Dell’Acqua G, Schweikert K. Panthenyl triacetate transformation, stimulation of metabolic pathways, and wound-healing properties in the human skin. J Cosmet Sci. 2012;63(1):1–13. | ||
Prow TW, Grice JE, Lin LL, et al. Nanoparticles and microparticles for skin drug delivery. Adv Drug Deliv Rev. 2011;63(6):470–491. | ||
Bickers DR, Athar M. Oxidative stress in the pathogenesis of skin disease. J Invest Dermatol. 2006;126(12):2565–2575. | ||
Duval C, Cohen C, Chagnoleau C, Flouret V, Bourreau E, Bernerd F. Key regulatory role of dermal fibroblasts in pigmentation as demonstrated using a reconstructed skin model: impact of photo-aging. PLoS One. 2014;9(12):e114182. | ||
Bainbridge P. Wound healing and the role of fibroblasts. J Wound Care. 2013;22(8):407–408, 410–412. | ||
Panwar P, Pandey B, Lakhera PC, Singh KP. Preparation, characterization, and in vitro release study of albendazole-encapsulated nanosize liposomes. Int J Nanomedicine. 2010;5:101–108. | ||
Li Z, Liu M, Wang H, Du S. Increased cutaneous wound healing effect of biodegradable liposomes containing madecassoside: preparation optimization, in vitro dermal permeation, and in vivo bioevaluation. Int J Nanomedicine. 2016;11:2995–3007. | ||
Torchilin VP. Recent advances with liposomes as pharmaceutical carriers. Nat Rev Drug Discov. 2005;4(2):145–160. | ||
Akbarzadeh A, Rezaei-Sadabady R, Davaran S, et al. Liposome: classification, preparation, and applications. Nanoscale Res Lett. 2013;8(1):102. | ||
Ravar F, Saadat E, Kelishadi PD, Dorkoosh FA. Liposomal formulation for co-delivery of paclitaxel and lapatinib, preparation, characterization and optimization. J Liposome Res. 2016;26(3):175–187. | ||
Wang H, Liu M, Du S. Optimization of madecassoside liposomes using response surface methodology and evaluation of its stability. Int J Pharm. 2014;473(1–2):280–285. | ||
Ge Y, Ge M. Development of tea tree oil-loaded liposomal formulation using response surface methodology. J Liposome Res. Epub 2015 Mar 23. | ||
Cho NJ, Hwang LY, Solandt JJR, Frank CW. Comparison of extruded and sonicated vesicles for planar bilayer self-assembly. Materials. 2013;6(8):3294–3308. | ||
Varelas CG, Dixon DG, Steiner CA. Zero-order release from biphasic polymer hydrogels. J Control Release. 1995;34(3):185–192. | ||
Wagner JG. Interpretation of percent dissolved-time plots derived from in vitro testing of conventional tablets and capsules. J Pharm Sci. 1969;58(10):1253–1257. | ||
Higuchi T. Rate of release of medicaments from ointment bases containing drugs in suspension. J Pharm Sci. 1961;50(10):874–875. | ||
Hixson AW, Crowell JH. Dependence of reaction velocity upon surface and agitation. Ind Eng Chem. 1931;23(8):923–931. | ||
Korsmeyer RW, Gurny R, Doelker E, Buri PA, Peppas NA. Mechanisms of solute release from porous hydrophilic polymers. Int J Pharm. 1983;15(1):25–35. | ||
Mohammed AR, Weston N, Coombes AGA, Fitzgerald M, Perrie Y. Liposome formulation of poorly water soluble drugs: optimisation of drug loading and ESEM analysis of stability. Int J Pharm. 2004;285(1–2):23–34. | ||
Kita K, Dittrich C. Drug delivery vehicles with improved encapsulation efficiency: taking advantage of specific drug–carrier interactions. Expert Opin Drug Deliv. 2011;8(3):329–342. | ||
Jaafar-Maalej C, Diab R, Andrieu V, Elaissari A, Fessi H. Ethanol injection method for hydrophilic and lipophilic drug-loaded liposome preparation. J Liposome Res. 2010;20(3):228–243. | ||
Nii T, Ishii F. Encapsulation efficiency of water-soluble and insoluble drugs in liposomes prepared by the microencapsulation vesicle method. Int J Pharm. 2005;298(1):198–205. | ||
Xia S, Xu S, Zhang X. Optimization in the preparation of coenzyme Q10 nanoliposomes. J Agric Food Chem. 2006;54(17):6358–6366. | ||
Zhao GD, Sun R, Ni SL, Xia Q. Development and characterisation of a novel chitosan-coated antioxidant liposome containing both coenzyme Q10 and alpha-lipoic acid. J Microencapsul. 2015;32(2):157–165. | ||
Kuchler S, Abdel-Mottaleb M, Lamprecht A, Radowski MR, Haag R, Schafer-Korting M. Influence of nanocarrier type and size on skin delivery of hydrophilic agents. Int J Pharm. 2009;377(1–2):169–172. | ||
Verma DD, Verma S, Blume G, Fahr A. Particle size of liposomes influences dermal delivery of substances into skin. Int J Pharm. 2003;258(1–2):141–151. | ||
Dreier J, Sorensen JA, Brewer JR. Superresolution and fluorescence dynamics evidence reveal that intact liposomes do not cross the human skin barrier. PLoS One. 2016;11(1):e0146514. | ||
Briuglia ML, Rotella C, McFarlane A, Lamprou DA. Influence of cholesterol on liposome stability and on in vitro drug release. Drug Deliv Transl Res. 2015;5(3):231–242. | ||
Grzybek M, Stebelska K, Wyrozumska P, et al. ESR and monolayer study of the localization of coenzyme Q10 in artificial membranes. Gen Physiol Biophys. 2005;24(4):449–460. | ||
Samorì B, Lenaz G, Battino M, Marconi G, Domini I. On coenzyme Q orientation in membranes: a linear dichroism study of ubiquinones in a model bilayer. J Membr Biol. 1992;128(3):193–203. | ||
Lenaz G, Samori B, Fato R, Battino M, Parenti Castelli G, Domini I. Localization and preferred orientations of ubiquinone homologs in model bilayers. Biochem Cell Biol. 1992;70(6):504–514. | ||
Mohan A, Narayanan S, Sethuraman S, Krishnan UM. Novel resveratrol and 5-fluorouracil coencapsulated in PEGylated nanoliposomes improve chemotherapeutic efficacy of combination against head and neck squamous cell carcinoma. Biomed Res Int. 2014;2014:14. | ||
Kaur G, Mehta SK, Kumar S, Bhanjana G, Dilbaghi N. Coencapsulation of hydrophobic and hydrophilic antituberculosis drugs in synergistic Brij 96 microemulsions: a biophysical characterization. J Pharm Sci. 2015;104(7):2203–2212. | ||
Maruyama CR, Guilger M, Pascoli M, et al. Nanoparticles based on chitosan as carriers for the combined herbicides imazapic and imazapyr. Sci Rep. 2016;6:19768. |
 © 2017 The Author(s). This work is published and licensed by Dove Medical Press Limited. The
full terms of this license are available at https://www.dovepress.com/terms
and incorporate the Creative Commons Attribution
- Non Commercial (unported, 3.0) License.
By accessing the work you hereby accept the Terms. Non-commercial uses of the work are permitted
without any further permission from Dove Medical Press Limited, provided the work is properly
attributed. For permission for commercial use of this work, please see paragraphs 4.2 and 5 of our Terms.
© 2017 The Author(s). This work is published and licensed by Dove Medical Press Limited. The
full terms of this license are available at https://www.dovepress.com/terms
and incorporate the Creative Commons Attribution
- Non Commercial (unported, 3.0) License.
By accessing the work you hereby accept the Terms. Non-commercial uses of the work are permitted
without any further permission from Dove Medical Press Limited, provided the work is properly
attributed. For permission for commercial use of this work, please see paragraphs 4.2 and 5 of our Terms.