Back to Journals » Clinical Interventions in Aging » Volume 13
Current perspective for tube feeding in the elderly: from identifying malnutrition to providing of enteral nutrition
Authors Mundi MS ![]() , Patel J, McClave SA, Hurt RT
, Patel J, McClave SA, Hurt RT
Received 19 October 2017
Accepted for publication 18 April 2018
Published 1 August 2018 Volume 2018:13 Pages 1353—1364
DOI https://doi.org/10.2147/CIA.S134919
Checked for plagiarism Yes
Review by Single anonymous peer review
Peer reviewer comments 3
Editor who approved publication: Dr Richard Walker
Manpreet S Mundi,1 Jayshil Patel,2 Stephen A McClave,3 Ryan T Hurt3–5
1Division of Endocrinology, Diabetes, Metabolism, and Nutrition, Mayo Clinic, Rochester, MN, USA; 2Division of Pulmonary, Critical Care & Sleep Medicine, Medical College of Wisconsin, Milwaukee, WI, USA; 3Division of Gastroenterology, Hepatology and Nutrition, University of Louisville, Louisville, KY, USA; 4Division of General Internal Medicine, Mayo Clinic, Rochester, MN, USA; 5Division of Gastroenterology and Hepatology, Mayo Clinic, Rochester, MN, USA
Abstract: With the number of individuals older than 65 years expected to rise significantly over the next few decades, dramatic changes to our society and health care system will need to take place to meet their needs. Age-related changes in muscle mass and body composition along with medical comorbidities including stroke, dementia, and depression place elderly adults at high risk for developing malnutrition and frailty. This loss of function and decline in muscle mass (ie, sarcopenia) can be associated with reduced mobility and ability to perform the task of daily living, placing the elderly at an increased risk for falls, fractures, and subsequent institutionalization, leading to a decline in the quality of life and increased mortality. There are a number of modifiable factors that can mitigate some of the muscle loss elderly experience especially when hospitalized. Due to this, it is paramount for providers to understand the pathophysiology behind malnutrition and sarcopenia, be able to assess risk factors for malnutrition, and provide appropriate nutrition support. The present review describes the pathophysiology of malnutrition, identifies contributing factors to this condition, discusses tools to assess nutritional status, and proposes key strategies for optimizing enteral nutrition therapy for the elderly.
Keywords: sarcopenia, home enteral nutrition, elderly, malnutrition, protein
Introduction
Advancements in health care have contributed to longevity. The number of individuals aged ≥60 years is expected to rise from 800 million to 2 billion, reaching 22% of the total world population over the next 40 years.1 Despite being the healthiest group in human history (average life expectancy for someone in their sixties is now longer by >16 years in many developed countries), the elderly are a heterogeneous group, with a high prevalence of malnutrition, sarcopenia, and frailty.2 In addition, the elderly have an increased risk for comorbid conditions, such as stroke, dementia, cancer, and heart disease, that predispose them to develop malnutrition.3,4 The prevalence of nutritional deficiency in the elderly is 15% in ambulatory outpatients, 25%–60% in institutionalized patients, and 35%–65% in hospitalized patients.5–7 In order to meet the nutritional needs of this population, health care providers will require skills for recognizing and managing malnutrition. This narrative review describes the pathophysiology of malnutrition, its contributing factors, tools by which to assess the condition, and options for maximizing enteral nutrition (EN) in the elderly.
Pathophysiology of malnutrition and sarcopenia in the elderly
Frailty is defined as a clinically recognizable state of increased vulnerability from aging-associated decline in reserve and function across multiple physiological systems such that the ability to cope with acute stressors is comprised (Table 1).8 Elderly individuals are at the greatest risk of developing frailty due to a number of age-related physiological and functional changes. Loss of function and decline in muscle mass (ie, sarcopenia) can be associated with reduced physical mobility and ability to perform tasks of daily living, which place the elderly at an increased risk for falls, fractures, and subsequent institutionalization, leading to a decline in the quality of life and increased mortality.9,10 Muscle loss typically begins in the fifth decade of life and proceeds at a rate of ~0.8% loss per year. Muscle loss precedes declines in muscle force and performance.11,12 An estimated 200 million people worldwide will acquire sarcopenia by the year 2050, making it paramount that we address it during every patient encounter.
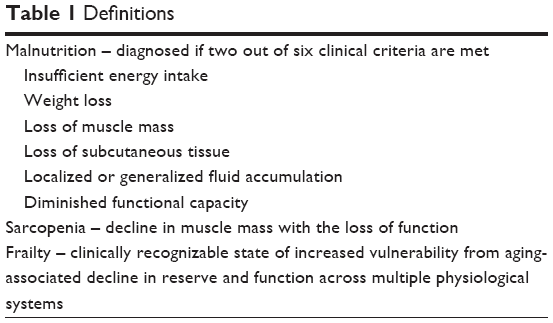 | Table 1 Definitions |
The etiology of sarcopenia is multifactorial, with two key modifiable factors being physical inactivity and reduced dietary protein intake. As an example, a single episode of resistance training can lead to an increase in muscle protein synthesis (MPS) that persists up to 48 hours.13 On the other hand, a 2-week reduction in physical activity (~76% reduction in habitual step count) can result in a 26% attenuation of MPS and reduction in muscle mass.14 Similarly, increasing dietary protein enhances MPS through an anabolic response via feeding, leading to a 300% increase in the rate of MPS and a 50% reduction in muscle protein breakdown (MPB).15–17 The increase in MPS returns to preprotein intake levels soon afterward, despite there being increased availability of plasma and muscle amino acids. Mammalian target of rapamycin complex 1 (mTORc1) may play a key signaling role for protein synthesis. In one study, a rising MPS rate was associated with mTORc1 substrate phosphorylation in eight healthy men provided 48 g of whey protein.16 On the contrary, administration of rapamycin (specific inhibitor of mTORc1) reduces both MPS and activation of mTORc1 signaling proteins during essential amino acid (EAA) administration.18
Aging reduces MPS response, a phenomenon termed anabolic resistance. Moore et al19 showed that although there was no difference in baseline MPS rates between young and elderly healthy subjects, the quantity of protein intake to maximally stimulate MPS was 68% greater in the elderly, as compared with younger subjects when expressed relative to total body mass and 140% higher when expressed relative to lean body mass. The maximum MPS rate was similar between young and healthy elderly subjects, suggesting that healthy elderly subjects had retained MPS capability under the optimal protein dose. Other factors associated with anabolic resistance include a decrease in physical activity, an increase in splanchnic first-pass amino acid extraction (or sequestration), chronic subclinical inflammation, and dysregulation of intracellular signaling.14,19–22
Risk factors for the development of malnutrition and sarcopenia
Dysphagia, or difficulty in swallowing, contributes significantly to the development of malnutrition in the elderly (Table 2). Studies report 13%–38% of elderly living independently may have dysphagia.3,23 The prevalence of dysphagia is higher in elderly patients admitted to the hospital (30%), after a stroke (64%), and in nursing home residents (68%).24–26 The etiology of dysphagia is multifactorial and includes age-related changes in muscle function and predisposing (acquired) conditions, such as stroke and dementia. Age-related decreases in muscle mass and connective tissue elasticity may lead to subtle slowing of the swallowing process with a reduction in the efficiency of swallowed materials passing through the upper digestive tract.27 These processes contribute to an increased frequency of postswallow residue as well as penetration of unswallowed content into the upper airway. Although physiology studies suggest altered function of the gastrointestinal tract with aging, the elderly should not experience dysphagia based solely on aging alone in the absence of a disease process. Dysphagia is particularly common after a stroke, with estimates suggesting that 30%–65% of patients are acutely affected, and many have persistent swallowing difficulties after 6 months.3,28 The combination of dysphagia and stroke limits volitional macro- and micronutrient intakes, which increase the risk of malnutrition.29
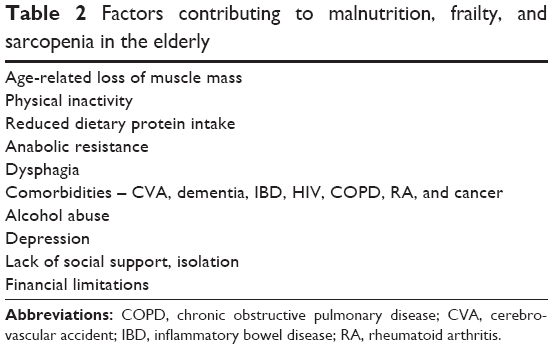 | Table 2 Factors contributing to malnutrition, frailty, and sarcopenia in the elderly |
Dementia is another major risk factor for malnutrition (Table 2). The prevalence of dementia increases from 2%–3% in those aged 70–75 years to 20%–25% in those aged ≥85 years.30 The prevalence of dementia is estimated to double by year 2040, with 81 million people being affected.31 Dysphagia is present in up to 45% of patients with dementia. Dementia-related cognitive and motor deficits and subsequent difficulties in self-feeding and loss of appetite contribute to malnutrition.3,32,33
In addition, a number of disease processes contribute to malnutrition and sarcopenia (Table 2). Examples include inflammatory bowel disease, human immunodeficiency virus or acquired immunodeficiency syndrome, chronic obstructive pulmonary disease (COPD), rheumatoid arthritis, alcohol abuse, and cancer (especially when associated with cachexia). Cachexia is a complex metabolic condition associated with systemic inflammation from an underlying illness and can be associated with a significant loss of muscle mass with or without loss of fat mass.34 Although the exact inflammatory mechanism is not known, increased circulating levels of interleukin-6 (IL-6) and tumor necrosis factor have been implicated. The systemic inflammation that accompanies cachexia seems to selectively target skeletal muscle, often leading to exaggerated or accelerated loss of skeletal muscle, which is mechanistically different from weight loss associated with malnutrition.34,35
Psychosocial conditions are just as important for the development and management of malnutrition. Psychosocial pathology contributes to the development of malnutrition, and psychosocial pathology management plays a key role in the successful implementation of nutrition support. Careful assessments should be made for factors that can interfere with the acquisition and provision of EN, including lack of social support, financial limitations, and depression.36–38 Social isolation and poor finances can have a substantial impact on elderly meal consumption. One study showed that meals consumed in an elderly group setting were 75% greater than meals consumed alone.36 For elderly patients without volitional intake requiring EN, cultural and personal perceptions of “artificial” nutrition should be identified and clarified to promote enteral feeding.39
Assessment for malnutrition
Defining malnutrition
The biggest challenge associated with assessment for malnutrition is agreement upon the definition of malnutrition and which clinical variables are the most important for its identification (Table 3).36,40 Despite expert disagreement, nutrition societies including the American Society for Parenteral and Enteral Nutrition (ASPEN) and the Academy of Nutrition and Dietetics (AND) have developed a consensus statement defining malnutrition based on several causal factors and taking into consideration acute and chronic illnesses.41 ASPEN and AND categorize malnutrition as either moderate or severe while acknowledging the difficulty differentiating mild from moderate degrees of malnutrition. Guidelines recommend a diagnosis of malnutrition if two of the following six clinical criteria are met (Table 1): 1) insufficient energy intake, 2) weight loss, 3) loss of muscle mass, 4) loss of subcutaneous fat, 5) localized or generalized fluid accumulation, and 6) diminished functional capacity determined by handgrip dynometry.
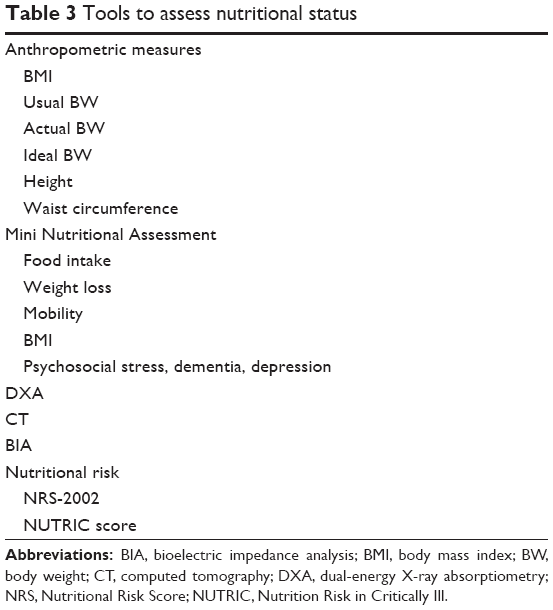 | Table 3 Tools to assess nutritional status |
Hospital-based assessment of nutritional risk
Critically ill patients are at particular risk for malnutrition. Not all critically ill patients are alike, and it is also important to identify which patients may benefit from aggressive nutrition support. A number of validated risk scores have been developed and validated to identify the “nutritional risk” in the critically ill, which is the risk of acquiring complications as a consequence of insufficient nutrition. One tool is the Nutrition Risk in Critically Ill (NUTRIC) scoring system, which uses the following six variables to calculate a risk score: age, Acute Physiology and Chronic Health Evaluation (APACHE) II, Sequential Organ Failure Assessment, number of comorbidities, days from hospital to intensive care unit (ICU) admission, and IL-6 level.42 The NUTRIC score ranges from 0 to 10 points, with scores between 6 and 10 being associated with an increased risk for adverse outcomes (mainly mortality) and associated with improvement with aggressive nutrition therapy, as compared with lower scores. The difficulty obtaining IL-6 levels at most institutions called for the development of a modified NUTRIC score, which has been revalidated (without IL-6) and has shown that the odds of mortality at 28 days were 1.4 times greater for every point increase in the score.43 NUTRIC score ≥5 with nutritional adequacy was associated with improved 28-day and 6-month mortalities, as compared with those with NUTRIC ≥5 and nutritional inadequacy (Table 4). In fact, for patients with a NUTRIC score of 6–9, each 25% increase in the percentage of caloric prescription achieved was associated with a reduced hazard rate (HR) of death (0.82).
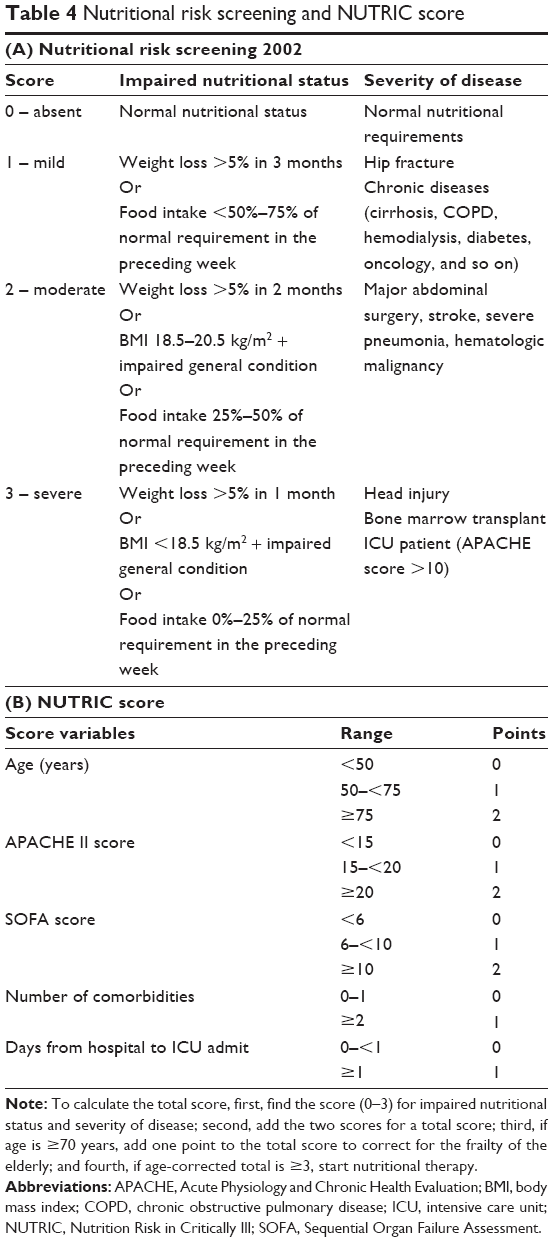 | Table 4 Nutritional risk screening and NUTRIC score |
The Nutrition Risk Score (NRS)-2002 is another nutritional risk assessment tool and has been validated in multiple populations including hospitalized elderly patients (Table 4).36,44–46 The initial screen focuses on the following four components: body mass index (BMI) <20 kg/m2, loss of weight in the previous 3 months, decreased nutritional intake, and severe illness.47 If any of these factors are present, a final screening for impaired nutritional status and severity of disease is performed. Two scores are assigned and then added together. A nutrition adequacy score (0–3) is assigned based on recent weight loss, decreased oral intake, and low BMI. The disease severity score (0–3) is assigned based on the examples of increasingly severe disease processes such as hip fracture, COPD, and critical illness (APACHE II score >10). Finally, the NRS-2002 takes into account age and adds one point for age >70 years. A total NRS-2002 score of ≥3 suggests nutritional risk, indicating the need to optimize nutrition support.
Ambulatory assessment of malnutrition
In an ambulatory setting, the Mini Nutritional Assessment (MNA) can be utilized to identify malnutrition (Table 3). The MNA is a simple assessment that does not require a nutrition specialist. The MNA has been studied in a predominantly elderly population and has been validated in several chronic medical conditions, such as Parkinson’s disease, COPD, and malignancy.5,6,48 The full MNA evaluates factors such as mobility, amount of nutrition intake, weight loss, and social interactions, including stress level and independent living.48 A validated short form (MNA-SF) focuses on the following six factors: food intake, weight loss, mobility, BMI and presence of psycho-social stress, dementia, and depression.49 Calf circumference can be substituted in place of BMI, with a measurement of <33 cm suggesting malnutrition.
Physical examination and body composition measurements
Patients identified at risk for malnutrition should have their height and weight measured by clinicians. Clinician’s height and weight measurements have been shown to be more accurate than self-reported values.50 BMI can be calculated to identify underweight or overweight (or obese), based on the World Health Organization and the National Institutes of Health values: underweight (BMI <18.49 kg/m2), healthy weight (BMI 18.5–24.9 kg/m2), overweight (BMI 25.0–29.9 kg/m2), and obese (BMI ≥30 kg/m2). Waist circumference (WC) measurement further risk stratifies patients with a BMI of between 25 and 35 kg/m2. WC values >102 cm in men and >88 cm in women increase the risk for obesity-related comorbidities.51 Functional assessments can objectively identify the current level of physical functioning and the longitudinal impact of nutrition support after subsequent visits. Functional assessments include a stair climbing test, a 30-second chair stand, a 4×10 m fast-paced walk, and a 6-minute walk test.52
Classic physical examination findings to identify malnutrition may not be readily apparent in obesity. BMI does not identify the different phenotypes of obesity, such as sarcopenic obesity.53 Over the past decade, there has been an increased use of imaging to better define the body composition, sarcopenia, and potential malnutrition. Dual-energy X-ray absorptiometry (DXA) and computed tomography (CT) have been used in research settings. DXA provides information of the regional breakdown of soft tissue compartments, such as adipose tissue and fat-free mass (FFM).54 Similarly, CT-derived segmentation of the L3 psoas muscle can identify and differentiate muscle and adipose tissue.55 Software-validated regression equations estimate whole body adipose tissue and muscle mass, which have been correlated to ICU, cancer-related, and liver disease outcomes.55 Bioelectrical impedance analysis (BIA) is a method that has become readily available to measure the body composition, and newer multifrequency BIA correlates well with DXA measurements.54,56 As opposed to DXA and CT, the benefits of BIA include the absence of radiation exposure, portability, and ease of use.
How to provide tube feeding
Protein content
Given the importance of lean body mass (LBM) preservation to delay sarcopenia as well as the association of amino acid availability and MPS rate discussed earlier, protein intake is one of the most important factors in providing EN in the elderly. In the health ABC study, those with the highest quintile of protein intake had a 43% reduction in the loss of lean body mass over 3 years, as compared with those with the lowest quintile of protein intake.57 However, despite the benefits, the question of how much protein and how frequently it should be provided remains unsettled. The current recommended dietary allowance (RDA) for protein is 0.8 g/kg/day for all healthy individuals aged >18 years,58 whereas the World Health Organization recommends 0.66 g/kg/day (Table 5).59 Despite these recommendations, studies have revealed that >10% of community dwelling and 35% of institutionalized elderly reported protein intake below the daily minimum requirements.60 Experts have argued that part of the issue with suboptimal protein intake is a misinterpretation of the definition of RDA, which was established by the Institute of Medicine based on short-duration nitrogen balance studies in young adults estimating the minimum protein intake required to prevent the progressive loss of lean body mass.58,61 The RDA does not equal optimal protein intake, which can differ significantly with aging. Additionally, given anabolic resistance, the elderly individual without comorbidities may have a different optimal protein requirement than someone of similar age with significant comorbidities and frailty.
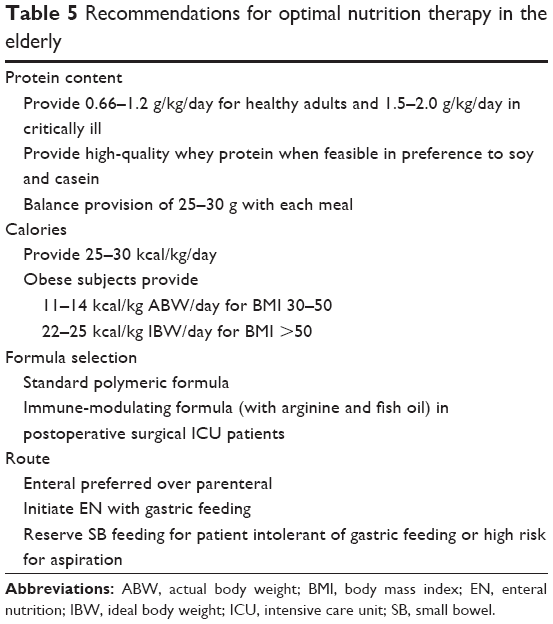 | Table 5 Recommendations for optimal nutrition therapy in the elderly |
In the healthy population, there is a dose-dependent and saturable stimulatory effect of EAAs. Non-EAAs do not have a significant role in the stimulatory effect.22,62,63 Cuthbertson et al22 reported that the ingestion of 2.5, 5, or 10 g of essential AA increased MPS in a dose-dependent manner in healthy elderly men, although less so than their younger counterparts. Doses 20 and 40 g failed to increase MPS beyond the 10 g dose. Similarly, the ingestion of 113 g of 90% lean ground beef containing ~30 g of protein and 10 g of essential AA by young and healthy elderly men and women lead to a 50% increase in MPS above fasting baseline.64 In a subsequent experiment, the ingestion of 340 g of lean beef (90 g of protein and 30 g of essential AA) did not increase MPS, suggesting that 10 g of essential AA may be sufficient for maximal MPS.65 Whey protein at dose 35 g produced higher MPS in healthy elderly men compared to 10 or 20 g whey.66
In addition to quantity, the quality, source, and timing of protein consumption are important. Although whey, soy, and casein are defined as sources of high-quality proteins, differences in their digestion kinetics lead to differing MPS rates. Whey protein, which tends to be digested and absorbed faster and has a higher leucine concentration, leads to higher MPS when compared with casein hydrolysate and casein.67 Whey protein superiority in inducing MPS was confirmed in a study where ingestion of whey protein after unilateral leg resistance exercise produced 122% greater MPS, as compared with casein.68 Surprisingly, whey protein also leads to a 31% greater MPS than soy, despite the fact that both soy and whey are acid soluble, which facilitates rapid digestion.68 In elderly men, 20 and 40 g of soy protein produced reduced MPS, as compared with whey protein during both resting and postexercise conditions.69
The Western diet is such that three times more protein is consumed for dinner than for breakfast.60,70 In noncritically ill patients, pulse-dose protein provided multiple times per day yielded better total body protein synthesis, as compared with continuous feeding.61,71 Mamerow et al,70 using a cross-over design, examined the impact of even (~30 g with each meal) versus uneven (~10 g with breakfast, 15 g with lunch, and 65 g with dinner) protein distribution on MPS in healthy adults and found that even distribution was associated with a 25% increase in MPS, as compared with uneven distribution. All in all, the data support the consumption of 25–30 g of high-quality protein containing ~10 g of essential AA at each meal for maximal MPS stimulation. Thus, many experts have recommended that ~0.4 g/kg/meal for a total of 1.2 g/kg/day may be the optimal protein target in elderly adults.19
Protein requirements in the ICU
The sine qua non of critical illness is proteolysis. Inflammation leads to early and rapid mobilization of muscle AA for hepatic gluconeogenesis and reprioritization. Worse inflammation increases anabolic resistance, and when coupled with immobilization and existing muscle disuse, muscle loss ensues. Consequences of loss of LBM include poor wound healing, increased duration of mechanical ventilation, propensity for nosocomial infections, reduced strength, and impaired quality of life. Therefore, preserving LBM is paramount in critically ill patients.11,72 In one ultrasound-based study, rectus femoris muscle loss increased to 12.5% by ICU day 7 and 17.7% by day 10.72 Disuse in the setting of immobilization can partially explain the reduction in MPS. In one study of healthy adults, 5 days of immobilization produced a 3.5% reduction in quadriceps muscle cross-sectional area, a 1.4% reduction in mass, and a 9% reduction in strength.73 Similarly, disuse and inflammation with and the inability of insulin to reduce proteolysis contributed to increased MPB in critically ill elderly patients.74,75
Protein provision and weight-bearing exercises may blunt muscle loss and lead to improvements in clinical outcomes. The optimal dose of protein in critically ill patients is unknown.76 The Society of Critical Care Medicine (SCCM) and ASPEN recommend EN to be initiated within 24–48 hours in the critically ill patient who is unable to maintain volitional oral intake.77 If the patient is deemed to be at high nutritional risk (NRS-2002 ≥5 or modified NUTRIC score ≥5), efforts should be made to provide >80% of goal within 48–72 hours. The European Society for Parenteral and Enteral Nutrition (ESPEN) has also recommended initiating EN in all patients who are not expected to resume oral intake within 3 days.78 Protein is recommended between 1.2 and 2.0 g/kg of actual body weight per day in the critically ill and higher in burn and multitrauma patients (Table 5).77 The basis for the protein dose recommendation includes a number of studies with nitrogen balance as the outcome.79 As an example, Ishibashi et al80 tested three protein intake levels (1.1, 1.5, and 1.9 g/kg of FFM) and found that a median protein intake of 1.5 g/kg/FFM or 1.2 g/kg or actual body weight was associated with the lowest body protein loss. Similarly, multiple observational studies have suggested that a protein target of >1.2 g/kg of body weight was associated with lower mortality, even when independent of caloric goal.76,81–83
Protein requirements under special circumstances
Protein requirements have been studied in the elderly with special circumstances. In the obese, protein targets shift from being based on actual body weight to either ideal body weight (IBW) or FFM. Typically, an approach of hypocaloric feedings in the noncritically ill with protein prescriptions ranging between 1.5 g/kg IBW/day and 2.2 g/kg IBW/day has produced nitrogen balance equilibrium or positive nitrogen balance.84 Weijs and Wolfe85 explored protein requirements in older obese subjects during weight loss and found that protein intake >1.9 g/kg FFM was required for muscle accretion. In a trial between older and younger obese critically ill patients, a hypocaloric and high protein nutrition supplementation (protein >2.0 g/kg IBW/day) resulted in a similar negative nitrogen balance between older and younger patients.86
Similar to obese elderly patients, those with renal or liver insufficiency require special consideration when calculating protein requirements. A low protein diet ranging 0.6–0.8 g/kg/day is recommended for non-nephrotic chronic kidney disease patients (Table 5).87 In patients on renal replacement therapy, the optimal protein range may be 1.0–1.3 g/kg/day in noncritically ill and 1.5–2.5 g/kg/day in critically ill patients.88,89 The 2016 SCCM–ASPEN critical care guidelines suggest that protein is not restricted in critically ill patients with acute kidney injury requiring renal replacement.77 Historically, protein restriction was recommended in liver disease with concern for the risk of increasing the nitrogen load.88 However, acute liver failure and decompensated liver cirrhosis are being recognized as a heightened catabolic state leading to proteolysis. Liver cirrhosis is associated with preexisting protein malnutrition and sarcopenia. The Veterans Affairs Cooperative Study in patients hospitalized for alcoholic hepatitis revealed that positive nitrogen balance was not achieved until patients were consuming ~1.2 g/kg/day of protein.90 Similarly, a European multicenter trial revealed an improved 6-month survival in those receiving >77.6 g/day of protein.91,92 The 2016 SCCM–ASPEN guidelines suggest that protein requirements for patients with hepatic failure are determined in the same manner as those for the general ICU patient. The guideline recommends using dry weight for protein dose calculation in patients with ascites and/or fluid overload.77 ESPEN guidelines recommend 0.8–1.2 g/kg/day in acute or subacute liver failure and 1.2–1.5 g/kg/day in liver cirrhosis.93
Calories
Energy expenditure decreases with aging on the order of 150 kcal per decade and correlates with a decrease in FFM.94,95 Energy requirements may be either calculated through simple weight-based estimations (~25–30 kcal/kg/day) and predictive equations (eg, Harris–Benedict equation) or measured via indirect calorimetry (Table 5).77,78,96 Equation-based derivation of resting energy expenditure has been shown to be within 10% of values obtained with indirect calorimetry.97,98 At the extremes of BMI (<18 and >40), the accuracy of predictive equations decreases.77,99 For most clinical scenarios, the availability and ease of use of predictive equations make them optimal for initial energy expenditure calculations with subsequent adjustments being made to the caloric content based on desired weight trajectory.
In obese patients, hypocaloric high-protein EN is typically recommended with an overall caloric goal of 22–25 kcal/kg IBW/day.84 Although the results have been heterogeneous, some trials comparing hypocaloric (~18–25 kcal/kg IBW/day) to eucaloric (30–42 kcal/kg IBW/day) nutrition supports have shown benefit with hypocaloric in terms of decreased length of ICU stay and a trend toward decreased ventilator and hospital days.84,86,100 The 2016 SCCM–ASPEN guideline recommends that EN caloric dose should not exceed 65%–70% of target energy needs based on indirect calorimetry or 11–14 kcal/kg of actual body weight per day for patients with BMI 30–50 kg/m2 and 22–25 kcal/kg IBW/day for patients with BMI >50 kg/m2.77
Formula selection and specialty formulas
For the majority of critically and noncritically ill patients, a standard polymeric formula can be utilized when initiating EN (Table 6). A number of specialty formulas, including diabetes specific, branched chain amino acids (BCAAs) for liver disease, and immune-modulating formulas, have been studied with heterogeneous results (Table 6). As an example, BCAAs have been studied extensively in liver disease, given their numerous theoretical benefits including providing an alternative pathway for ammonia detoxification through synthesis of glutamine from glutamate and ammonia in muscle, leucine-medicated activation of mTOR pathway leading to improved MPS, leucine-induced stimulation of hepatic growth factor, BCAA prevention of tissue triglyceride accumulation, and improvement in neutrophil phagocytic function.88,101 Unfortunately, despite these theoretical benefits, clinical trial results have not been promising, leading major societies to recommend the selective use of specialized enteral formulas containing BCAAs in critically ill patients with liver disease.77,88,93,102 As an example, ESPEN guidelines recommend providing the standard solution in patients with mild encephalopathy and a liver-adapted EN containing increased amounts of BCAA and decreased aromatic amino acids, methionine, and tryptophan in those with more severe encephalopathy (grades III–IV).93
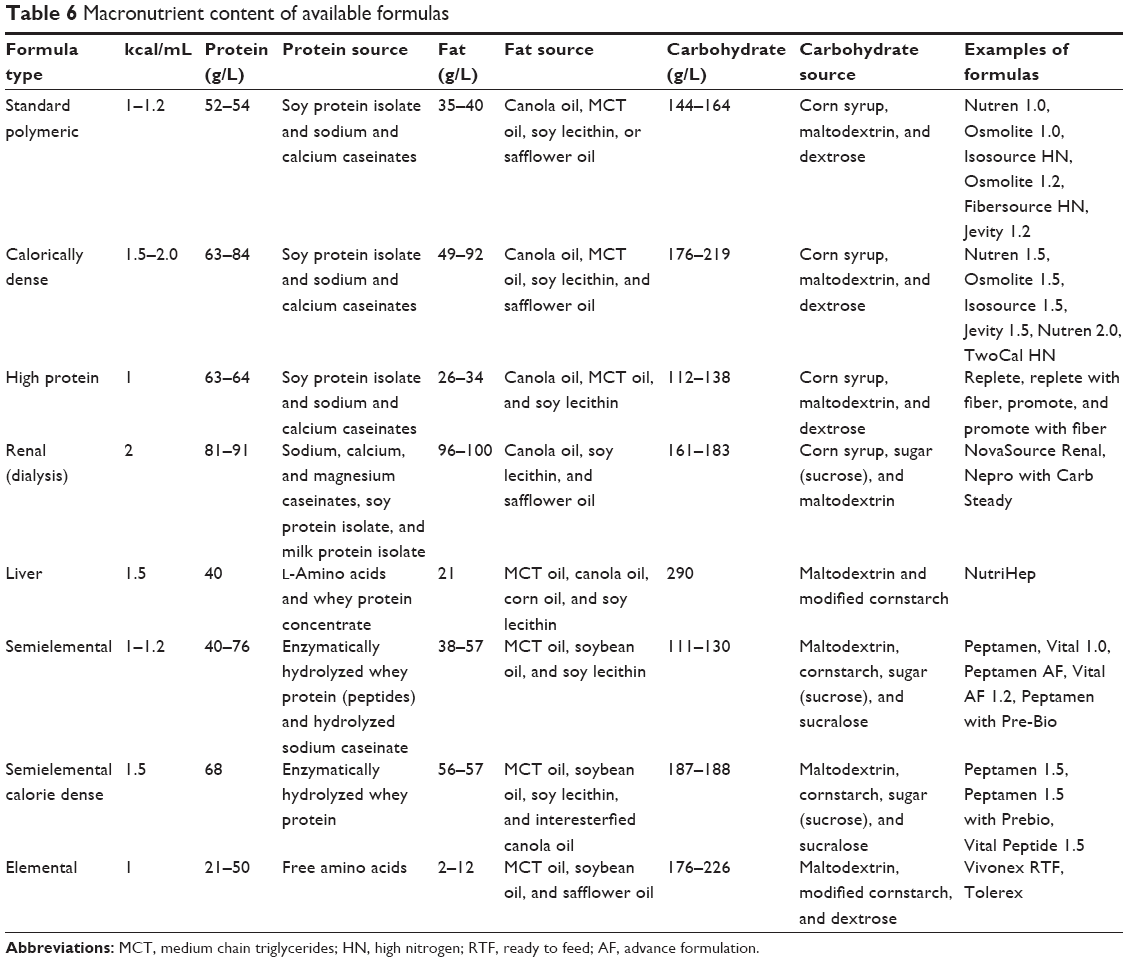 | Table 6 Macronutrient content of available formulas |
Although immune-modulating formulas (typically containing arginine, eicosapentaenoic acid [EPA], docosahexaenoic acid [DHA], glutamine, and nucleic acid) have shown limited benefits over standard formulas in the medical ICU, warranting a recommendation against routine use in ICU patients. Immuno-nutrition may be of benefit in postoperative surgical ICU patients.77 Meta-analyses have demonstrated immune-modifying formulas containing arginine- and fish oil-reduced infection, hospital length of stay, and postoperative complications in surgical ICU patients, when compared with standard formulas.103–107 Based on these studies, it appears that maximal benefit is achieved when these formulas are provided pre-, peri-, and postoperatively in both well-nourished and malnourished patients.77
Route of EN
Another important consideration for providing EN is the method of EN delivery. In critically ill patients, two common strategies for providing EN are gastric and postpyloric (eg, jejunal) feeding. Randomized control trials (RCTs) have compared the effect of gastric versus postpyloric tubes on various outcomes and showed mixed results. Neumann and DeLegge,108 in an RCT of 60 medical ICU patients undergoing bedside placement of enteral tube, showed that patients who received EN delivered in the stomach received nutrition sooner and with fewer attempts at feeding tube placement and reached goal rate sooner, as compared with those who received a postpyloric tube. Montecalvo et al109 randomized 38 patients to nasogastric (NG) versus endoscopically placed nasojejunal (NJ) and showed that the NJ group received a significantly higher percentage of their daily goal calories. They also reported two nosocomial pneumonias in the NG group and none in the NJ group. Kortbeek et al110 randomized 80 mechanically ventilated patients to NG or nasoduodenal feedings and demonstrated a higher pneumonia rate in the NG group. In one of the largest RCTs of NG compared to NJ feeding, Davies et al111 found no differences in calories delivered or clinical outcomes such as pneumonia, aspiration, diarrhea, and mortality. Several meta-analyses have shown either no difference between gastric and small bowel (SB) feeding or a reduction in pneumonia alone with SB feeding (with no difference in any other outcome parameter including duration of mechanical ventilation and hospital LOS). Based on the data available, major guidelines recommend initiating EN in the stomach and then progressing to postpyloric feeds if there is intolerance or the patient is deemed a high risk for aspiration.77,78
Similarly, for the noncritically ill patient, EN is usually initiated in the stomach. A paucity of data exists regarding the method of EN delivery in the elderly. In elderly patients who require long-term EN, percutaneous endoscopy gastrostomy (PEG) has been found to be superior to NG tube feeding.112 Ciocon et al113 prospectively evaluated 70 patients aged 65–95 years who were receiving EN through NG, NJ, gastrostomy, or jejunostomy tube. Although the duration of tube feeding ranged from 1 month to 8 years, they were able to follow 56 patients for 11 months. Indications for EN were refusal to swallow due to cognitive dysfunction, such as dementia (50%), dysphagia without obstruction (47%), and esophageal obstruction (3%). Patients with nasoenteric tubes (NJ and NG) experienced agitation, high rates of self-extubation (~67%), aspiration pneumonia, tube kinking, and tube clogging, as compared with percutaneous tube.
Conclusion
Malnutrition and sarcopenia are highly prevalent in the elderly and lead to significant morbidity and mortality. In addition to physical activity, adequate nutrition support, especially high-quality protein consumption, is key to mitigate the changes that occur with MPS and MPB due to age and the disease state. A number of risk stratification calculators are available for providers to help identify patients at risk in the ICU, hospital, and outpatient settings. Additionally, tools such as BIA are becoming more readily available and can provide a more rigorous assessment of LBM, allowing longitudinal assessment. More data are also forthcoming to indicate that perhaps the previous recommendations for protein intake are insufficient to meet the needs of the elderly population, given the associated anabolic resistance. As such, experts are recommending higher amounts of high-quality protein on the order of 1.2 g/kg provided in an intermittent and balanced manner for maximal MPS if possible. For the critically ill, even higher amounts of protein may be necessary to prevent further debility. Large multicenter prospective trials are needed to help further delineate adequate nutrition and protein needs for this increasingly prevalent cohort.
Disclosure
JP and RTH are consultants for Nestle. SAM is on the speakers’ bureau, has research support from Nestle and Abbott, and is a consultant for Covidien. MSM reports no conflicts of interest in this work.
References
Bloom DE, Chatterji S, Kowal P, et al. Macroeconomic implications of population ageing and selected policy responses. Lancet. 2015;385(9968):649–657. | ||
Kowal P, Williams SR, Chatterji S. Ageing alongside and outside EU borders. BMJ. 2011;343:d4885. | ||
Sura L, Madhavan A, Carnaby G, Crary MA. Dysphagia in the elderly: management and nutritional considerations. Clin Interv Aging. 2012;7:287–298. | ||
Scheltens P, Blennow K, Breteler MMB, et al. Alzheimer’s disease. Lancet. 2016;388(10043):505–517. | ||
Rubenstein LZ, Harker JO, Salvà A, Guigoz Y, Vellas B. Screening for undernutrition in geriatric practice: developing the short-form mini-nutritional assessment (MNA-SF). J Gerontol A. 2001;56(6):M366–M372. | ||
Winter J, Flanagan D, Mcnaughton SA, Nowson C. Nutrition screening of older people in a community general practice, using the MNA-SF. J Nutr Health Aging. 2013;17(4):322–325. | ||
Rudman D, Feller AG. Protein-calorie undernutrition in the nursing home. J Am Geriatr Soc. 1989;37(2):173–183. | ||
Xue Q-L. The frailty syndrome: definition and natural history. Clin Geriatr Med. 2011;27(1):1–15. | ||
Phillips SM. Nutrition in the elderly: a recommendation for more (evenly distributed) protein? Am J Clin Nutr. 2017;106(1):12–13. | ||
Churchward-Venne TA, Breen L, Phillips SM. Alterations in human muscle protein metabolism with aging: protein and exercise as countermeasures to offset sarcopenia. Biofactors. 2014;40(2):199–205. | ||
Phillips SM, Dickerson RN, Moore FA, Paddon-Jones D, Weijs PJM. Protein turnover and metabolism in the elderly intensive care unit patient. Nutr Clin Pract. 2017;32(1 Suppl):112S–120S. | ||
Cruz-Jentoft AJ, Baeyens JP, Bauer JM, et al. Sarcopenia: European consensus on definition and diagnosis. Age Ageing. 2010;39(4):412–423. | ||
Phillips SM, Tipton KD, Aarsland A, Wolf SE, Wolfe RR. Mixed muscle protein synthesis and breakdown after resistance exercise in humans. Am J Physiol Endocrinol Metab. 1997;273(1):E99–E107. | ||
Breen L, Stokes KA, Churchward-Venne TA, et al. Two weeks of reduced activity decreases leg lean mass and induces “anabolic resistance” of myofibrillar protein synthesis in healthy elderly. J Clin Endocrinol Metab. 2013;98(6):2604–2612. | ||
Marik PE. Feeding critically ill patients the right “whey”: thinking outside of the box. A personal view. Ann Intensive Care. 2015;5(1):51. | ||
Atherton PJ, Etheridge T, Watt PW, et al. Muscle full effect after oral protein: time-dependent concordance and discordance between human muscle protein synthesis and mTORC1 signaling. Am J Clin Nutr. 2010;92(5):1080–1088. | ||
Phillips BE, Hill DS, Atherton PJ. Regulation of muscle protein synthesis in humans. Curr Opin Clin Nutr Metab Care. 2012;15(1):58–63. | ||
Dickinson JM, Fry CS, Drummond MJ, et al. Mammalian target of rapamycin complex 1 activation is required for the stimulation of human skeletal muscle protein synthesis by essential amino acids. J Nutr. 2011;141(5):856–862. | ||
Moore DR, Churchward-Venne TA, Witard O, et al. Protein ingestion to stimulate myofibrillar protein synthesis requires greater relative protein intakes in healthy older versus younger men. J Gerontol A Biol Sci Med Sci. 2015;70(1):57–62. | ||
Katsanos CS, Kobayashi H, Sheffield-Moore M, Aarsland A, Wolfe RR. A high proportion of leucine is required for optimal stimulation of the rate of muscle protein synthesis by essential amino acids in the elderly. Am J Physiol Endocrinol Metab. 2006;291(2):E381–E387. | ||
Volpi E, Mittendorfer B, Wolf SE, Wolfe RR. Oral amino acids stimulate muscle protein anabolism in the elderly despite higher first-pass splanchnic extraction. Am J Physiol Endocrinol Metab. 1999;277(3):E513–E520. | ||
Cuthbertson D, Smith K, Babraj J, et al. Anabolic signaling deficits underlie amino acid resistance of wasting, aging muscle. FASEB J. 2004;19(3):422–424. | ||
Roy N, Stemple J, Merrill RM, Thomas L. Dysphagia in the elderly: preliminary evidence of prevalence, risk factors, and socioemotional effects. Ann Otol Rhinol Laryngol. 2007;116(11):858–865. | ||
Steele CM, Greenwood C, Ens I, Robertson C, Seidman-Carlson R. Mealtime difficulties in a home for the aged: not just dysphagia. Dysphagia. 1997;12(1):43–50. Discussion 51. | ||
Lee A, Sitoh YY, Lieu PK, Phua SY, Chin JJ. Swallowing impairment and feeding dependency in the hospitalised elderly. Ann Acad Med Singapore. 1999;28(3):371–376. | ||
Mann G, Hankey GJ, Cameron D. Swallowing function after stroke: prognosis and prognostic factors at 6 months. Stroke. 1999;30(4):744–748. | ||
Fucile S, Wright PM, Chan I, Yee S, Langlais ME, Gisel EG. Functional oral-motor skills: do they change with age? Dysphagia. 1998;13(4):195–201. | ||
Smithard DG, Smeeton NC, Wolfe CDA. Long-term outcome after stroke: does dysphagia matter? Age Ageing. 2007;36(1):90–94. | ||
Foley NC, Martin RE, Salter KL, Teasell RW. A review of the relationship between dysphagia and malnutrition following stroke. J Rehabil Med. 2009;41(9):707–713. | ||
Rizzi L, Rosset I, Roriz-Cruz M. Global epidemiology of dementia: Alzheimer’s and vascular types. Biomed Res Int. 2014;2014:908915. | ||
Ferri CP, Prince M, Brayne C, et al. Global prevalence of dementia: a Delphi consensus study. Lancet. 2005;366(9503):2112–2117. | ||
Serby M, Larson P, Kalkstein D. The nature and course of olfactory deficits in Alzheimer’s disease. Am J Psychiatry. 1991;148(3):357–360. | ||
Morley JE. Anorexia, sarcopenia, and aging. Nutrition. 2001;17(7):660–663. | ||
Evans WJ, Morley JE, Argilés J, et al. Cachexia: a new definition. Clin Nutr. 2008;27(6):793–799. | ||
Lecker SH, Jagoe RT, Gilbert A, et al. Multiple types of skeletal muscle atrophy involve a common program of changes in gene expression. FASEB J. 2004;18(1):39–51. | ||
Hurt RT, McClave SA. Nutritional assessment in primary care. Med Clin North Am. 2016;100(6):1169–1183. | ||
Klesges LM, Pahor M, Shorr RI, Wan JY, Williamson JD, Guralnik JM. Financial difficulty in acquiring food among elderly disabled women: results from the Women’s Health and Aging Study. Am J Public Health. 2001;91(1):68–75. | ||
Brinkman H-J, de Pee S, Sanogo I, Subran L, Bloem MW. High food prices and the global financial crisis have reduced access to nutritious food and worsened nutritional status and health. J Nutr. 2010;140(1):153S–161S. | ||
Bayer LM, Bauers CM, Kapp SR. Psychosocial aspects of nutritional support. Nurs Clin North Am. 1983;18(1):119–128. | ||
Meijers JMM, van Bokhorst-de van der Schueren MAE, Schols JMGA, Soeters PB, Halfens RJG. Defining malnutrition: mission or mission impossible? Nutrition. 2010;26(4):432–440. | ||
White JV, Guenter P, Jensen G, Malone A, Schofield M. Consensus statement: Academy of Nutrition and Dietetics and American Society for Parenteral and Enteral Nutrition: characteristics recommended for the identification and documentation of adult malnutrition (undernutrition). J Parenter Enter Nutr. 2012;36(3):275–283. | ||
Heyland DK, Dhaliwal R, Jiang X, Day AG. Identifying critically ill patients who benefit the most from nutrition therapy: the development and initial validation of a novel risk assessment tool. Crit Care. 2011;15(6):R268. | ||
Rahman A, Hasan RM, Agarwala R, Martin C, Day AG, Heyland DK. Identifying critically-ill patients who will benefit most from nutritional therapy: further validation of the “modified NUTRIC” nutritional risk assessment tool. Clin Nutr. 2016;35(1):158–162. | ||
Orell-Kotikangas H, Österlund P, Saarilahti K, Ravasco P, Schwab U, Mäkitie AA. NRS-2002 for pre-treatment nutritional risk screening and nutritional status assessment in head and neck cancer patients. Support Care Cancer. 2015;23(6):1495–1502. | ||
Drescher T, Singler K, Ulrich A, et al. Comparison of two malnutrition risk screening methods (MNA and NRS 2002) and their association with markers of protein malnutrition in geriatric hospitalized patients. Eur J Clin Nutr. 2010;64(8):887–893. | ||
Ozsurekci C, Arik G, Halil MG. Comparing the adequacy of the MNA-SF, NRS-2002 and MUST nutritional tools in assessing malnutrition in hip fracture operated elderly patients. Clin Nutr. 2017;36(3):913. | ||
Kondrup J, Allison SP, Elia M, Vellas B, Plauth M; Educational and Clinical Practice Committee, European Society of Parenteral and Enteral Nutrition (ESPEN). ESPEN guidelines for nutrition screening 2002. Clin Nutr. 2003;22(4):415–421. | ||
Vellas B, Guigoz Y, Garry PJ, et al. The mini nutritional assessment (MNA) and its use in grading the nutritional state of elderly patients. Nutrition. 1999;15(2):116–122. | ||
de Luis DA, López Mongil R, González Sagrado M, et al; Group NOVOMET. Evaluation of the mini-nutritional assessment short-form (MNA-SF) among institutionalized older patients in Spain. Nutr Hosp. 2011;26(6):1350–1354. | ||
Mueller KG, Hurt RT, Abu-Lebdeh HS, Mueller PS. Self-perceived vs actual and desired weight and body mass index in adult ambulatory general internal medicine patients: a cross sectional study. BMC Obes. 2014;1:26. | ||
Chan JM, Rimm EB, Colditz GA, Stampfer MJ, Willett WC. Obesity, fat distribution, and weight gain as risk factors for clinical diabetes in men. Diabetes Care. 1994;17(9):961–969. | ||
Russell MK. Functional assessment of nutrition status. Nutr Clin Pract. 2015;30(2):211–218. | ||
Shah M, Hurt RT, Mundi MS. Phenotypes of obesity: how it impacts management. Curr Gastroenterol Rep. 2017;19(11):55. | ||
Thibault R, Genton L, Pichard C. Body composition: why, when and for who? Clin Nutr. 2012;31(4):435–447. | ||
Gomez-Perez SL, Haus JM, Sheean P, et al. Measuring abdominal circumference and skeletal muscle from a single cross-sectional CT image: a step-by-step guide for clinicians using National Institutes of Health ImageJ. JPEN J Parenter Enteral Nutr. 2016;40(3):308–318. | ||
Leahy S, O’Neill C, Sohun R, Jakeman P. A comparison of dual energy X-ray absorptiometry and bioelectrical impedance analysis to measure total and segmental body composition in healthy young adults. Eur J Appl Physiol. 2012;112(2):589–595. | ||
Houston DK, Nicklas BJ, Ding J, et al. Dietary protein intake is associated with lean mass change in older, community-dwelling adults: the health, aging, and body composition (health ABC) study. Am J Clin Nutr. 2008;87(1):150–155. | ||
Wolfe RR, Miller SL. The recommended dietary allowance of protein. JAMA. 2008;299(24):2891–2893. | ||
Joint Expert Consultation on Protein and Amino Acid Requirements in Human Nutrition, Weltgesundheitsorganisation, FAO, United Nations University, eds. Protein and Amino Acid Requirements in Human Nutrition: Report of a Joint WHO/FAO/UNU Expert Consultation; Geneva, 9–16 April 2002. Geneva: WHO; 2007. | ||
Tieland M, Borgonjen-Van den Berg K, Loon L, Groot L. Dietary protein intake in community-dwelling, frail, and institutionalized elderly people: scope for improvement. Eur J Nutr. 2012;51(2):173–179. | ||
Paddon-Jones D, Rasmussen BB. Dietary protein recommendations and the prevention of sarcopenia. Curr Opin Clin Nutr Metab Care. 2009;12(1):86–90. | ||
Tipton KD, Gurkin BE, Matin S, Wolfe RR. Nonessential amino acids are not necessary to stimulate net muscle protein synthesis in healthy volunteers. J Nutr Biochem. 1999;10(2):89–95. | ||
Volpi E, Kobayashi H, Sheffield-Moore M, Mittendorfer B, Wolfe RR. Essential amino acids are primarily responsible for the amino acid stimulation of muscle protein anabolism in healthy elderly adults. Am J Clin Nutr. 2003;78(2):250–258. | ||
Symons TB, Schutzler SE, Cocke TL, Chinkes DL, Wolfe RR, Paddon-Jones D. Aging does not impair the anabolic response to a protein-rich meal. Am J Clin Nutr. 2007;86(2):451–456. | ||
Symons TB, Sheffield-Moore M, Wolfe RR, Paddon-Jones D. Moderating the portion size of a protein-rich meal improves anabolic efficiency in young and elderly. J Am Diet Assoc. 2009;109(9):1582–1586. | ||
Pennings B, Groen B, de Lange A, et al. Amino acid absorption and subsequent muscle protein accretion following graded intakes of whey protein in elderly men. Am J Physiol Endocrinol Metab. 2012;302(8):E992–E999. | ||
Pennings B, Boirie Y, Senden JM, Gijsen AP, Kuipers H, van Loon LJ. Whey protein stimulates postprandial muscle protein accretion more effectively than do casein and casein hydrolysate in older men. Am J Clin Nutr. 2011;93(5):997–1005. | ||
Tang JE, Moore DR, Kujbida GW, Tarnopolsky MA, Phillips SM. Ingestion of whey hydrolysate, casein, or soy protein isolate: effects on mixed muscle protein synthesis at rest and following resistance exercise in young men. J Appl Physiol. 2009;107(3):987–992. | ||
Yang Y, Churchward-Venne TA, Burd NA, Breen L, Tarnopolsky MA, Phillips SM. Myofibrillar protein synthesis following ingestion of soy protein isolate at rest and after resistance exercise in elderly men. Nutr Metab. 2012;9:57. | ||
Mamerow MM, Mettler JA, English KL, et al. Dietary protein distribution positively influences 24-h muscle protein synthesis in healthy adults. J Nutr. 2014;144(6):876–880. | ||
Martindale RG, Heyland DK, Rugeles SJ, et al. Protein kinetics and metabolic effects related to disease states in the intensive care unit. Nutr Clin Pract. 2017;32(1 Suppl):21S–29S. | ||
Puthucheary ZA, Rawal J, McPhail M, et al. Acute skeletal muscle wasting in critical illness. JAMA. 2013;310(15):1591–1600. | ||
Wall BT, Dirks ML, Snijders T, Senden JMG, Dolmans J, van Loon LJC. Substantial skeletal muscle loss occurs during only 5 days of disuse. Acta Physiol. 2014;210(3):600–611. | ||
Londhe P, Guttridge DC. Inflammation induced loss of skeletal muscle. Bone. 2015;80:131–142. | ||
Wilkes EA, Selby AL, Atherton PJ, et al. Blunting of insulin inhibition of proteolysis in legs of older subjects may contribute to age-related sarcopenia. Am J Clin Nutr. 2009;90(5):1343–1350. | ||
Heyland DK, Weijs PJM, Coss-Bu JA, et al. Protein delivery in the intensive care unit: optimal or suboptimal? Nutr Clin Pract. 2017;32(1 Suppl):58S–71S. | ||
McClave SA, Taylor BE, Martindale RG, et al. Guidelines for the provision and assessment of nutrition support therapy in the adult critically ill patient: Society of Critical Care Medicine (SCCM) and American Society for Parenteral and Enteral Nutrition (A.S.P.E.N.). JPEN J Parenter Enteral Nutr. 2016;40(2):159–211. | ||
Kreymann KG, Berger MM, Deutz NEP, et al. ESPEN guidelines on enteral nutrition: intensive care. Clin Nutr. 2006;25(2):210–223. | ||
Weijs PJM, Dickerson RN, Heyland DK, Moore FA, Rugeles SJ, McClave SA. Experimental and outcome-based approaches to protein requirements in the intensive care unit. Nutr Clin Pract. 2017;32(1 Suppl):77S–85S. | ||
Ishibashi N, Plank LD, Sando K, Hill GL. Optimal protein requirements during the first 2 weeks after the onset of critical illness. Crit Care Med. 1998;26(9):1529–1535. | ||
Strack van Schijndel RJ, Weijs PJ, Koopmans RH, Sauerwein HP, Beishuizen A, Girbes AR. Optimal nutrition during the period of mechanical ventilation decreases mortality in critically ill, long-term acute female patients: a prospective observational cohort study. Crit Care. 2009;13(4):R132. | ||
Weijs PJM, Stapel SN, de Groot SDW, et al. Optimal protein and energy nutrition decreases mortality in mechanically ventilated, critically ill patients: a prospective observational cohort study. JPEN J Parenter Enteral Nutr. 2012;36(1):60–68. | ||
Allingstrup MJ, Esmailzadeh N, Wilkens Knudsen A, et al. Provision of protein and energy in relation to measured requirements in intensive care patients. Clin Nutr. 2012;31(4):462–468. | ||
Dickerson RN, Patel JJ, McClain CJ. Protein and calorie requirements associated with the presence of obesity. Nutr Clin Pract. 2017;32(1 Suppl):86S–93S. | ||
Weijs PJM, Wolfe RR. Exploration of the protein requirement during weight loss in obese older adults. Clin Nutr. 2016;35(2):394–398. | ||
Dickerson RN, Medling TL, Smith AC, et al. Hypocaloric, high-protein nutrition therapy in older vs younger critically ill patients with obesity. JPEN J Parenter Enteral Nutr. 2013;37(3):342–351. | ||
Kovesdy CP, Kopple JD, Kalantar-Zadeh K. Management of protein-energy wasting in non-dialysis-dependent chronic kidney disease: reconciling low protein intake with nutritional therapy. Am J Clin Nutr. 2013;97(6):1163–1177. | ||
Patel JJ, McClain CJ, Sarav M, Hamilton-Reeves J, Hurt RT. Protein requirements for critically ill patients with renal and liver failure. Nutr Clin Pract. 2017;32(1 Suppl):101S–111S. | ||
Kim JC, Kalantar-Zadeh K, Kopple JD. Frailty and protein-energy wasting in elderly patients with end stage kidney disease. J Am Soc Nephrol. 2013;24(3):337–351. | ||
Mendenhall CL, Moritz TE, Roselle GA, et al. Protein energy malnutrition in severe alcoholic hepatitis: diagnosis and response to treatment. JPEN J Parenter Enteral Nutr. 1995;19(4):258–265. | ||
Puri P, Thursz M. Intensive enteral nutrition in alcoholic hepatitis: more food for thought. Gastroenterology. 2016;150(4):803–805. | ||
Moreno C, Deltenre P, Senterre C, et al. Intensive enteral nutrition is ineffective for patients with severe alcoholic hepatitis treated with corticosteroids. Gastroenterology. 2016;150(4):903.e8–910.e8. | ||
Plauth M, Cabré E, Campillo B, et al. ESPEN guidelines on parenteral nutrition: hepatology. Clin Nutr Edinb Scotl. 2009;28(4):436–444. | ||
Cooper JA, Manini TM, Paton CM, et al. Longitudinal change in energy expenditure and effects on energy requirements of the elderly. Nutr J. 2013;12:73. | ||
Roberts SB, Dallal GE. Energy requirements and aging. Public Health Nutr. 2005;8(7A):1028–1036. | ||
Harris JA, Benedict FG. A biometric study of human basal metabolism. Proc Natl Acad Sci U S A. 1918;4(12):370–373. | ||
Segadilha NLAL, Rocha EEM, Tanaka LMS, Gomes KLP, Espinoza REA, Peres WAF. Energy expenditure in critically ill elderly patients: indirect calorimetry vs predictive equations. JPEN J Parenter Enteral Nutr. 2017;41(5):776–784. | ||
Siervo M, Bertoli S, Battezzati A, et al. Accuracy of predictive equations for the measurement of resting energy expenditure in older subjects. Clin Nutr. 2014;33(4):613–619. | ||
Frankenfield DC, Ashcraft CM, Galvan DA. Prediction of resting metabolic rate in critically ill patients at the extremes of body mass index. JPEN J Parenter Enteral Nutr. 2013;37(3):361–367. | ||
Dickerson RN, Boschert KJ, Kudsk KA, Brown RO. Hypocaloric enteral tube feeding in critically ill obese patients. Nutrition. 2002;18(3):241–246. | ||
Holecek M. Branched-chain amino acids and ammonia metabolism in liver disease: therapeutic implications. Nutrition. 2013;29(10):1186–1191. | ||
Tajiri K, Shimizu Y. Branched-chain amino acids in liver diseases. World J Gastroenterol. 2013;19(43):7620–7629. | ||
Heyland DK, Novak F, Drover JW, Jain M, Su X, Suchner U. Should immunonutrition become routine in critically ill patients? A systematic review of the evidence. JAMA. 2001;286(8):944–953. | ||
Drover JW, Dhaliwal R, Weitzel L, Wischmeyer PE, Ochoa JB, Heyland DK. Perioperative use of arginine-supplemented diets: a systematic review of the evidence. J Am Coll Surg. 2011;212(3):385.e1–399.e1. | ||
Marimuthu K, Varadhan KK, Ljungqvist O, Lobo DN. A meta-analysis of the effect of combinations of immune modulating nutrients on outcome in patients undergoing major open gastrointestinal surgery. Ann Surg. 2012;255(6):1060–1068. | ||
Osland E, Hossain MB, Khan S, Memon MA. Effect of timing of pharmaconutrition (immunonutrition) administration on outcomes of elective surgery for gastrointestinal malignancies a systematic review and meta-analysis. JPEN J Parenter Enteral Nutr. 2014;38(1):53–69. | ||
Osland E, Yunus RM, Khan S, Memon MA. Early versus traditional postoperative feeding in patients undergoing resectional gastrointestinal surgery: a meta-analysis. JPEN J Parenter Enteral Nutr. 2011;35(4):473–487. | ||
Neumann DA, DeLegge MH. Gastric versus small-bowel tube feeding in the intensive care unit: a prospective comparison of efficacy. Crit Care Med. 2002;30(7):1436–1438. | ||
Montecalvo MA, Steger KA, Farber HW, et al. Nutritional outcome and pneumonia in critical care patients randomized to gastric versus jejunal tube feedings. The Critical Care Research Team. Crit Care Med. 1992;20(10):1377–1387. | ||
Kortbeek JB, Haigh PI, Doig C. Duodenal versus gastric feeding in ventilated blunt trauma patients: a randomized controlled trial. J Trauma. 1999;46(6):992–996. Discussion 996–998. | ||
Davies AR, Morrison SS, Bailey MJ, et al. A multicenter, randomized controlled trial comparing early nasojejunal with nasogastric nutrition in critical illness. Crit Care Med. 2012;40(8):2342–2348. | ||
Gomes CAR, Andriolo RB, Bennett C, et al. Percutaneous endoscopic gastrostomy versus nasogastric tube feeding for adults with swallowing disturbances. Cochrane Database Syst Rev. 2015;(5):CD008096. | ||
Ciocon JO, Silverstone FA, Graver LM, Foley CJ. Tube feedings in elderly patients: indications, benefits, and complications. Arch Intern Med. 1988;148(2):429–433. |
 © 2018 The Author(s). This work is published and licensed by Dove Medical Press Limited. The
full terms of this license are available at https://www.dovepress.com/terms
and incorporate the Creative Commons Attribution
- Non Commercial (unported, 3.0) License.
By accessing the work you hereby accept the Terms. Non-commercial uses of the work are permitted
without any further permission from Dove Medical Press Limited, provided the work is properly
attributed. For permission for commercial use of this work, please see paragraphs 4.2 and 5 of our Terms.
© 2018 The Author(s). This work is published and licensed by Dove Medical Press Limited. The
full terms of this license are available at https://www.dovepress.com/terms
and incorporate the Creative Commons Attribution
- Non Commercial (unported, 3.0) License.
By accessing the work you hereby accept the Terms. Non-commercial uses of the work are permitted
without any further permission from Dove Medical Press Limited, provided the work is properly
attributed. For permission for commercial use of this work, please see paragraphs 4.2 and 5 of our Terms.