Back to Journals » ClinicoEconomics and Outcomes Research » Volume 6
Cost-effectiveness analysis of Mammostrat® compared with Oncotype DX® to inform the treatment of breast cancer
Authors Mislick K, Schonfeld W, Bodnar C, Tong K
Received 17 August 2013
Accepted for publication 1 October 2013
Published 16 January 2014 Volume 2014:6 Pages 37—47
DOI https://doi.org/10.2147/CEOR.S53142
Checked for plagiarism Yes
Review by Single anonymous peer review
Peer reviewer comments 3
Kimberly Mislick,1 Warren Schonfeld,2 Carolyn Bodnar,3 Kuo Bianchini Tong2
1Pathology and Laboratory Medicine, UCLA, Los Angeles, CA, USA; 2Quorum Consulting, Inc, San Francisco, CA, USA; 3GE Healthcare, Chalfont St Giles, Buckinghamshire, UK
Purpose: To compare the cost-effectiveness of the tumor subtyping assays Mammostrat® and Oncotype DX® for assessing risk of recurrence in early-stage breast cancer and the potential benefit of adjuvant chemotherapy.
Methods: Cost-effectiveness analysis from a US third-party payer perspective. A 10 year Markov model was developed to estimate costs and effects of using each method of risk assessment. The percentages of patients assessed as high, moderate, or low risk were obtained from multicenter, prospective, randomized controlled trials. The analysis simulated the experience of women progressing through various model states representing clinical treatments and subsequent disease. Published recurrence data for Mammostrat® were adjusted appropriately to account for differences between definitions and samples of Oncotype DX® and Mammostrat® in the original clinical trials. Cost and utility data were obtained from previously published studies. Sensitivity analyses examined how base-case results might differ when input values and assumptions varied.
Results: Base-case costs for women assessed using Mammostrat® were $15,782, compared with $18,051 for women assessed with Oncotype DX®. Thus, cost savings of $2,268 resulted from using Mammostrat®. Both Mammostrat® and Oncotype DX® resulted in similar life years (9.880 and 9.882) and quality-adjusted life years (7.935 and 7.940), respectively. Sensitivity analyses demonstrated that the assumptions made about recurrence are the key drivers of model results.
Discussion: Cost savings associated with the use of Mammostrat® instead of Oncotype DX® are largely due to the difference in cost between the two tests. Since survival and quality-adjusted life years were similar using either assay, Mammostrat® has economic advantages for women with early-stage breast cancer.
Keywords: cost-effectiveness analysis, IVD, breast cancer, Mammostrat, assay
Introduction
Clinical trials have shown that tamoxifen and chemotherapy have clinical benefit for women with early-stage, node-negative, estrogen receptor–positive breast cancer.1–3 However, as the likelihood of cancer recurrence in patients treated with tamoxifen alone is only approximately 15% at 10 years, many women do not achieve benefit from chemotherapy yet experience associated side effects. Thus, tools such as Adjuvant! Online (Adjuvant! Inc, San Antonio, TX, USA) and tumor subtyping assays such as InSight® Dx Mammostrat® (Clarient Diagnostic Services, Inc, Aliso Viejo, CA, USA), MammaPrint® (Agendia, Irvine, CA, USA), and Oncotype DX® (Genomic Health, Inc, Redwood City, CA, USA) have emerged as prognostic and predictive options to help clinicians and patients estimate the recurrence risk and potential benefit of adjuvant chemotherapy.
A number of published cost-effectiveness analysis (CEA) studies for available assays stratify patients with early-stage breast cancer according to risk of disease recurrence.4–11 Previous CEA studies have used a non–tissue-based risk assessment tool such as Adjuvant! Online as the comparator (control) group.12 However, only one published study directly compared the health economics of one assay to another: Yang et al13 concluded that MammaPrint® is a more cost-effective assay compared with Oncotype DX® at a willingness-to-pay threshold of $50,000 per quality-adjusted life year (QALY).
The objective of this study was to compare the cost-effectiveness of Oncotype DX® and Mammostrat®, an immunohistochemistry bioassay consisting of five biomarkers weighted with an algorithm that produces a risk score independent of tumor proliferation and grade. This analysis is of particular interest because both assays are commercially available and have potential to provide additional clinically meaningful information to the physician and patient. Additionally, both Mammostrat® and Oncotype DX® were developed and validated using clinical samples from patients enrolled in the same studies from the National Surgical Adjuvant Breast and Bowel Project (NSABP) commonly referred to as the NSABP B14 and B20 trials.1–3,14–17
Methods
Study design
A 10 year Markov model was developed using the TreeAge visual modeling tool (TreeAge Software, Inc, Williamstown, MA, USA) to compare Mammostrat® and Oncotype DX® with respect to the costs and effectiveness of using each method to assess the risk of breast cancer recurrence. The study was designed from a US third-party payer perspective.
Markov model structure
The model simulated the experience of women progressing through various model states representing both clinical treatments and subsequent disease. These clinical pathways and health outcomes were assigned on the basis of probabilities of transitioning from each model state to states that might follow. The comparison took into account costs, survival, and quality of life over a 10 year period after entering the model. The length of follow-up was influenced by the available clinical data for the two assays. Costs were discounted 3% per year.18
A woman entered the model after initial treatment for node-negative, estrogen receptor–positive early-stage breast cancer. Every woman was then assessed for risk of subsequent distant recurrence with one of the two methods of risk assessment, Mammostrat® or Oncotype DX®. The decision to treat with chemotherapy influenced the health benefits accruing to patients in the Mammostrat® or Oncotype DX® group. Over the 10 year time horizon, patients could be disease free, have disease recurrence, or have died (as shown in Figure 1 for the first year).
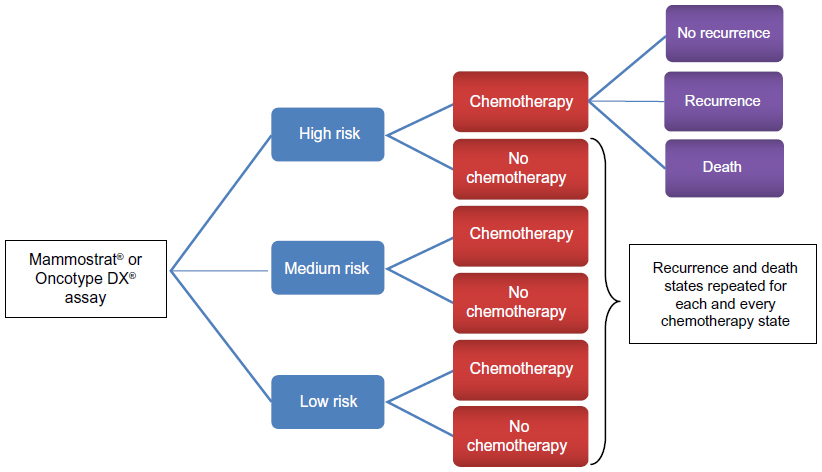 | Figure 1 Sequence of disease states during the first year in the model. |
Each woman was assessed as high, moderate, or low risk. Depending on the risk category, a clinical decision was made for the woman either to receive chemotherapy or not during the first year of follow-up in the model. Women receiving chemotherapy might experience adverse events (AEs) that could be minor, major, or fatal. The sequence of these states and the relationship between outcomes of chemotherapy, AEs, disease recurrence, and mortality is shown in Figure 2.
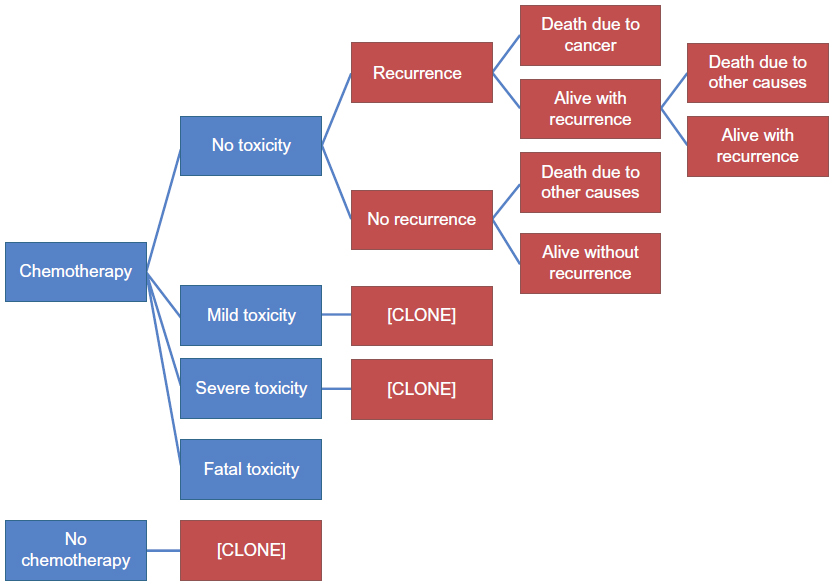 | Figure 2 Model structure with relationships between chemotherapy, cancer recurrence, and mortality. |
Model inputs and data sources
Because the NSABP trials did not collect all the types of data needed for the CEA, various data sets were selected to obtain information to quantify variables used in the model. One set of values was used for the base-case CEA, and sensitivity analyses were conducted because considerable uncertainty surrounds the precise “real world” values when women are assessed for risk, provided treatment, and observed over time. These sensitivity analyses show the variation in results that might be due to differences in data values and model assumptions, as well as which variables have the largest effect on the results observed. The values of the variables used in the base-case analysis and range of values used in the sensitivity analyses are shown in Tables 1–5.
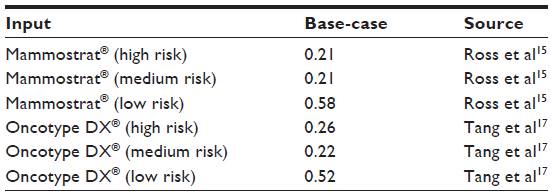 | Table 1 Proportion of patients assessed by Mammostrat® and Oncotype DX® by risk group (base-case) |
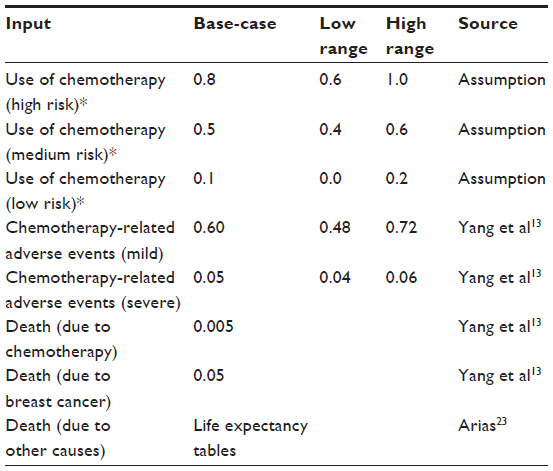 | Table 2 Use of chemotherapy by risk group, adverse events, and risk of death (base-case and ranges for sensitivity analyses) |
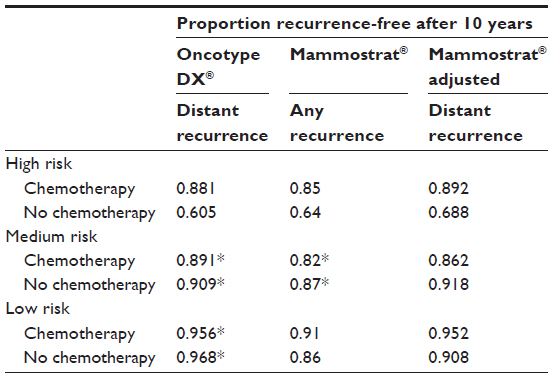 | Table 3 Unadjusted and adjusted proportions of distant recurrence-free breast cancer after 10 years among patients assessed by Mammostrat® and Oncotype DX® by risk group14 |
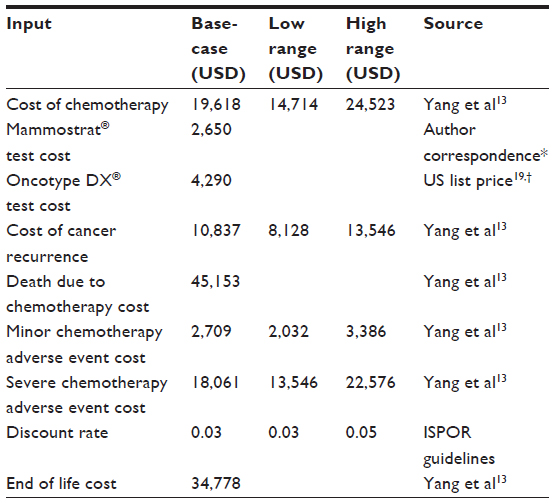 | Table 4 Model cost inputs (base-case and ranges for sensitivity analyses) |
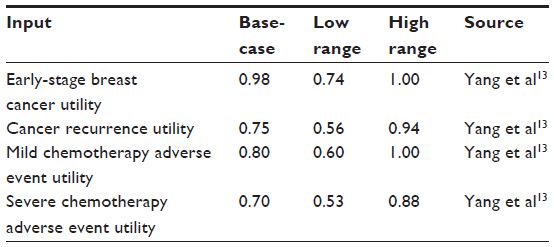 | Table 5 Utility inputs (base-case and ranges for sensitivity analyses) |
The model used several types of input data, including proportions (or probabilities), costs, and utilities of different health states. The most extensive set of input data consisted of proportions of women assessed at different levels of risk, proportions receiving chemotherapy, probabilities of AEs, and proportions experiencing recurrence and death.
Proportion of women assessed at each risk level
Both Mammostrat® and Oncotype DX® assign women as either high, moderate/intermediate, or low risk. The proportion of women assigned to each risk group depends on which risk assessment method is used; therefore, different proportions were used for Mammostrat® and Oncotype DX® in the model. For the model to generate a fair comparison between Mammostrat® and Oncotype DX® for a particular cohort of women, the proportions used for Mammostrat® should be based on the same women as the proportions used for Oncotype DX®. This goal was accomplished by using 10 year data reported in the NSABP B14 and B20 trials for Mammostrat® and Oncotype DX®.14,15
When Mammostrat® was used for risk assessment, 21% of women were classified as high risk, 21% as medium risk, and 58% as low risk. The corresponding proportions for Oncotype DX® were 26%, 22%, and 52%, respectively (Table 1).
Proportion receiving chemotherapy and related adverse events
Whereas the proportions assessed at different levels of risk by Mammostrat® and Oncotype DX® were based on actual data for similar samples of women, no such data were available for the proportion of women at each risk level who received chemotherapy. Therefore, the model used assumptions about these proportions.
These values reflect the intent of both methods of risk assessment to distinguish between women who would likely benefit from chemotherapy (high risk women) and those who would not (low risk women). Therefore, most women (80%) assessed at high risk were assumed to receive chemotherapy, whereas only a small proportion (10%) of low risk women received chemotherapy in the base-case. Intermediate risk women were treated at a rate between those at high and low risk (Table 2).
The probability of AEs was based on inputs from Yang et al,13 ranging from 0.6 for mild adverse events to 0.05 for severe adverse events.
Proportions and probabilities of recurrence
The model can generate a fair comparison between Mammostrat® and Oncotype DX® only if the estimates of recurrence for women assessed by these assays are based on the same definition of recurrence. The data available for Oncotype DX® are based on distant recurrence after 10 years, but the data for Mammostrat® patients are reported for any recurrence over the same time period. To conduct an equitable CEA, recurrence data from the literature for Mammostrat® were adjusted to account for this difference (Table 3)15 using methodology described in the supplementary materials.
A fair comparison between Mammostrat® and Oncotype DX® also requires that the estimates of recurrence for women assessed by Mammostrat® and Oncotype DX® be based on the same cohort of women. However, the sample of women used for obtaining estimates for Mammostrat® in the B14 and B20 studies was somewhat different from the sample used for Oncotype DX®. Specifically, the sample used for Mammostrat® was smaller than the sample used for Oncotype DX® because the paraffin-block trial samples were initially used in the development and validation of the Oncotype DX® test, which depleted 20% of the blocks in B14 and 30% in B20.15
As a result of the sample differences, women assessed by Mammostrat® had characteristics that differed from those of women assessed by Oncotype DX®. The most relevant aspect of this difference between the B20 samples is the overall 10 year recurrence rate: as stated explicitly in Paik et al,14 the Kaplan–Meier estimate of the proportion without any recurrence at 10 years among women assessed with Oncotype DX® was 90.1% for those receiving chemotherapy and 83.5% for those treated with tamoxifen alone; the comparable figures reported by Ross et al15 for women assessed with Mammostrat® were 88% and 83%. Although small, these differences do show that the sample on which the Oncotype DX® analysis was based had lower recurrence. This difference is a function of the sample, not the risk-assessment tool. Therefore, further adjustment beyond that described in the previous paragraphs was required to compensate for differences in the characteristics of the samples, as explained in the supplemental materials.
Table 3 shows the proportions of women recurrence-free after 10 years as reported by Paik et al14 and Ross et al,15 as well as the adjusted proportions for Mammostrat® used for the base-case analysis. The unadjusted proportions taken directly from the Paik et al14 and Ross et al15 studies were used for one sensitivity analysis.
Proportions and probabilities of death
The model assumed that death was potentially due to one of three causes:1) AEs due to chemotherapy (0.005); 2) cancer recurrence (0.05); or 3) any other cause (life expectancy tables) (Table 2).
Resource use and costs
Unit costs were based on data from Yang et al.13 The US payer cost for Mammostrat® was set at $2,650 and for Oncotype DX® at $4,290 (based on the latest public information on test pricing) (Table 4).19
Quality of life and utilities
The utility used to adjust survival for quality of life ranged from 0–1, with 0 representing death and 1 representing perfect health (Table 5). Utilities for toxicity from chemotherapy, recurrence-free states, and recurrence states were based on values obtained for a literature review performed by Yang et al.13
Model outputs
Each cycle of the model was a period of 1 year. During each cycle, the model captured costs associated with the particular state a woman occupied during that cycle, and these were tabulated to obtain the total cost for the woman over 10 years. Similarly, the model tracked the number of years the woman was alive during the 10 year period, called life years (LYs). Each year alive in a particular state was weighted by the utility assigned to that state to obtain QALYs, which were summed over the full time horizon.
The model as described was run as a Monte Carlo simulation 100 times, and the mean values for total costs, LYs, and QALYs were calculated and reported in the results section.
Sensitivity analyses
A series of one-way sensitivity analyses were performed to examine the impact of changing the value of a single variable or set of related variables. These variables were:1) use of chemotherapy by risk group; 2) proportion of chemotherapy patients experiencing AEs; 3) costs; and 4) utility values. We performed a sensitivity analysis on the 10 year risk of recurrence based on the unadjusted values as described in this Methods section. For an additional sensitivity analysis we used the unadjusted proportions, taking into account statistical significance between chemotherapy and no chemotherapy groups. Where there was no statistical significance, the average proportion for the two groups was calculated and used for both treatment groups. Table 3 shows the values for the recurrence-free proportions used in the sensitivity analyses.
Results
The CEA results are presented in two parts:1) results of the base-case analysis; and 2) important findings from the sensitivity analyses.
Base-case
In the base-case, the cost of care over a 10 year period for women assessed using Mammostrat® was $15,782, compared with a cost of $18,051 when Oncotype DX® was used. Thus, cost savings of $2,268 were associated with the use of Mammostrat®. The use of Mammostrat® and Oncotype DX® resulted in similar LYs and QALYs, with Oncotype DX® resulting in only 0.002 additional LYs and 0.005 additional QALYs (Table 6). No incremental cost-effectiveness ratio was calculated because Mammostrat® costs less than Oncotype DX®.
 | Table 6 Model results (base-case) |
Sensitivity analyses
One-way sensitivity analyses involving costs, utilities, and percentages/probabilities were conducted. Sensitivity analyses involving costs affected only the cost results, and those involving utilities affected only the QALY results.
Analyses involving chemotherapy and recurrence costs
As chemotherapy costs increased, the overall costs associated with both Mammostrat® and Oncotype DX® increased, slightly more so for Oncotype DX®. Thus, Mammostrat® showed increasing cost savings. The opposite occurred when chemotherapy costs decreased, but Mammostrat® still showed cost savings of $2,083 at the low end of the chemotherapy cost range used for the sensitivity analyses.
Increases in recurrence costs had an effect opposite to that of chemotherapy costs; as recurrence costs increased, the difference between Mammostrat® costs and Oncotype DX® costs decreased, but Mammostrat® still showed cost savings of $2,222 at the high end of the recurrence cost range used for the sensitivity analyses. Decreasing recurrence costs resulted in greater cost savings.
Varying the costs of mild and severe AEs across the range of values in the sensitivity analyses had a much smaller impact on Mammostrat® and Oncotype DX® costs, with Mammostrat® maintaining a cost saving between $2,249 at the low end of AE costs and $3,020 at the high end of AE costs. When the discount rate was increased to 5% without other changes to the base-case cost values, use of Mammostrat® showed a slightly greater cost savings of $2,284.
Analyses involving utilities
Most sensitivity analyses involving utilities had very little effect on the resulting QALYs. Varying the utilities assigned to AEs and to cancer recurrence changed the QALYs for Mammostrat® or Oncotype DX® by 0.01 in most cases, with no change in the resulting difference between Mammostrat® and Oncotype DX®.
Lowering or raising the utility of the initial state decreased or increased the QALYs for both Mammostrat® and Oncotype DX® more than changing utilities of recurrence, but the difference in QALYs between Mammostrat® and Oncotype DX® remained approximately 0.01.
Analyses involving percentages and probabilities
Two different sensitivity analyses were undertaken using sets of recurrence-free proportions that differed from the base-case (Table 7). The first used the unadjusted proportion as reported for Mammostrat® by Ross et al. In this calculation, 10 year costs associated with the use of Mammostrat® increased from the base-case to $16,253 and the QALYs decreased to 7.92. Oncotype DX® results were the same as in the base-case because nothing for Oncotype DX® was changed in this analysis. For the second sensitivity analysis, taking into account statistical significance between chemotherapy and no chemotherapy groups, costs for both Mammostrat® and Oncotype DX® decreased and QALYs for both increased, compared to their base-case values. For Mammostrat®, 10 year costs were $14,794, approximately $2,800 less than the Oncotype DX® costs of $17,580. QALYs increased to 7.97 for Mammostrat®, 0.01 higher than the Oncotype DX® value of 7.96. In this second sensitivity analysis, Mammostrat® dominated Oncotype DX®.
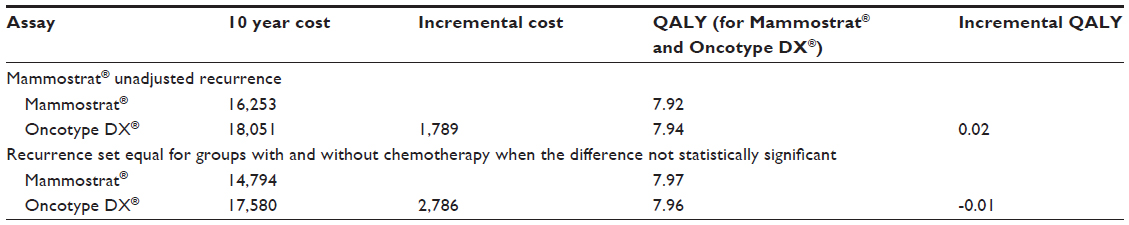 | Table 7 Model results (sensitivity analyses) |
The overall effect of simultaneously varying input values of all the variables across the ranges used for sensitivity analyses produced the scatterplot shown in Figure 3. Out of 100 Monte Carlo simulations, Mammostrat® was less costly than Oncotype DX® in every case, with savings between $1,800 and $2,550. Mammostrat® resulted in lower QALYs than Oncotype DX® in all but two simulations, but the differences never exceeded 0.01 QALY.
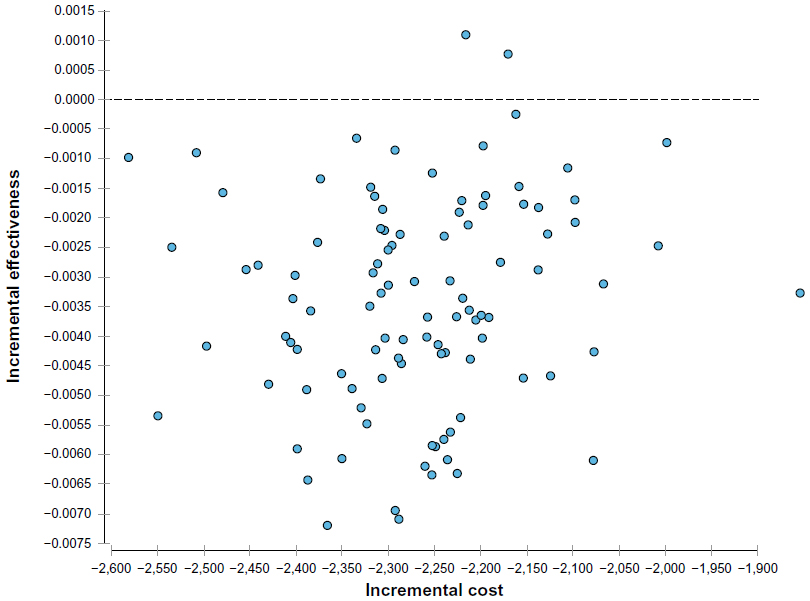 | Figure 3 Incremental effectiveness of Mammostrat® versus incremental cost (compared to Oncotype DX®). |
Discussion
The US health care system is undergoing tremendous pressures to improve quality and lower costs.20 Although CEA is not explicitly used to guide decisions about allocation of health care resources, there is concerted effort to utilize comparative effectiveness research to aid coverage and reimbursement decisions.21
New breast cancer cases exceed 200,000 per year in the US.22 Therefore, the wide use of proprietary assays for an early-stage, estrogen receptor–positive breast cancer population can represent significant costs to healthcare payers. This study’s objective was to respond to growing interest from payer, policymaker, and clinical communities to compare the effectiveness of breast cancer assays that aim to provide health benefits and achieve overall cost savings.
While the use of CEA is not yet mandated as part of technology assessments and US third-party payer reimbursement decisions, numerous peer-reviewed published studies have established that existing proprietary breast cancer assays are cost-effective when compared with non–tissue-based risk assessment tools to guide decisions about whether to treat with adjuvant chemotherapy.4–11,13 Even so, the cost-effectiveness of an assay generally means that a healthcare payer would bear an increased cost to achieve gains in effectiveness.
Our analysis using base-case inputs demonstrated that differences between outcomes (disease recurrence, LYs, and QALYs) were negligible across both groups (9.880 versus 9.882 LYs and 7.935 versus 7.940 QALYs for Mammostrat® and Oncotype DX®, respectively [Table 6]). When put in perspective, a difference in LYs of 0.002 between groups is approximately 1 day over a period of 10 years; a difference in QALYs of 0.005 is approximately 2 days over a 10 year period.
However, cost savings associated with the use of Mammostrat® instead of Oncotype DX® are approximately equivalent to the differences in costs between the two tests. In a health plan with 10,000 women using an assay to assess risk of recurrence, the use of Mammostrat® compared with Oncotype DX® might produce a cost saving of $22,680,000, based on the mean per-woman cost savings of $2,268 demonstrated by Mammostrat® in the base-case.
This comparative analysis leans heavily on data from two seminal treatment studies in early-stage breast cancer – NSABP B14 and B20 – for which the performances of both assays were analyzed. Differences between the definitions of recurrence-free survival outcomes and the samples used for the two studies meant that adjustments were necessary to obtain comparable data. The results of our sensitivity analysis demonstrate that the assumptions made about posttreatment recurrence are the primary drivers of model results.
There are several limitations to our study. We relied on aggregated data for reporting risk assessments, recurrence rates, and outcomes of patients from the B14 and B20 studies evaluated with Mammostrat® and Oncotype DX®. A direct comparison of precisely the same patients tested using both assays is not available at this time. Furthermore, as the B14 and B20 studies did not include information about how a third assay, MammaPrint®, would classify patients into risk groups, this assay was not included in the current CEA.
We also relied on adverse event and mortality rates, costs, and utility values from previous studies. However, we believe that using published data is appropriate, especially when applied similarly to both arms of the model. Overall, all assays in this oncology space would benefit from an increase in prospective and/or registry data to add clarity on patient health benefits following assay results and treatment. Such data would also reduce uncertainty surrounding the physician treatment choice following assay results. The uncertainty in the data used in this CEA, although a limitation of this study, was addressed through the sensitivity analyses, which showed a high degree of consistency in the results.
To our knowledge, this is the first comparative CEA of Mammostrat® versus Oncotype DX®, two assays used clinically to assist physicians and patients with chemotherapy-related treatment decisions in early-stage breast cancer. We found that survival and QALYs were similar when using either assay; however, costs were lower for patients assessed using Mammostrat®. When the quality and efficacy of alternative health care interventions are roughly equivalent, decision makers can rely on budget impact analyses to guide decisions about their use.
Acknowledgment
This research was funded by Clarient, a US GE Healthcare company.
Disclosure
This research was funded by Clarient, a US GE Healthcare company. Carolyn Bodnar is employed by GE Healthcare. Kuo Tong, Warren Schonfeld and Kim Mislick were paid consulting fees. The authors report no other conflicts of interest in this work.
References
Fisher B, Costantino J, Redmond C, et al. A randomized clinical trial evaluating tamoxifen in the treatment of patients with node-negative breast cancer who have estrogen-receptor-positive tumors. N Engl J Med. 1989;320(8):479–484. | |
Fisher B, Dignam J, Wolmark N, et al. Tamoxifen and chemotherapy for lymph node-negative, estrogen receptor-positive breast cancer. J Natl Cancer Inst. 1997;89(22):1673–1682. | |
Fisher B, Jeong JH, Bryant J, et al; National Surgical Adjuvant Breast and Bowel Project randomised clinical trials. Treatment of lymph-node-negative, oestrogen-receptor-positive breast cancer: long-term findings from National Surgical Adjuvant Breast and Bowel Project randomised clinical trials. Lancet. 2004;364(9437):858–868. | |
Hornberger J, Cosler LE, Lyman GH. Economic analysis of targeting chemotherapy using a 21-gene RT-PCR assay in lymph-node-negative, estrogen-receptor-positive, early-stage breast cancer. Am J Manag Care. 2005;11(5):313–324. | |
Oestreicher N, Ramsey SD, Linden HM, et al. Gene expression profiling and breast cancer care: what are the potential benefits and policy implications? Genet Med. 2005;7(6):380–389. | |
Lyman GH, Cosler LE, Kuderer NM, Hornberger J. Impact of a 21-gene RT-PCR assay on treatment decisions in early-stage breast cancer: an economic analysis based on prognostic and predictive validation studies. Cancer. 2007;109(6):1011–1018. | |
Kondo M, Hoshi SL, Ishiguro H, Yoshibayashi H, Toi M. Economic evaluation of 21-gene reverse transcriptase-polymerase chain reaction assay in lymph-node-negative, estrogen-receptor-positive, early-stage breast cancer in Japan. Breast Cancer Res Treat. 2008;112(1):175–187. | |
Chen E, Tong KB, Malin JL. Cost-effectiveness of 70-gene MammaPrint signature in node-negative breast cancer. Am J Manag Care. 2010;16(12):e333–e342. | |
Klang SH, Hammerman A, Liebermann N, Efrat N, Doberne J, Hornberger J. Economic implications of 21-gene breast cancer risk assay from the perspective of an Israeli-managed health-care organization. Value Health. 2010;13(4):381–387. | |
Retèl VP, Joore MA, Knauer M, Linn SC, Hauptmann M, Harten WH. Cost-effectiveness of the 70-gene signature versus St Gallen guidelines and Adjuvant Online for early breast cancer. Eur J Cancer. 2010;46(8):1382–1391. | |
Tsoi DT, Inoue M, Kelly CM, Verma S, Pritchard KI. Cost-effectiveness analysis of recurrence score-guided treatment using a 21-gene assay in early breast cancer. Oncologist. 2010;15(5):457–465. | |
Olivotto IA, Bajdik CD, Ravdin PM, et al. Population-based validation of the prognostic model ADJUVANT! for early breast cancer. J Clin Oncol. 2005;23(12):2716–2725. | |
Yang M, Rajan S, Issa AM. Cost effectiveness of gene expression profiling for early stage breast cancer: a decision-analytic model. Cancer. 2012;118(20):5163–5170. | |
Paik S, Tang G, Shak S, et al. Gene expression and benefit of chemotherapy in women with node-negative, estrogen receptor-positive breast cancer. J Clin Oncol. 2006;24(23):3726–3734. | |
Ross DT, Kim CY, Tang G, et al. Chemosensitivity and stratification by a five monoclonal antibody immunohistochemistry test in the NSABP B14 and B20 trials. Clin Cancer Res. 2008;14(20):6602–6609. | |
Bartlett JM, Thomas J, Ross DT, et al. Mammostrat as a tool to stratify breast cancer patients at risk of recurrence during endocrine therapy. Breast Cancer Res. 2010;12(4):R47. | |
Tang G, Shak S, Paik S, et al. Comparison of the prognostic and predictive utilities of the 21-gene Recurrence Score assay and Adjuvant! for women with node-negative, ER-positive breast cancer: results from NSABP B-14 and NSABP B-20. Breast Cancer Res Treat. 2011;127(1):133–142. | |
Weinstein MC, O’Brien B, Hornberger J, et al; ISPOR Task Force on Good Research Practices – Modeling Studies. Principles of good practice for decision analytic modeling in health-care evaluation: report of the ISPOR Task Force on Good Research Practices – Modeling Studies. Value Health. 2003;6(1):9–17. | |
Genomic Health, Inc Form 10-Q: Quarterly Report Pursuant to Section 13 or 15(D) the Securities and Exchange Act of 1934. Redwood City, CA: Genomic Health, Inc; 2012. Available from: http://investor.genomichealth.com/secfiling.cfm?filingID=1104659-12-76632&CIK=1131324. Accessed February 14, 2013. | |
US Department of Health and Human Services. 2012 Annual Progress Report to Congress. National Strategy for Quality Improvement in Health Care. Washington, DC: US Department of Health and Human Services; 2012. Available from: http://www.ahrq.gov/workingforquality/nqs/nqs2012annlrpt.pdf. Accessed February 14, 2013. | |
Donnelly J. Health policy briefs: comparative effectiveness research [homepage on the Internet]. Health Affairs; 2010 [updated October 5, 2010]. Available from: http://www.healthaffairs.org/healthpolicybriefs/brief.php?brief_id=27. Accessed October 4, 2013. | |
Jemal A, Siegel R, Xu J, Ward E. Cancer statistics, 2010. CA Cancer J Clin. 2010;60(5):277–300. | |
Arias E. United States Life Tables, 2008. In: National Vital Statistics Reports 2008;56(9). Centers for Disease Control and Prevention, National Center for Health Statistics, Hyattsville, MD. Accessed online at http://www.cdc.gov/nchs/products/pubs/pubd/nvsr/nvsr.htm. Accessed February 14, 2013. |
Supplementary materials
Both Mammostrat® and Oncotype DX® assess risk of distant recurrence for women after treatment for early-stage breast cancer. Each method of risk assessment has its associated costs, and each is intended to identify women who would benefit most from chemotherapy and those who could possibly avoid unnecessary chemotherapy because they would not likely benefit from it.
Adjustments to ensure comparable definitions of recurrence
The analysis of the cost-effectiveness of Mammostrat® compared with Oncotype DX® involves modeling the experience of women after early-stage breast cancer through progression of treatment and possible distant recurrence. Although the data available in the literature for Oncotype DX® (Paik et al1) indicate the proportion of women with or without distant recurrence after 10 years, the available data for Mammostrat® (Ross et al2) are presented in terms of any recurrence of breast cancer, which does not use the same definition. To conduct the cost-effectiveness analysis (CEA), the measurement of outcomes must be the same for both methods of risk assessment, and this requires adjusting the Mammostrat® data available in the literature that show proportions of women without any recurrence, in order to estimate proportions without distant recurrence.
To estimate the proportion of women assessed by Mammostrat® who are free of distant recurrence, an amount must be added to the proportion that are free of any recurrence. The amount of this increase can be approximated by using data reported by Paik et al.1 The data are reported separately for women who receive chemotherapy and those who do not, so that the appropriate amount of adjustment is calculated separately for each group.
For women receiving chemotherapy
In the Paik et al1 sample, the proportion of women receiving chemotherapy who were recurrence-free after 10 years was 90.1%, whereas the proportion of women receiving chemotherapy who were distant recurrence-free was 92.2%. The numerical amount of the difference between the distant recurrence-free proportion and the recurrence-free proportion was 2.1% (92.2% minus 90.1%) for women receiving chemotherapy. Therefore, this amount (2.1%) needs to be added to the proportion of women assessed using Mammostrat® who receive chemotherapy and are recurrence-free after 10 years in order to estimate the proportion receiving chemotherapy who are distant recurrence-free.
For women not receiving chemotherapy
In the Paik et al1 sample, the proportion of women not receiving chemotherapy who were recurrence-free after 10 years was 83.5%, whereas the proportion of women not receiving chemotherapy who were distant recurrence-free was 87.8%. The numerical amount of the difference between the distant recurrence-free proportion and the recurrence-free proportion was 4.3% (87.8% minus 83.5%) for women not receiving chemotherapy. Therefore, this amount (4.3%) needs to be added to the proportion of women assessed using Mammostrat® who do not receive chemotherapy and are recurrence-free after 10 years in order to estimate the proportion not receiving chemotherapy who are distant recurrence-free.
If sufficient data were available, adjustments would be made separately for each of the three levels of risk. However, the data available (from Paik et al1) only allow for separate adjustments for women receiving chemotherapy and women not receiving chemotherapy, without distinction for risk level. Therefore, the numerical amount of the adjustment to ensure comparable definitions of recurrence for women receiving chemotherapy was added to the proportion of women receiving chemotherapy who were recurrence-free for all three risk levels, and the numerical amount of the adjustment for women not receiving chemotherapy was added to the proportion of women not receiving chemotherapy who were recurrence-free for all three risk levels. These adjustments are shown in Table 3.
Adjustments to compensate for sample differences
Although the adjustments described above account for the differences in the definitions of recurrence used in the literature, this process by itself and without any other adjustments would only be adequate to ensure that the proportions are comparable if the group of women included in the research reported by Ross et al2 were identical to the group included in the research reported by Paik et al.1 However, the samples upon which the data were based were not identical, and additional adjustments are needed to compensate for potential bias that might be introduced by differences in the characteristics of the two samples.
The sample of women from the NSABP trial that was used for Mammostrat® studies was smaller than the sample that the Oncotype DX® studies used. Although the CEA uses data from the B14 and B20 trials because these are the most comparable data sets available for Mammostrat® and Oncotype DX®, the characteristics of the patients assessed by Mammostrat® and Oncotype DX® were somewhat different because the samples were different. The most relevant aspect of this difference in the samples from B20 is the overall 10-year recurrence rates: as stated explicitly in Paik et al,1 the Kaplan–Meier estimate of the proportion without any recurrence at 10 years was 90.1% for those receiving chemotherapy and 83.5% for those treated with tamoxifen alone among women assessed with Oncotype DX®, but the comparable figures reported by Ross et al2 were 88% and 83% for women assessed with Mammostrat®. Although these differences may be small, they do show that the sample upon which the Oncotype DX® clinical analysis was based had lower recurrence. This difference is a function of the samples, not of the risk assessment tool. Therefore, an adjustment is needed to compensate for the differences in the characteristics of the samples. As with the adjustment for definitions, the appropriate amount of adjustment is calculated separately for women receiving chemotherapy and those not receiving chemotherapy.
For women receiving chemotherapy
The proportion of women receiving chemotherapy who were recurrence-free after 10 years was 88.0% for the Ross et al2 sample and 90.1% for the Paik et al1 sample. The difference between the recurrence-free proportion for the Paik et al1 sample and the recurrence-free proportion for the Ross et al2 sample was 2.1% (90.1% minus 88.0%) for women receiving chemotherapy. Therefore, this amount (2.1%) needs to be added to the proportion of women assessed using Mammostrat® who receive chemotherapy and are recurrence-free after 10 years in order to compensate for the fact that the sample used for Mammostrat® assessment had a lower overall recurrence-free proportion than did the Oncotype DX® sample.
For women not receiving chemotherapy
The comparable proportions for this subgroup of women in the Ross et al2 sample was 83.0%, compared with 83.5% in the Paik et al1 sample. The difference between the recurrence-free proportion for the Paik et al1 sample and the recurrence-free proportion for the Ross et al2 sample was 0.5% (83.5% minus 83.0%) for women not receiving chemotherapy. Therefore, this amount (0.5%) needs to be added to the proportion of women assessed using Mammostrat® who do not receive chemotherapy and are recurrence-free after 10 years in order to compensate for the fact that the sample used for Mammostrat® assessment had a lower overall recurrence-free proportion than did the Oncotype DX® sample.
As was done for the adjustment to ensure comparable definitions, the numerical amount of the adjustment for women receiving chemotherapy was added to the proportion of women receiving chemotherapy who were recurrence-free for all three risk levels, and the numerical amount of the adjustment for women not receiving chemotherapy was added to the proportion of women not receiving chemotherapy who were recurrence-free for all three risk levels. These adjustments are shown in Table 3 of the manuscript.
References
Paik S, Tang G, Shak S, et al. Gene expression and benefit of chemotherapy in women with node-negative, estrogen receptor-positive breast cancer. J Clin Oncol. 2006;24(23):3726–3734. | |
Ross DT, Kim CY, Tang G, et al. Chemosensitivity and stratification by a five monoclonal antibody immunohistochemistry test in the NSABP B14 and B20 trials. Clin Cancer Res. 2008;14(20):6602–6609. |
 © 2014 The Author(s). This work is published and licensed by Dove Medical Press Limited. The
full terms of this license are available at https://www.dovepress.com/terms
and incorporate the Creative Commons Attribution
- Non Commercial (unported, 3.0) License.
By accessing the work you hereby accept the Terms. Non-commercial uses of the work are permitted
without any further permission from Dove Medical Press Limited, provided the work is properly
attributed. For permission for commercial use of this work, please see paragraphs 4.2 and 5 of our Terms.
© 2014 The Author(s). This work is published and licensed by Dove Medical Press Limited. The
full terms of this license are available at https://www.dovepress.com/terms
and incorporate the Creative Commons Attribution
- Non Commercial (unported, 3.0) License.
By accessing the work you hereby accept the Terms. Non-commercial uses of the work are permitted
without any further permission from Dove Medical Press Limited, provided the work is properly
attributed. For permission for commercial use of this work, please see paragraphs 4.2 and 5 of our Terms.