Back to Journals » Clinical Interventions in Aging » Volume 13
Correlations between bone turnover markers, serum magnesium and bone mass density in postmenopausal osteoporosis
Authors Mederle OA ![]() , Balas M
, Balas M ![]() , Ioanoviciu SD, Gurban CV, Tudor A
, Ioanoviciu SD, Gurban CV, Tudor A ![]() , Borza C
, Borza C ![]()
Received 4 April 2018
Accepted for publication 11 May 2018
Published 3 August 2018 Volume 2018:13 Pages 1383—1389
DOI https://doi.org/10.2147/CIA.S170111
Checked for plagiarism Yes
Review by Single anonymous peer review
Peer reviewer comments 2
Editor who approved publication: Dr Richard Walker
Ovidiu Alexandru Mederle,1,* Melania Balas,2,* Sorin Dumitru Ioanoviciu,3,* Camelia-Vidita Gurban,4 Anca Tudor,5 Claudia Borza6
1Department of Microscopic Morphology/Histology, Angiogenesis Research Center, 2Department of Endocrinology, 3Department of First Internal Medicine, 4Department of Biochemistry and Pharmacology, 5Department of Informatics and Medical Biostatistics, 6Department of Pathophysiology, “Victor Babes” University of Medicine and Pharmacy Timisoara, Timisoara, Romania
*These authors contributed equally to this work
Introduction: Bone mass density (BMD) is still the gold standard for the diagnosis of osteoporosis, but bone turnover markers (BTMs) can provide helpful information regarding the bone remodeling process. The aim of this study was to determine the correlations between BMD and serum levels of BTMs (tartrate-resistant acid phosphatase-5b [TRAP-5b]), bone-specific alkaline phosphatase (BSAP), estradiol (E2), and magnesium (Mg[2+]) ion concentrations in postmenopausal osteoporotic women as compared to healthy postmenopausal subjects.
Materials and methods: The study included 132 women with postmenopausal osteoporosis and 81 healthy postmenopausal women without osteoporosis. Dual-energy X-ray absorptiometry scan assessed BMD at different skeleton sites. Serum levels of E2, BSAP, and TRAP-5b were measured by enzyme linked immunosorbent assay. Serum levels of Mg(2+) were determined using the colorimetric spectrometry technique.
Results: Serum levels of BTMs were significantly higher in osteoporotic women than in controls. BSAP has a moderate sensitivity (76.5%) and specificity (84.3%) (cutoff point 21.27 U/L). At a cutoff point of 3.45 U/L, TRAP-5b presented a sensitivity of 86.3% and a higher specificity of 90.6%. Osteoporotic patients showed significantly lower concentrations of serum Mg(2+) than the control group. Mg(2+) levels correlated positively with BMD values (r=0.747, P<0.0001). Furthermore, Mg(2+) concentrations correlated positively with E2 levels (r=0.684, P<0.0001). Spine BMD correlated negatively with BSAP levels (r=-0.36, P<0.0001).
Conclusion: Our study showed that BMD correlates negatively with BTMs and positively with E2 and Mg(2+) levels. TRAP-5b presents a good specificity in identifying patients with postmenopausal osteoporosis.
Keywords: bone mass density, tartrate-resistant acid phosphatase-5b, bone-specific alkaline phosphatase
Introduction
Osteoporosis is defined by low bone mass and microarchitectural deterioration of bone tissue, with increased bone fragility and susceptibility to fractures. This deterioration of bone structure is caused by an imbalance in bone remodeling with increased osteoclasts’ activity and decreased osteoblasts’ activation.1,2
Estrogen deficiency represents a major risk factor for postmenopausal osteoporosis. It induces rapid bone loss in the early years after menopause and also slower bone loss associated with advancing age.3,4 Estrogen deficiency contributes to the osteoporosis occurrence by skeletal and extraskeletal actions. Estrogen acts directly on bone cells through its receptors on osteoblasts and osteoclasts. It maintains a balance between bone formation (by enhancing osteoblasts’ differentiation and inhibiting their apoptosis) and bone resorption (by impeding osteoclasts’ differentiation and stimulating their apoptosis). Furthermore, estrogen receptors on different bone cells (stromal cells, immune cells, and so on) influence bone homeostasis.5,6 Estrogen deficiency induces an upregulation of receptor activator of nuclear factor kappa-B ligand (RANKL) on bone marrow cells and also a decreased osteoprotegerin synthesis in osteoblasts, leading to an accelerated bone resorption.4–6
Bone mass density (BMD) (of the lumbar spine and hip), measured by dual-energy X-ray absorptiometry (DXA), is considered the gold standard for the diagnosis of osteoporosis.7,8 The Fracture Risk Assessment (FRAX) tool, used for the prediction of major fracture probability >10 years, does not include all risk factors or bone turnover markers (BTMs).8
BTMs reflect the metabolic activity of osteoblasts and osteoclasts. In serial determinations (especially resorption markers), they could identify accelerated bone turnover, associated with an increased fracture risk. These patients (fast bone losers) would respond more promptly to antiresorptive medication.9,10 Several studies confirmed that high levels of resorption markers could predict fractures, independent of BMD.11–13 Also, BTMs proved to be useful in monitoring the efficacy and adherence to the antiosteoporotic treatment.9 There are no published data regarding the sensitivity and specificity of BTMs in evaluating postmenopausal osteoporosis.
Every BTM determination presents some advantages and some limitations. Most of the bone resorption markers represent degradation products of bone collagen, with one exception, tartrate-resistant acid phosphatase (TRAP)-5b.9
TRAP presents the following two isoforms: TRAP-5a derived from macrophages and dendritic cells and TRAP-5b secreted by osteoclasts. Furthermore, serum levels of TRAP-5b reflect the number of osteoclasts and their activity.14 The serum concentration is not influenced by food intake and liver or renal diseases. It provides good sensitivity and specificity, and it correlates well with other resorption markers.15
One of the most widely used markers of bone formation is serum bone-specific alkaline phosphatase (BSAP). BSAP is expressed on the cell surface of osteoblasts, and its synthesis correlates positively with bone formation rate.10
Many trace elements (magnesium [Mg], copper, manganese, zinc, selenium, and boron) contribute to the normal development and function of the skeleton, due to their catalytic activities during bone matrix formation.16
Mg represents an important cofactor for enzymes required for the normal synthesis of bone matrix. Hypomagnesemia can act directly on the bone cells, leading to abnormal apatite crystals, and indirectly by altering parathyroid gland secretion (associated with end-organ resistance to parathormone and low vitamin D) and inducing low grade inflammation (which accelerates bone loss).17 The data regarding the correlation of fracture risk with hypomagnesemia in postmenopausal women are conflicting. Most of the authors agree that low serum Mg(2+) levels are associated with an increased risk for osteoporosis.18–20
The aim of this study was to determine the correlations between BMD and serum levels of bone resorption markers (TRAP-5b), bone formation markers (BSAP), estradiol (E2), and Mg(2+) ion concentrations in postmenopausal osteoporotic women as compared to healthy postmenopausal subjects.
Materials and methods
The study included 132 women with postmenopausal osteoporosis (at least 1 year of amenorrhea) and 81 control subjects (healthy postmenopausal women without osteoporosis), evaluated in the Outpatient Department of Endocrinology of the County Hospital, Timisoara, from September 2016 to December 2017. The inclusion criteria in the osteoporotic group were women in the postmenopausal period, with lumbar or femoral neck BMD, expressed as T-score <2.5 standard deviation (SD) (World Health Organization criteria).20 The control group included women in the postmenopausal period, with lumbar or femoral neck T-score >−2 SD.
Exclusion criteria were as follows: secondary causes of osteoporosis, other diseases that could influence the bone metabolism or electrolyte imbalance (especially Mg), fractures in the previous year, hormone replacement therapy, and any medication that could influence bone turnover.
BMD (g/cm2) was assessed using the DXA scan (Hologic device; QDR Inc., Bedford, MA, USA), performed at lumbar spine and hip, determining the T-score.
Height and weight of the subjects were recorded, and body mass index (BMI) was calculated based on the formula weight (kg)/height2 (m).
Each patient was informed about the study protocol and signed an informed consent. The study was approved by the Ethics Committee of Victor Babes University of Medicine and Pharmacy Timisoara, Romania.
For the serum markers, fasting venous blood samples were collected into preservative-free tubes and allowed to clot. After centrifugation at 2,000× g, serum samples were decanted and frozen in aliquots. The serum samples were stored frozen at −20 to −80°C (at −20°C for 5 days and at −80°C for 12 months).
E2 concentration was determined by enzyme linked immunosorbent assay (ELISA) human kit, based on the principle of competitive binding. The microtiter wells were coated with an antibody directed toward a unique antigenic site on the E2 molecule. The maximum inter- and intra-assay coefficient of variation (CV) were 6.8 and 7.25%, respectively, analytic sensitivity of 3–6 pg/mL (Human Gesellschaft fűr Biochemica und Diagnostica mbH, Wiesbaden, Germany).
Serum levels of BSAP were measured using the MicroVue BSAP human ELISA kit. BSAP is an immunoassay in a microtiter strip format, which uses a monoclonal anti-BSAP antibody coated on the strip to capture BSAP in the sample. The enzyme activity of the captured BSAP was detected with a para-nitrophenyl-phosphate (pNPP) substrate. The performance characteristics of this assay (of the Human ELISA kit utilizing) were minimum. Compared to the reference values, our detection limit 0.7 U/L, CV in circulation =5.0%–5.8%, corresponding for postmenopausal women CV =4.8%–5.2%, 14.2–42.7 U/L (Micro Vue™ BSAP; MDSS GmbH, Hannover, Germany).
TRAP-5b concentration was measured using a two-step MicroVue TRAP-5b assay. The reconstituted standards and controls were added to coated microwell plate wells along with sample diluents. Naturally occurring, inactive TRAP-5b fragments in the serum could interfere with the detection of TRAP-5b in physiological samples. This assay avoided the influence of the inactive fragments by using two different monoclonal antibodies. The assay performance was characterized by minimum detection limit 0.2 U/L, within-run CV =2.2%–3.6%, between-run CV =3.0%–4.6%, and reference values 4.3±1.5 U/L (MicroVue™ TRAP-5b; MDSS GmbH).
Serum levels of Mg(2+) ions were determined using the colorimetric spectrometry technique (VITROS Slides quantitative Mg[22+] concentration in serum with VITROS® 250 Chemistry System; Johnson & Johnson, Piscataway, NJ, USA). Minimum detection limit was 0.8 mg/dL (0.33 mmol/L), with a normal range of 1.6–2.4 mg/dL.
Statistical analysis
SPSS V17.0 for Windows (SPSS Inc., Chicago, IL, USA) was used for data entry and data analysis. The distribution of the quantitative data was studied using the Kolmogorov–Smirnov test, according to which parametric (Student’s t-test) or nonparametric (Mann–Whitney U test) tests were applied. Continuous data were expressed as mean ± SD. Categorical data were expressed as frequency and percentage. For normally distributed data, Pearson’s correlation coefficient was calculated, and for distribution-free data, Spearman’s coefficient was calculated. We performed analysis on BSAP, TRAP-5b, and Mg in study groups. Sensitivity, specificity, and receiver-operating characteristic (ROC) curve were calculated to evaluate the diagnosis performance of BTMs in detecting women with osteoporosis. The level of statistical significance was established at P<0.05.
Results
Demographical data are shown in Table 1. The osteoporotic group subjects were significantly older than the control group. Although the menopause age was similar in both groups, the E2 deprivation duration was longer in the osteoporosis group than in the control group (Table 1).
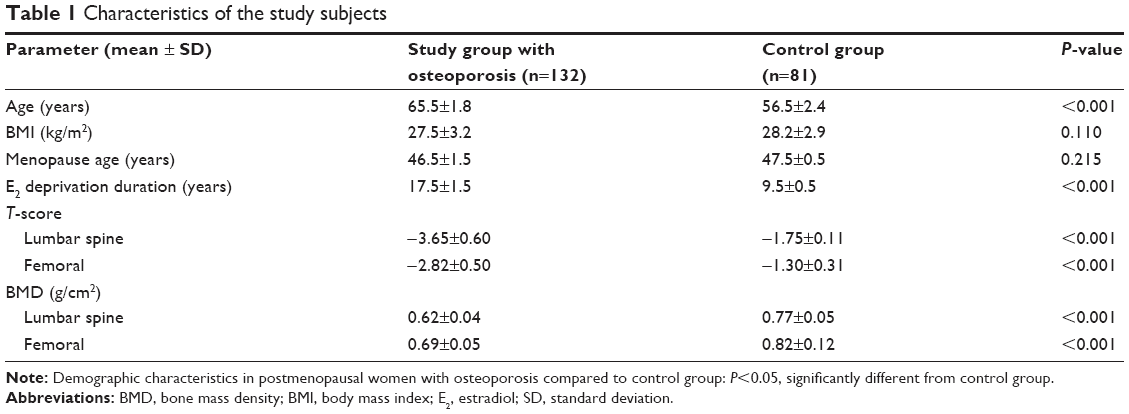 | Table 1 Characteristics of the study subjects |
The serum concentrations of E2 were significantly lower in postmenopausal women with osteoporosis than in the control group. In the study group, we found a strong, negative correlation between E2 values and age (r=−0.389, r2=0.151, 95% CI =−0.525 to −0.234, P<0.001). This correlation was not observed in the control group.
BMD determined at different sites (lumbar spine and femoral neck) revealed significantly lower values in the osteoporosis group. Furthermore, vertebral BMD was lower than femoral values in both study groups (P=0.01). BMD values correlated negatively with age (r=−0.235, r2=0.05, 95% CI =−0.390 to −0.067, P=0.006). In both groups, BMI values did not correlate significantly with BMD, or other parameters.
Biochemical test results are represented in Table 2. Serum levels of BSAP and TRAP-5b were significantly higher in the osteoporosis group than in the control group.
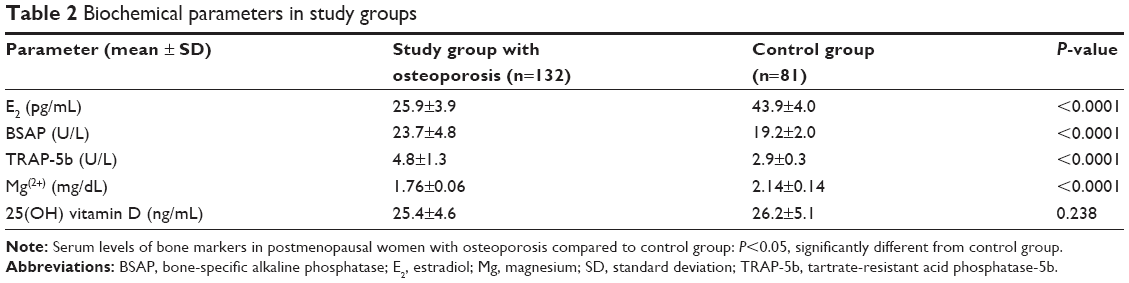 | Table 2 Biochemical parameters in study groups |
Age was significantly correlated with BSAP (r=0.408, 95% CI =0.280–0.521, P<0.0001) and TRAP-5b (r=0.654, 95% CI =0.563–0.729, P<0.0001).
Serum concentration of Mg(2+) ranged from 1.58 to 1.88 mg/dL in the osteoporosis group. Control serum levels of Mg(2+) ranged from 2.1 to 2.28 mg/dL, being significantly higher than in osteoporotic subjects (P<0.001). Mg(2+) levels were positively correlated with BMD values in all subjects (r=0.747, r2=0.548, 95% CI =0.670–0.797, P<0.001) (Figure 1). Mg(2+) concentrations correlated positively with E2 levels (r=0.684, r2=0.584, 95% CI =0.599–0.754, P<0.001). Furthermore, a negative correlation was found between E2 deprivation duration and Mg(2+) levels (r=−0.804, r2=0.646, 95% CI =−0.848 to −0.745, P<0.001). TRAP-5b did not correlate significantly with BSAP in either of the study groups.
 | Figure 1 The correlation between BMD values (g/cm2) and Mg(2+) levels in the whole study group. |
Spine BMD correlated negatively with BSAP levels in all patients (r=−0.360, 95% CI =−0.510 to −0.266, P<0.001). Moreover, the correlation was strong and negative with TRAP-5b levels (r=−0.620, 95% CI =−0.701 to −0.522, P<0.001). Serum E2 concentrations correlated positively with spine BMD measurements in both groups (r=0.757, 95% CI =0.690–0.811, P<0.001). Hip BMD did not correlate significantly with BTMs.
Mg(2+) levels did not correlate significantly with age in either group. Mg(2+) correlated negatively with BTMs, TRAP-5b levels (r=−0.610, 95% CI =−0.693 to −0.511, P<0.001), and BSAP levels (r=−0.417, 95% CI =−0.529 to −0.290, P<0.001). Vitamin D concentrations did not correlate significantly with BMD or BTMs’ values.
TRAP-5b levels correlated negatively with serum E2 concentrations in all patients (r=−0.629, 95% CI =−0.708 to −0.53, P<0.001). BSAP concentrations correlated positively with E2 levels (r=0.419, 95% CI =0.293–0.5317, P<0.001). Moreover, BSAP levels correlated negatively with the duration of E2 deprivation (r=−0.552, 95% CI =−0.645 to −0.443, P<0.0001).
ROC analysis showed that BSAP has a moderate sensitivity (76.5%) and specificity (84.3%) at a cutoff point of 21.27 U/L (area under the ROC curve 0.830, 95% CI =0.772–0.889, P<0.001) (Figure 2). At a cutoff point of 3.45 U/L, TRAP-5b presented a sensitivity of 86.3% and a higher specificity of 90.6% (area under the ROC curve 0.950, 95% CI =0.923–0.976, P<0.001) (Figure 3).
 | Figure 2 Receiver-operating characteristic curve of the BSAP, the difference between the patients with osteoporosis and healthy women. |
 | Figure 3 Receiver-operating characteristic curve of the TRAP-5b, the difference between the patients with osteoporosis and healthy women. |
Discussion
Although DXA is considered the gold standard in the diagnosis of osteoporosis, it has some limitations in predicting the risk of fracture. Alteration in bone microarchitecture (affecting bone quality) increases the fracture risk, independent of low BMD. Bone dynamics and its assessment can be evaluated by BTM.21
BTMs are considered independent risk factors for osteoporotic fractures. A significant proportion of osteoporotic fractures occurred in patients with BMD above the diagnostic criteria (T-score >−2.5 SD). Thus, determining BMD alone could be an insufficient parameter for identifying subjects at the risk of fractures. BTMs may represent an independent diagnostic tool, with prognostic value, and also a complementary parameter to BMD for evaluating the risk of fracture.22
Numerous studies confirmed the negative correlations between BMD values and BTMs.22 Higher levels of pretreatment BTMs were associated with accelerated bone loss. For the same level of a certain BTM, there are significant interindividual variations regarding bone loss. Nonetheless, in a particular patient, BTMs cannot be used as predictors for rapid bone loss.23,24 BTMs are also useful for the selection of patients who would respond better to antiosteoporotic treatment.25 Previous data showed that the negative correlation between BTMs and BMD is stronger with aging, especially in patients older than 75 years (notably resorption markers).26
Other authors showed that the correlation between BTMs and BMD is stronger in early menopause. Both types of BTMs (resorption and formation) are more increased in early postmenopausal period, due to accelerated bone resorption.24,27 The positive predictive value of BTMs for increased bone loss in elderly patients is rather low.12
In our study group, age correlated positively with BTMs, stronger with TRAP-5b as compared to BSAP, reflecting the bone dynamics. This is in accordance with other studies, which showed that in postmenopausal women, BTMs are increased, related to increased bone turnover.28
In elderly patients, BTMs are still increased, often explained by other mechanisms (vitamin D deficiency, intestinal malabsorption for calcium, and secondary hyperparathyroidism).29 In our study group, we did not observe that the negative correlation of bone resorption marker and BMD became stronger with age, as our patients were younger than 75 years.
Which are the best BTMs for the assessment of bone resorption and formation is still a debate. We choose to evaluate TRAP-5b levels, due to the low diurnal variability, and serum concentrations being uninfluenced by food or liver and kidney dysfunctions. In contrast, as a bone formation marker, we determined serum BSAP, as it is not affected by renal function, has a long circulatory half-life of 1–2 days, and is affordable.
Several meta-analyses confirmed the negative, moderate correlation between BMD and BSAP.23 In our patients, spine BMD correlated negatively with BSAP. In a previous study, we showed that BSAP levels were lower in osteoporotic patients with >15 years of estrogen deprivation.30 In the present study, BSAP levels correlated negatively with E2 deprivation period, demonstrating that the bone formation is decreasing as the E2 deprivation period increases.
Some authors suggested that BSAP concentrations could discriminate between osteoporotic and healthy postmenopausal women.31 We found a rather modest sensitivity and specificity of BSAP, compared with other studies that informed the usefulness of BSAP as a useful tool in the first assessment of osteoporotic patients.
Several studies established age-specific reference intervals for specific BTMs.32,33 Data regarding method-specific reference intervals for BSAP, or TRAP-5b, determined in large healthy pre- and postmenopausal population, are scarce in our country. This could influence the interpretation of the results.
Previous studies confirmed the negative correlation between TRAP-5b and BMD.34 In our study, correlation of BMD was stronger for TRAP-5b, reflecting the imbalance of bone remodeling processes, predominantly bone resorption. The concentrations of serum TRAP-5b were significantly higher in the osteoporotic group, as compared with nonosteoporotic patients, thus reflecting the bone loss induced by menopause. TRAP-5b showed to be a slightly better BTM (90.6% specificity) in identifying osteoporotic women than BSAP (84.3% specificity). However, none of these markers can be used alone in diagnosing osteoporosis. They are rather useful in finding patients with high turnover, thus helping to select the optimal treatment and also to assess the response to the drugs.35 In a large population-based study, which included women older than 75 years, followed-up for 9 years, high levels of TRAP-5b were associated with an increased risk of vertebral fractures.36
Some authors confirmed that TRAP-5b is independently correlated with BMD in women, proposing TRAP-5b as a screening marker for osteoporosis.37
The positive correlation of E2 levels with BMD found in our study was confirmed by many studies, attesting that E2 concentration is one of the most important factors determining BMD.4
Furthermore, in our study, increased age was associated with decreased E2 and BMD, proving that low serum E2 levels increase bone turnover, which represents a risk factor for fractures.
Odabasi et al demonstrated that BSAP and Mg play a role in bone turnover and osteoporotic aspects were associated with Mg deficiency.38
In our osteoporotic group, serum Mg(2+) concentrations were lower than in the control group. Several meta-analyses indicated similar results.20
Also, Mg(2+) levels correlated positively with E2 levels and BMD values and negatively with BTMs. These findings are probably linked to a decreased osteoblastic multiplication capacity (correlated with advancing age) and to osteoblastic apoptosis. This demonstrates the impaired bone remodeling in osteoporosis, with reduced bone formation and increased bone resorption. Mg concentration in trabecular bone is significantly lower in osteoporotic women. The role of Mg in osteoporosis is also supported by studies, which demonstrated that Mg supplementation can increase bone density and stops bone loss in a significant proportion of subjects.17
The study presents some limitations: age difference between the two groups, which could influence the analyzed data; the limited number of BTMs analyzed; and no data on BTMs’ reference values for our population.
Conclusion
Our study showed that BMD correlates negatively with BTMs and positively with E2 and Mg(2+) levels. TRAP-5b levels correlate negatively with serum E2, while BSAP correlates positively. Furthermore, BSAP levels correlated negatively with E2 deprivation duration. TRAP-5b presents a good specificity in identifying patients with postmenopausal osteoporosis.
Disclosure
The authors report no conflicts of interest in this work.
References
Feng X, McDonald JM. Disorders of bone remodeling. Annu Rev Pathol. 2011;6:121–145. | ||
Florencio-Silva R, Sasso GR, Sasso-Cerri E, Simões MJ, Cerri PS. Biology of bone tissue: structure, function, and factors that influence bone cells. Biomed Res Int. 2015;2015:421746. | ||
Ji M-X, Yu Q. Primary osteoporosis in postmenopausal women. Chronic Dis Transl Med. 2015;1(1):9–13. | ||
Khosla S, Melton JL, Riggs LB. The unitary model for estrogen deficiency and the pathogenesis of osteoporosis: is a revision needed? J Bone Miner Res. 2011;26(3):441–451. | ||
Okman-Kilic T. Estrogen deficiency and osteoporosis. In: Dionyssiotis Y, editor. Advances in Osteoporosis. (Chap. 2). London: Intech Open Limited; 2015:7–18. | ||
Gurban CV, Balas M, Zosin I, et al. Evaluation of osteoblastic/osteoclastic activity in postmenopausal osteoporosis. Rom Rev Lab Med. 2012;20(2/4):143–150. | ||
Kanis JA, Johnell O, Oden A, Johansson H, McCloskey E. FRAX and the assessment of fracture probability in men and women from the UK. Osteoporos Int. 2008;19(4):385–397. | ||
Silverman SL, Calderon AD. The utility and limitations of FRAX: a US perspective. Curr Osteoporos Rep. 2010;8(4):192–197. | ||
Wheater G, Elshahaly M, Tuck SP, Datta HK, van Laar JM. The clinical utility of bone marker measurements in osteoporosis. J Transl Med. 2013;11:201. | ||
Hlaing TT, Compston JE. Biochemical markers of bone turnover – uses and limitations. Ann Clin Biochem. 2014;51(Pt 2):189–202. | ||
Sornay-Rendu E, Duboeuf F, Boutroy S, Chapurlat RD. How to predict fragility fracture beyond 10 years? The OFELY Study. J Clin Endocrinol Metab. 2014;99(12):4690–4697. | ||
Tamaki J, Iki M, Kadowaki E, et al. Biochemical markers for bone turnover predict risk of vertebral fractures in postmenopausal women over 10 years: the Japanese Population-based Osteoporosis (JPOS) Cohort Study. Osteoporos Int. 2013;24(3):887–897. | ||
Johansson H, Odén A, Kanis JA, et al. A meta-analysis of reference markers of bone turnover for prediction of fracture. Calcif Tissue Int. 2014;94(5):560–567. | ||
Shinozaki T, Saito K, Kobayashi T, Yanagawa T, Takagishi K. Tartrate-resistant acid phosphatase 5b is a useful serum marker for diagnosis and recurrence detection of giant cell tumor of bone. Open Orthop J. 2012;6:392–399. | ||
Kuo T-R, Chen C-H. Bone biomarker for the clinical assessment of osteoporosis: recent developments and future perspectives. Biomark Res. 2017;5:18. | ||
Alghadir AH, Gabr SA, Al-Eisa ES, Alghadir MH. Correlation between bone mineral density and serum trace elements in response to supervised aerobic training in older adults. Clin Interv Aging. 2016;11:265–273. | ||
Castiglioni S, Cazzaniga A, Albisetti W, Maier JAM. Magnesium and osteoporosis: current state of knowledge and future research directions. Nutrients. 2013;5(8):3022–3033. | ||
Orchard TS, Larson JC, Alghothani N, et al. Magnesium intake, bone mineral density, and fractures: results from the women’s Health Initiative Observational Study. Am J Clin Nutr. 2014;99(4):926–933. | ||
Okyay E, Ertugrul C, Acar B, Sisman AR, Onvural B, Ozaksoy D. Comparative evaluation of serum levels of main minerals and postmenopausal osteoporosis. Maturitas. 2013;76(4):320–325. | ||
Zheng J, Mao X, Ling J, He Q, Quan J, Jiang H. Association between serum level of magnesium and postmenopausal osteoporosis: a meta-analysis. Biol Trace Elem Res. 2014;159(1–3):8–14. | ||
Shetty S, Kapoor N, Dian Bondu J, Thomas N, Paul TV. Bone turnover markers: emerging tool in the management of osteoporosis. Indian J Endocrinol Metab. 2016;20(6):846–852. | ||
Vasikaran S, Eastell R, Bruyere O, et al. Markers of bone turnover for the prediction of fracture risk and monitoring of osteoporosis treatment: a need for international reference standards. Osteoporos Int. 2011;22(2):391–420. | ||
Biver E, Chopin F, Coiffier G, et al. Bone turnover markers for osteoporotic status assessment? A systematic review of their diagnosis value at baseline in osteoporosis. Joint Bone Spine. 2012;79(1):20–25. | ||
Cavalier E, Bergmann P, Bruyère O, et al. The role of biochemical of bone turnover markers in osteoporosis and metabolic bone disease: a consensus paper of the Belgian Bone Club. Osteoporos Int. 2016;27(7):2181–2195. | ||
Szulc P. The role of bone turnover markers in monitoring treatment in postmenopausal osteoporosis. Clin Biochem. 2012;45(12):907–919. | ||
Henriksen K, Leeming DJ, Christiansen C, Karsdal MA. Use of bone turnover markers in clinical osteoporosis assessment in women: current issues and future options. Womens Health (Lond). 2011;7(6):689–698. | ||
Lenora J. Prediction of bone loss in elderly women using bone turnover markers. Galle Med J. 2015;20(1):23–29. | ||
Pardhe BD, Pathak S, Bhetwal A, et al. Effect of age and estrogen on biochemical markers of bone turnover in postmenopausal women: a population-based study from Nepal. Int J Womens Health. 2017;9:781–788. | ||
Seibel MJ. Biochemical markers of bone turnover: part I: biochemistry and variability. Clin Biochem Rev. 2005;26(4):97–122. | ||
Gurban C, Gotia L, Radulov I, et al. Correlations between the markers of bone remodeling and bone mineral density in postmenopausal osteoporosis. Acta Endocrinol (Buc). 2010;VI(1):27–44. | ||
Civitelli R, Armamento-Villareal R, Napoli N. Bone turnover markers: understanding their value in clinical trials and clinical practice. Osteoporos Int. 2009;20(6):843–851. | ||
Michelsen J, Wallaschofski H, Friedrich N, et al. Reference intervals for serum concentrations of three bone turnover markers for men and women. Bone. 2013;57(2):399–404. | ||
Guañabens N, Filella X, Monegal A, et al. Reference intervals for bone turnover markers in Spanish premenopausal women. Clin Chem Lab Med. 2016;54(2):293–303. | ||
Helleen JM, Ylipahkala H, Alatalo SL, et al. Serum tartrate-resistant acid phosphatase 5b, but not 5a, correlates with other markers of bone turnover and bone mineral density. Calcif Tissue Int. 2002;71(1):20–25. | ||
Eastell R, Szulc P. Use of bone turnover markers in postmenopausal osteoporosis. Lancet Diabetes Endocrinol. 2017;5(11):908–923. | ||
Ivaska KK, Gerdhem P, Väänänen HK, Akesson K, Obrant KJ. Bone turnover markers and prediction of fracture: a prospective follow-up study of 1040 elderly women for a mean of 9 years. J Bone Miner Res. 2010;25(2):393–403. | ||
Irie S, Hayashida N, Shinkawa T, et al. Suitability of tartrate-resistant acid phosphatase type 5b as a screening marker for bone mineral density in community-dwelling elderly individuals. Tohoku J Exp Med. 2011;224(2):105–110. | ||
Odabasi E, Turan M, Aydin A. Magnesium, calcium, zinc, copper, manganese, and selenium levels in postmenopausal women with osteoporosis. Can magnesium and calcium play a key role in osteoporosis. Ann Acad Med Singapore. 2008;37(7):564–569. |
 © 2018 The Author(s). This work is published and licensed by Dove Medical Press Limited. The
full terms of this license are available at https://www.dovepress.com/terms
and incorporate the Creative Commons Attribution
- Non Commercial (unported, 3.0) License.
By accessing the work you hereby accept the Terms. Non-commercial uses of the work are permitted
without any further permission from Dove Medical Press Limited, provided the work is properly
attributed. For permission for commercial use of this work, please see paragraphs 4.2 and 5 of our Terms.
© 2018 The Author(s). This work is published and licensed by Dove Medical Press Limited. The
full terms of this license are available at https://www.dovepress.com/terms
and incorporate the Creative Commons Attribution
- Non Commercial (unported, 3.0) License.
By accessing the work you hereby accept the Terms. Non-commercial uses of the work are permitted
without any further permission from Dove Medical Press Limited, provided the work is properly
attributed. For permission for commercial use of this work, please see paragraphs 4.2 and 5 of our Terms.