Back to Journals » Clinical Ophthalmology » Volume 14
Correlation of Baseline Visual Acuity with Outcomes of Treatment with Anti-VEGF in Neovascular Age-Related Macular Degeneration
Authors Veluswamy B, Lee A, Mirza RG ![]() , Gill MK
, Gill MK ![]()
Received 29 March 2020
Accepted for publication 7 May 2020
Published 10 June 2020 Volume 2020:14 Pages 1565—1572
DOI https://doi.org/10.2147/OPTH.S256009
Checked for plagiarism Yes
Review by Single anonymous peer review
Peer reviewer comments 2
Editor who approved publication: Dr Scott Fraser
Balaji Veluswamy, Andy Lee, Rukhsana G Mirza, Manjot K Gill
Northwestern University, Feinberg School of Medicine, Chicago, IL, USA
Correspondence: Manjot K Gill Tel +1 312 908-8152
Fax +1 312 503-8152
Email [email protected]
Purpose: Neovascular age-related macular degeneration (nv-AMD) is the leading cause of blindness in individuals 55 years and older. The advent of anti-vascular endothelial growth factor (anti-VEGF) therapy has greatly altered the visual acuity (VA) prognosis in these patients. While many studies have described treatment outcomes, few have explored the impact of early detection on VA outcomes.
Patients and Methods: This retrospective cohort study consisted of treatment-naïve eyes with nv-AMD (ICD9 diagnosis code 362.52) that were treated with bevacizumab, ranibizumab, and aflibercept by four physician investigators in a large urban tertiary center from March 2008 to October 2015. Eyes were categorized by baseline VA into good (20/50 or better), intermediate (20/50– 20/200), and poor (20/200 or worse) initial VA. VA and optical coherence tomography (OCT) findings were evaluated throughout the treatment period.
Results: 224 eyes were evaluated. Of eyes with good, intermediate, and poor initial VA, 14.1%, 37.2%, and 58.3% showed an increase in 2 or more lines of vision on LogMAR, respectively [p < 0.001], while 71.8%, 40.7%, and 16.7% of eyes had a final VA of 20/50 or better, respectively [p < 0.001]. Average final Snellen VA in eyes with good, intermediate, and poor initial VA was 20/47, 20/96, and 20/277, respectively. Change in VA for good, intermediate, and poor initial VA groups was ΔLogMAR of +0.117, +0.041, and − 0.230, respectively. Of eyes with good, intermediate, and poor baseline VA, 42.3%, 20.9%, and 20.0%, respectively, showed resolution of fluid on OCT [p = 0.003].
Conclusion: Patients with good initial VA were more likely to maintain good vision and show resolution of fluid on OCT through follow-up. Patients with poor initial VA tended to gain more vision, however, had poorer final VA. This underscores the importance of early detection and treatment of nv-AMD in maintaining superior outcomes.
Keywords: vision, anti-VEGF therapy, AMD
Introduction
Neovascular age-related macular degeneration (nv-AMD) is the leading cause of blindness in individuals 55 years and older. Inhibition of vascular endothelial growth factor (VEGF) is the cornerstone of nv-AMD treatment over the past decade. The MARINA and ANCHOR studies were amongst the first to study the effects of VEGF inhibition via ranibizumab, a recombinant humanized monoclonal antibody, on visual outcomes of patients with nv-AMD. While these studies showed that monthly treatment led to superior visual gain and greater likelihood of vision loss prevention as compared to sham or PDT,1–3 over 10% of the study participants did not enjoy the same benefits and experienced declining visual acuity throughout treatment5. The etiology for poor visual outcomes secondary to anti-VEGF therapy in some patients is likely multifactorial, including the presence of geographic atrophy and subretinal fibrosis (ref 5).
It has been hypothesized that early initiation of anti-VEGF therapy from the onset of disease leads to a lower likelihood of poor visual outcomes.5–7,10–13 While many studies have examined the outcomes of anti-VEGF therapy, few have explored the impact of early treatment on outcomes, especially long-term outcomes of more than 2 years. The ANCHOR and MARINA trials were designed to institute prompt initiation of treatment upon objective findings of CNV on OCT and fluorescein angiography (FA) per protocol.5 Subsequent retrospective studies have further explored the impact of delays in treatment on VA outcomes. A 2012 study by Muether et al suggested that a delay in treatment initiation after objective findings of CNV on FA or OCT led to irreversible loss of visual acuity.6 Another study, by Rauch et al in 2012 found that delay in treatment initiation was associated with decreased gain in visual acuity.7 Delay in treatment initiation was assessed based on patient self-reporting of duration of symptoms, such as visual distortion, changes in color vision, or development of central blurring of vision.
Measuring the latency between symptom onset and treatment initiation is prone to error when done retrospectively and measuring the latency between signs of CNV on imaging and treatment initiation does not account for disease activity prior to these objective findings. Albeit imperfect, visual acuity at treatment initiation can be used as a surrogate for the duration of nv-AMD activity, recognizing that other factors may influence baseline VA such as hemorrhage, geographic atrophy and subretinal fibrosis. The correlation of initial visual acuity to final VA outcomes was reported in the 5-year follow-up to the CATT study.16 A handful of real-world studies have examined the impact of initial VA on outcomes suggesting after one year of treatment, final VA is directly correlated with baseline VA, while change in VA is indirectly correlated with baseline VA.8,9
While the current literature suggests minimizing delay to treatment can improve visual outcomes, few studies have reported on the real-world impact of early diagnosis following more than two years of treatment. Our current study describes visual outcomes correlated with initial presenting visual acuity in patients with 1–7 years of follow-up (average 3.4 years) after treatment initiation.
Patients and Methods
The Institutional Review Board of Northwestern University Feinberg School of Medicine approved this retrospective cohort study at a large urban tertiary medical center. The study and data collection were compliant with the principles of the Declaration of Helsinki. All patient data were collected in a de-identified fashion. Individual patient consent for inclusion in this study were thus waived. Study data were obtained through direct chart review and through the Northwestern Medicine Enterprise Data Warehouse (NMEDW), a collaborative effort between Northwestern University Feinberg School of Medicine and Northwestern Memorial Healthcare Corporation to create a single repository of clinical and research data. Our study population consisted of treatment-naïve patients receiving intravitreal anti-VEGF injections from four retina specialists for the diagnosis of neovascular AMD (ICD-9 code 362.52) from March 2008 to October 2015. Other inclusion criteria include age greater than 50 years, visual acuity of HM or better at baseline, and a follow-up duration of at least one year. All four physicians used a treat and extend (TAE) protocol consisting of initial intensive monthly anti-VEGF injections until there was no evidence of exudation on OCT followed by extension of treatment interval by 1–2 weeks up until 12 weeks. If there was a mild recurrence then the interval was reduced by 1–2 weeks until the macula was dry or in the case of larger recurrences monthly treatment was re-initiated.4 Patient demographics, type of anti-VEGF agent used (bevacizumab, ranibizumab or aflibercept), number and frequency of injections, best-corrected visual acuities (BCVA) and intraocular pressure (IOP) were obtained at each office visit from the EDW database. OCT images of the affected eye were obtained from direct chart review at baseline and at last follow-up visit. OCT images of each affected eye at baseline and the last follow-up visit were directly reviewed for the presence or absence of subfoveal CNV (CNV), subretinal fluid (SRF), intraretinal fluid (IRF), and pigment epithelium detachment (PED). Best-corrected visual acuity (BCVA) and intraocular pressure (IOP) were extracted for each affected eye at the start of treatment and at time-points of 6 months, 1 year and every year thereafter until the last office visit. Visual acuity values were converted from Snellen to logMAR to allow for t-test comparisons. The number and types of injections were also tallied for each affected eye.
Eyes were then categorized by baseline visual acuity into good (Snellen 20/50 or better), intermediate (20/50–20/200), and poor (20/200 or worse) initial vision groups. Subsequent numerical and statistical analyses were performed in Microsoft Excel. The Student’s t-test was performed to compare the final visual acuities and change in visual acuity of each of the three baseline groups. It was also used to compare the number of treatment days and the number of injections needed between the three groups. Final visual acuity outcomes were then classified as good (20/50 or better), intermediate (20/50–20/200), or poor (20/200 or worse). Rates of good, intermediate, and poor final VA outcomes were compared between the three baseline groups using Chi-squared test for independence. Similarly, change in visual acuity outcomes were then classified as vision gained (+0.2 or more logMAR), vision lost (within 0.2 of initial logMAR), and unchanged vision (−0.2 or less), and rates of these outcomes were compared between the three baseline groups using Chi-squared test for independence. Finally, based on final OCT images, outcomes were categorized based on whether there was fluid present (IRF or SRF) or no fluid present (dry). The rates of eyes without macular fluid on OCT on the last day of follow up were compared between the three baseline groups using Chi-squared test for independence.
Results
Of 224 treatment-naïve eyes, 78 had good (>20/50 Snellen) initial VA, 86 had intermediate (20/50–20/200) initial VA, and 60 had poor (<20/200 Snellen) initial VA. The average initial VA of eyes with good initial VA was 20/36 (0.25 ± 0.12), while that of eyes with intermediate and poor initial VA was 20/86 (0.63 ± 0.14) and 20/471 (1.37 ± 0.34), respectively. Among eyes with good, intermediate, and poor initial VA, the average age was 78.50 ± 9.19, 81.10 ± 8.15, and 82.26 ± 6.74, respectively. Female to total ratio was 0.77, 0.71, and 0.67 for eyes with good, intermediate, and poor initial VA, respectively (Table 1). Eyes were treated for a duration of 2.8 years on average, with a range of 35 days to 7.6 years.
 |
Table 1 Patient Baseline Characteristics |
The average final VA was compared across all three baseline groups. Eyes with good initial vision had significantly better final (20/47) Snellen VA outcomes than both intermediate (20/96, p < 0.001) and poor initial vision groups (20/277, p < 0.001) (Figure 1). Eyes with intermediate initial vision also had significantly better final Snellen VA outcomes than those with poor initial vision (p < 0.001). Visual acuity outcomes were then also categorized as good (20/50 or better), intermediate (20/50–20/200), or poor (20/200 or worse) and rates of these outcomes were compared across each baseline group. Eyes with good initial vision tended to have better final vision outcomes based on this categorization than did eyes with poor initial vision. Rates of good, intermediate, and poor outcomes in eyes with good initial vision were 71.8%, 20.5%, and 7.7%, respectively, as compared to 16.7%, 26.7%, and 56.7%, respectively, in eyes with poor initial vision (Figure 2). In eyes with intermediate initial vision, rates of good, intermediate, and poor outcomes were 40.7%, 33.7%, and 25.6%, suggesting that these eyes tended to have better visual outcomes than those with poor initial vision, but worse outcomes than those with good initial vision.
 |
Figure 1 Comparison of final visual acuity between baseline groups. Notes: Figure 1 shows a boxplot comparison of final visual acuity, as measured by the LogMAR scale, between the three baseline groups. p-value (good vs intermediate) = < 0.001. p-value (good vs poor) = < 0.001. *The final visual acuity of those in the good initial visual acuity group was significantly higher than those in the intermediate initial visual acuity group. †The final visual acuity of those in the intermediate initial visual acuity group was significantly higher than those in the poor initial visual acuity group. |
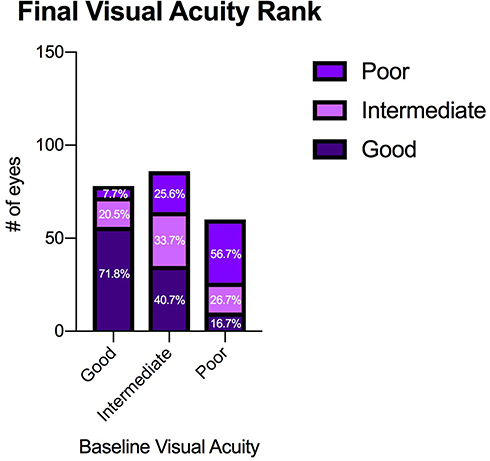 |
Figure 2 Comparison of final visual acuity rank between baseline groups. Notes: Figure 2 shows the proportion of eyes with good, intermediate, and poor visual outcomes, compared across all three baseline groups. Eyes with good initial visual acuity tended to have the highest proportion of good visual outcomes, whereas eyes with poor initial visual acuity tended to have the highest proportion of poor visual outcomes. p-value = < 0.001. |
The average change in VA was compared across all three baseline groups (Figure 3). Eyes with poor initial vision (ΔLogMAR = −0.230) had significantly greater gain in Snellen VA than did eyes with good (ΔLogMAR = 0.117) and intermediate (ΔLogMAR = 0.041) initial vision. There was no significant difference in the change in VA between eyes in the good and intermediate vision groups. Change in VA outcomes were similarly categorized as gained (ΔLogMAR < −0.2), unchanged (|ΔLogMAR| < 0.2), or lost (ΔLogMAR > 0.2) and the rates of these outcomes were compared across each baseline group (Figure 4). Eyes in each baseline group had significantly different rates of these outcomes as determined by Chi-squared test for independence. Rates of change in VA outcomes categorized as gained, unchanged, and lost were 14.1%, 65.4%, and 20.5%, respectively, in eyes with good initial VA. In comparison, eyes with poor initial VA tended to have more eyes in the gained category and fewer in the unchanged category, with 58.3%, 21.7%, and 20.0% of eyes categorized as gained, unchanged, and lost, respectively. Compared to the outcomes of eyes with good and poor initial vision, the rates of gained, unchanged, and lost outcomes were more evenly distributed in eyes with intermediate initial vision, with 37.2%, 30.2%, and 32.6% falling into each category, respectively.
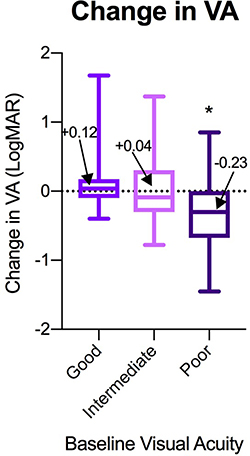 |
Figure 3 Comparison of change in visual acuity between baseline groups. Notes: Figure 3 shows a boxplot comparison of change in visual acuity, as measured by the LogMAR scale, between the three baseline groups. *The gain in visual acuity of those in the poor initial visual acuity group was significantly higher than those in either the good or intermediate initial visual acuity groups. |
 |
Figure 4 Comparison of change in visual acuity rank between baseline groups. Notes: Figure 4 shows the proportion of eyes that gained, lost, or had unchanged visual acuity. Eyes with poor initial visual acuity tended to have the highest proportion of gained visual acuity. On the other hand, eyes with good initial visual acuity tended to have the highest proportion of unchanged visual acuity. |
The rates of resolution of subretinal and intraretinal fluid on OCT were compared across all three baseline groups (Figure 5). Of note, 42.3% of eyes with good initial vision tended to show resolution of fluid on final OCT, a significantly higher rate than the 20.9% and 20.0% seen in eyes with intermediate and poor initial vision, respectively. Interestingly, none of the three baseline groups had a majority of eyes show resolution of fluid on OCT.
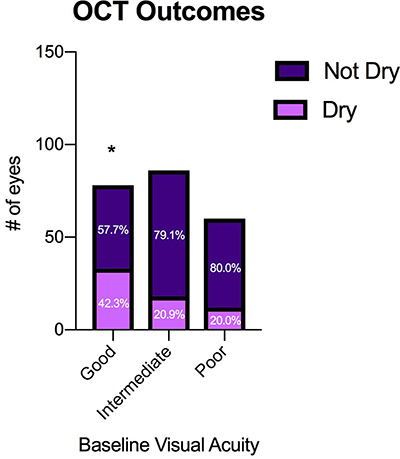 |
Figure 5 Comparison of OCT outcomes between baseline groups. Notes: Figure 5 shows the proportion of patients with dry OCT outcomes, compared across all three baseline groups. *A significantly greater proportion of eyes with good initial visual acuity had dry OCT outcomes than those with intermediate or poor initial visual acuity. |
Finally, the number of treatment days, average number of injections and anti-VEGF agent used were compared between the three baseline groups. A total of 65 eyes were treated initially with bevacizumab, 151 with ranibizumab, and 114 with aflibercept, with some eyes switching agents during the course of therapy. A total of 22 (28%), 24 (28%), and 19 (32%) eyes in the good, intermediate, and poor initial vision groups, respectively, were treated with bevacizumab. A total of 48 (62%), 59 (69%), and 44 (73%) eyes in the good, intermediate, and poor initial vision groups, respectively, were treated with ranibizumab. A total of 49 (63%), 42 (49%), and 23 (28%) eyes in the good, intermediate, and poor initial vision groups, respectively, were treated with aflibercept. Statistical analysis was difficult to perform due to the smaller sample size and some eyes having received more than one agent during the course of treatment. Overall rates of treatment, however, with each anti-VEGF agent were fairly similar across all three baseline groups. Of note, a higher percentage of eyes in the good initial vision group were treated with aflibercept than in the intermediate and poor initial vision groups. Eyes in the good, intermediate, and poor initial vision groups underwent treatment for 2.91, 2.92, and 2.67 years on average, respectively. Student’s t-test did not reveal a significant difference in the number of treatment days between any of the three groups (p-values: 0.982 [good vs intermediate], 0.461 [good vs poor], and 0.455 [intermediate vs poor]) (Table 2). The number of average injections (21.3, 19.7, and 19.8 in the good, intermediate and poor initial vision groups, respectively) was not statistically different (p-values: 0.444 [good vs intermediate], 0.555 [good vs poor], and 0.972 [intermediate vs poor]) (Table 2).
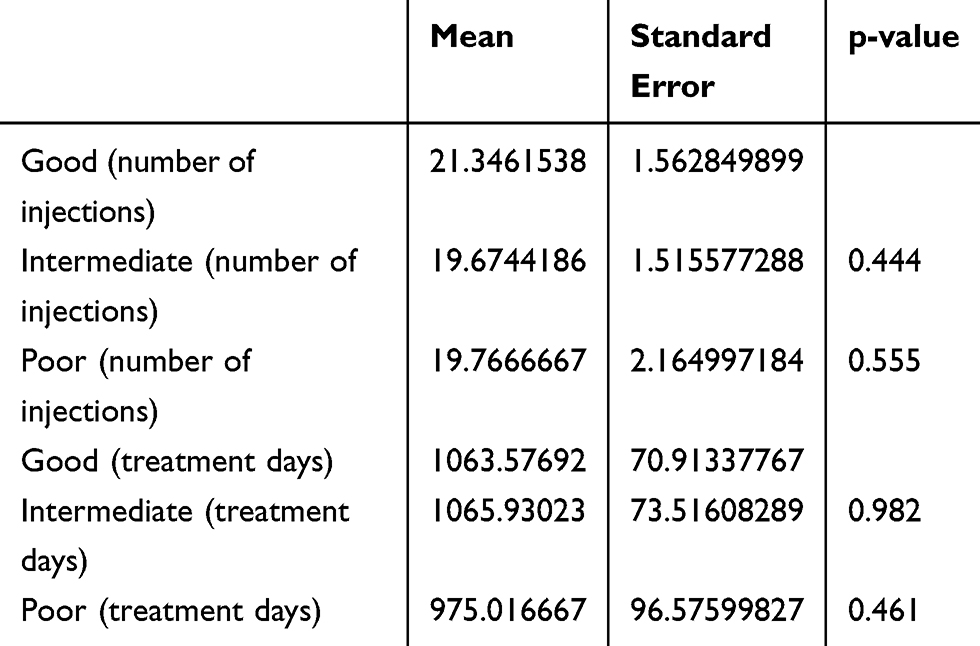 |
Table 2 Comparison of Treatment Days and Number of Injections Between Baseline Groups |
Discussion
In this retrospective cohort study, 224 treatment-naïve eyes with nv-AMD, of varying baseline visual acuities, were treated with a treat-and-extend regimen of anti-VEGF therapy between March 2008 and October 2015 up to a seven year (average 3.4 years) follow-up period. The eyes were grouped based on their initial visual acuity as good (20/50 or better), intermediate (20/50–20/200), or poor (20/200 or worse). The final visual acuity, change in visual acuity, number of injections, duration of treatment and OCT findings were compared among the three baseline groups. The results of our study correlate baseline visual acuity with final visual acuity and suggest the importance of early detection and treatment of nv-AMD by showing superior visual outcomes in those patients with good initial vision.
Based on our results, the patients with good initial vision tended to have the best final visual acuity across the three baseline groups, with average final Snellen VA of 20/47 compared to final acuity of 20/96 and 20/277 for the intermediate and poor initial VA groups, respectively. On the other hand, patients with good initial VA were least likely to gain vision. A significantly greater proportion of eyes with good initial visual acuity (65.4%) had mostly unchanged visual acuity throughout treatment as compared to eyes in the intermediate (30.2%) and poor (21.7%) vision groups as there is likely a ceiling effect with respect to further improvement of vision. The more favorable visual outcomes in the better baseline VA group may be related to the higher rates of fluid resolution on OCT (42.3%) in those with good initial VA compared to 20% in the intermediate and poor groups. In comparison, the Comparision of Age-Related Macular Degeneration Treatment Trial (CATT) showed only 17% of eyes had resolved fluid on final OCT at 5-year follow-up.14 This does suggest that treatment in patients with better initial VA may be more successful at achieving resolution of fluid on OCT and better final visual outcomes. Conversely, the higher rates of persistent exudation seen among those with intermediate vision may explain the greater percentage of eyes (32.6%) who lost vision compared to those in the good initial vision group (20.5%).
Patients with poor initial vision tended to have the worst final visual acuities between the three groups. However, they also gained the most visual acuity over the course of treatment compared to the other groups. In fact, only patients in the poor initial visual acuity group (ΔLogMAR = −0.230) experienced an average gain in visual acuity over the course of treatment, while those in the good (ΔLogMAR = 0.117) and intermediate (ΔLogMAR = 0.041) visual acuity groups experienced an average loss. As expected, eyes with intermediate vision had poorer final vision outcomes and did not show a gain in vision. These findings demonstrate superior visual outcomes in those with good initial vision, suggesting that initiating treatment as soon as visual acuity begins to decline is of utmost importance in the treatment of nv-AMD. The number of injections and duration of treatment were also evaluated as to whether they were influenced by the initial visual acuity. Our study found no significant difference amongst the three groups suggesting the overall course of treatment was fairly similar.
Our findings parallel those of other studies examining the effect of early treatment initiation on visual outcomes. A retrospective cohort study conducted by Rauch et al examined the relationship between days of symptoms prior to treatment onset and visual outcomes after 8 weeks of intravitreal ranibizumab therapy.7 Patients in their study were allocated to three groups based on duration of symptoms prior to treatment onset. Group I had symptoms for less than 1 month, Group II had 1–6 months of symptoms, and Group III had more than 6 months of symptoms. Their study found that Group I had the highest visual acuity before (20/50) and after (20/41) treatment. They also demonstrated that only Group I had a statistically significant increase in visual acuity. These findings similar to ours, support that patients treated earlier in the course of their disease tend to have better visual outcomes. While their study suggests that early initiation of treatment leads to improved visual outcomes 8 weeks after treatment initiation, our study demonstrates that following several years of treatment, average visual acuity will tend to decrease, even in those patients presenting with better baseline visual acuity. These findings mirror those of the CATT study, wherein the average visual acuity decreased from 62.2 to 58.9 ETDRS letters over 5 years of follow up.14 Our study, however, does show a significantly greater proportion of eyes in the good initial visual acuity group (65.4%) maintained vision as compared to the intermediate (30.2%) and poor (21.7%) initial visual acuity groups. This suggests a sustained benefit to early treatment initiation with ongoing follow up and treatment.
A prospective study conducted by Muether et al reported on outcomes in a German AMD population that experienced a delay in therapy after indications for treatment had been met on fluorescein angiography or OCT.6 On average, patients in this study experienced treatment delays of 23.5 days. When compared to a study by Gerding et al, which was not characterized by delays to treatment initiation, the authors noted a significantly greater portion of their participants experienced a decrease of 5 or more ETDRS letters.15 While almost 30% of the participants in the Muether et al study experienced a decrease of 5 or more letters over 12 months, less than 10% in the Gerding et al study experienced a similar decrease over a similar period of time. In our study, 20.5% of eyes with good initial vision lost 2 or more lines of LogMAR VA, whereas 32.6% of eyes with intermediate initial vision lost 2 or more lines. The results of our study parallel both of these reports, supporting earlier initiation of anti-VEGF treatment reduces likelihood of significant vision loss.
To our knowledge, this is the first study to examine the effect of baseline visual acuity at the time of initiation of anti-VEGF therapy on visual outcomes of greater than 2 years. While this represents our study’s main strength, there are several key limitations. Given the retrospective nature of this study, there is a wide range of treatment duration in our population. In addition, using visual acuity at presentation as a surrogate for delay to treatment initiation introduces a host of confounding variables. For example, some patients’ visual acuities could have been affected by other ocular conditions, including cataracts whereas for other patients, the degree of hemorrhage, geographic atrophy and subretinal fibrosis could significantly impact baseline visual acuity and also influence final visual acuity outcomes.5
Conclusion
In conclusion, our study underscores the necessity of prompt initiation and maintenance of anti-VEGF therapy in patients presenting with good initial visual acuity to ensure the best final visual outcome. Although patients with poor initial acuity tended to gain the most vision, they overall suffered from poorer final visual outcomes. Future studies aimed at earlier detection of nv-AMD and identification of eyes at risk of exudation are needed to ensure timely intervention.
Acknowledgments
This work was supported in part by the Northwestern Medicine Enterprise Data Warehouse.
Disclosure
The authors report no conflicts of interest in this work.
References
1. Rosenfeld PJ, Brown DM, Heier JS, et al. Ranibizumab for neovascular age-related macular degeneration. N Engl J Med. 2006;355(14):1419–1431. doi:10.1056/NEJMoa054481
2. Lalwani GA, Rosenfeld PJ, Fung AE, et al. A variable-dosing regimen with intravitreal ranibizumab for neovascular age-related macular degeneration: year 2 of the PrONTO study. Am J Ophthalmol. 2009;148(1):43–58.e41. doi:10.1016/j.ajo.2009.01.024
3. Brown DM, Michels M, Kaiser PK, Heier JS, Sy JP, Ianchulev T. Ranibizumab versus verteporfin photodynamic therapy for neovascular age-related macular degeneration: two-year results of the ANCHOR study. Ophthalmology. 2009;116(1):57–65.e55. doi:10.1016/j.ophtha.2008.10.018
4. Freund KB, Korobelnik JF, Devenyi R, et al. Treat-and-extend regimens with Anti-VEGF agents in retinal diseases: a literature review and consensus recommendations. Retina. 2015;35(8):1489–1506. doi:10.1097/IAE.0000000000000627
5. Lim JH, Wickremasinghe SS, Xie J, et al. Delay to treatment and visual outcomes in patients treated with anti-vascular endothelial growth factor for age-related macular degeneration. Am J Ophthalmol. 2012;153(4):
6. Muether PS, Hoerster R, Hermann MM, Kirchhof B, Fauser S. Long-term effects of ranibizumab treatment delay in neovascular age-related macular degeneration. Graefes Arch Clin Exp Ophthalmol. 2013;251(2):453–458. doi:10.1007/s00417-012-2038-0
7. Rauch R, Weingessel B, Maca SM, Vecsei-Marlovits PV. Time to first treatment: the significance of early treatment of exudative age-related macular degeneration. Retina. 2012;32(7):1260–1264. doi:10.1097/IAE.0b013e3182018df6
8. Bloch SB, la Cour M, Sander B, et al. Predictors of 1-year visual outcome in neovascular age-related macular degeneration following intravitreal ranibizumab treatment. Acta Ophthalmol. 2013;91(1):42–47. doi:10.1111/j.1755-3768.2011.02268.x
9. Cohen SY, Dubois L, Ayrault S, et al. Ranibizumab for exudative AMD in a clinical setting: differences between 2007 and 2010. Graefes Arch Clin Exp Ophthalmol. 2013;251(11):2499–2503. doi:10.1007/s00417-013-2338-z
10. Muether PS, Hermann MM, Koch K, Fauser S. Delay between medical indication to anti-VEGF treatment in age-related macular degeneration can result in a loss of visual acuity. Graefes Arch Clin Exp Ophthalmol. 2011;249(5):633–637. doi:10.1007/s00417-010-1520-9
11. Rasmussen A, Brandi S, Fuchs J, et al. Visual outcomes in relation to time to treatment in neovascular age-related macular degeneration. Acta Ophthalmol. 2015;93(7):616–620. doi:10.1111/aos.12781
12. Takahashi H, Ohkubo Y, Sato A, et al. Relationship between visual prognosis and delay of intravitreal injection of ranibizumab when treating age-related macular degeneration. Retina. 2015;35(7):1331–1338. doi:10.1097/IAE.0000000000000513
13. Oliver-Fernandez A, Bakal J, Segal S, Shah GK, Dugar A, Sharma S. Progression of visual loss and time between initial assessment and treatment of wet age-related macular degeneration. Can J Ophthalmol. 2005;40(3):313–319. doi:10.1016/S0008-4182(05)80074-2
14. Maguire MG, Martin DF, Ying GS, et al. Five-year outcomes with anti-vascular endothelial growth factor treatment of neovascular age-related macular degeneration: the comparison of age-related macular degeneration treatments trials. Ophthalmology. 2016;123(8):1751–1761. doi:10.1016/j.ophtha.2016.03.045
15. Gerding H, Loukopoulos V, Riese J, Hefner L, Timmermann M. Results of flexible ranibizumab treatment in age-related macular degeneration and search for parameters with impact on outcome. Graefes Arch Clin Exp Ophthalmol. 2011;249(5):653–662. doi:10.1007/s00417-011-1636-6
16. Ying GS, Maguire MG, Pan W, et al. Baseline predictors for five-year visual acuity outcomes in the comparison of AMD treatment trials. Ophthalmol Retina. 2018;2(6):525–530. doi:10.1016/j.oret.2017.10.003
 © 2020 The Author(s). This work is published and licensed by Dove Medical Press Limited. The
full terms of this license are available at https://www.dovepress.com/terms
and incorporate the Creative Commons Attribution
- Non Commercial (unported, 3.0) License.
By accessing the work you hereby accept the Terms. Non-commercial uses of the work are permitted
without any further permission from Dove Medical Press Limited, provided the work is properly
attributed. For permission for commercial use of this work, please see paragraphs 4.2 and 5 of our Terms.
© 2020 The Author(s). This work is published and licensed by Dove Medical Press Limited. The
full terms of this license are available at https://www.dovepress.com/terms
and incorporate the Creative Commons Attribution
- Non Commercial (unported, 3.0) License.
By accessing the work you hereby accept the Terms. Non-commercial uses of the work are permitted
without any further permission from Dove Medical Press Limited, provided the work is properly
attributed. For permission for commercial use of this work, please see paragraphs 4.2 and 5 of our Terms.