Back to Journals » Clinical Pharmacology: Advances and Applications » Volume 10
Correlation between measured and calculated free phenytoin serum concentration in neurointensive care patients with hypoalbuminemia
Authors Javadi SS, Mahjub R, Taher A, Mohammadi Y ![]() , Mehrpooya M
, Mehrpooya M
Received 3 September 2018
Accepted for publication 29 October 2018
Published 13 December 2018 Volume 2018:10 Pages 183—190
DOI https://doi.org/10.2147/CPAA.S186322
Checked for plagiarism Yes
Review by Single anonymous peer review
Peer reviewer comments 2
Editor who approved publication: Professor Arthur E. Frankel
Seyyede-Sareh Javadi,1 Reza Mahjub,2 Abbas Taher,3 Younes Mohammadi,4 Maryam Mehrpooya1
1Department of Clinical Pharmacy, School of Pharmacy, Hamadan University of Medical Sciences, Hamadan, Iran; 2Department of Pharmaceutics, School of Pharmacy, Hamadan University of Medical Sciences, Hamadan, Iran; 3Department of Anesthesiology and Critical Care, Hamadan University of Medical Sciences, Hamadan, Iran; 4Modeling of Noncommunicable Diseases Research Center, School of Public Health, Hamadan University of Medical Sciences, Hamadan, Iran
Purpose: In critically ill patients, monitoring free phenytoin concentration is a valuable method for phenytoin-dosage adjustment. However, due to technical difficulties and the high cost of these methods, the Sheiner–Tozer equation is routinely used for estimating free phenytoin concentration in clinical practice. There have been conflicting results concerning accuracy and precision of the Sheiner–Tozer equation for prediction of free phenytoin concentration in various patient populations. Therefore, this study was conducted to evaluate the accuracy and correlation of measured and calculated free phenytoin concentrations in neurointensive care patients with hypoalbuminemia.
Methods: A total of 65 adult neurointensive care patients with hypoalbuminemia who were receiving phenytoin for prevention or treatment of seizures were recruited in this study. In addition to measuring free phenytoin concentration by HPLC, free phenytoin concentration was calculated using both conventional and revised Sheiner–Tozer equations. Eventually, the correlation and level of agreement between measured and calculated free phenytoin concentrations were evaluated.
Results: The mean albumin concentration of studied patients was 2.63±0.57 g/dL. There was a significant but weak–moderate correlation between measured and calculated free phenytoin concentration using conventional and revised Sheiner–Tozer equations (r=0.45 and r=0.43, respectively). Conventional and revised Sheiner–Tozer equations were not able to predict free phenytoin concentrations accurately in 33.85% and 35.4% of patients, respectively. Although the sex of patients did not have a significant impact on the level of agreement, younger patients had a higher level of agreement.
Conclusion: Although there was a moderate correlation between calculated and measured free phenytoin concentration, the Sheiner–Tozer equation was not able to predict free phenytoin concentration accurately in all patients, especially in older patients. Therefore, monitoring free phenytoin serum concentration besides clinical outcomes should be considered for phenytoin-dose adjustment in critically ill patients.
Keywords: phenytoin, therapeutic drug monitoring, intensive care patients, Sheiner–Tozer equation
Introduction
Phenytoin is an antiepileptic agent that is commonly used for prophylaxis and treatment of seizure in neurointensive care patients caused by different etiological factors, such as traumatic brain injury, intracranial hemorrhage (ICH), and subarachnoid hemorrhage.1–4 Phenytoin possesses complex pharmacokinetic characteristics: it has high plasma protein binding (~90%), a narrow therapeutic window, and wide interindividual variability. Due to its nonlinear pharmacokinetics, small changes in phenytoin dose may result in great changes in phenytoin’s serum concentration. The free drug is considered a pharmacologically active form of phenytoin, and is responsible for its therapeutic and toxic effects.5–7 Multiple factors, including hypoalbuminemia, concomitant medication, comorbidities, and increased hepatic metabolism, can alter free and total phenytoin concentration.8–10 Therefore, therapeutic drug monitoring is usually recommended for phenytoin, particularly in the presence of hypoalbuminemia or other conditions affecting drug serum concentration.4 Routinely, total serum concentration is used for monitoring of phenytoin serum concentration, because this test is widely available and relatively inexpensive. However, results of several studies have shown that total serum concentration may not be a good therapeutic target for dose adjustment in all patients, because the free drug concentration, which is responsible for the therapeutic and toxic effects of phenytoin, is highly affected by several conditions, eg, hypoalbuminemia.11,12
In critically ill patients, multiple factors that lead to hypoalbuminemia, such as advanced age, severe infection, inflammation, malnutrition, uremia, and liver failure can alter free phenytoin concentration.13 Therefore, intensive-care unit (ICU) patients are at higher risk of toxic or subtherapeutic serum concentration, which justifies the significance of free phenytoin-concentration monitoring in such patients.14 However, due to the technical difficulties, costliness, and time-consuming nature of methods for measuring free phenytoin concentration, it is estimated by various theoretical equations in routine clinical practice. The conventional Sheiner–Tozer equation uses the value of total phenytoin serum concentration and simultaneous albumin to predict free phenytoin concentration in the presence of hypoalbuminemia.15 However, there are conflicting results concerning its accuracy and precision for prediction of free phenytoin concentration. Results of several studies have demonstrated that this equation is an inaccurate predictor for phenytoin-dose adjustment in all patients, because in addition to hypoalbuminemia, several other factors, such as renal and liver dysfunction, as well as concomitant-medication consumption, can alter free phenytoin concentration, especially in critically ill patients.16 Considering the impact of these factors on free phenytoin concentration, some studies have used a revised Sheiner–Tozer equation containing different coefficients to improve the accuracy of the equation for prediction of free phenytoin concentration. However, these studies have demonstrated conflicting results.17
It seems that multiple factors, such as patient population, albumin concentration, sampling time, free phenytoin-assay temperature, age of patients, renal function, and concomitant medications, have contributed to the conflicting results of these studies.15 Considering the conflicting results of previous studies, we aimed to design a study in which the confounding effects of some factors, such as renal and liver dysfunction, as well as drug interactions, have been removed and evaluate the level of agreement and correlation between measured and calculated free phenytoin concentrations, using both conventional and revised Sheiner–Tozer equations in neurointensive care patients with hypoalbuminemia.
Methods
Study population and setting
This was a prospective observational study conducted in the neurointensive care unit of Besat Hospital, affiliated with Hamadan University of Medical Sciences, Hamadan, Iran between June 2016 and October 2017. The study protocol was approved by the ethics committee of Hamadan University of Medical Sciences (IR.UMSHA.REC.1395) and informed written consent form obtained from all participants or their legally authorized representatives. This study was conducted in accordance with the Declaration of Helsinki.
Patients aged 18–65 years admitted to the ICU due to traumatic brain injury, subarachnoid hemorrhage, or ICH and receiving intravenous (IV) phenytoin for prophylaxis or treatment of seizures were enrolled in this study. Inclusion criteria were hypoalbuminemia (serum albumin <3.5 g/dL), absence of second- or third-degree cardiac blockage, and absence of bradycardia and significant hypotension. Patients were excluded if there were presence of hepatic or renal failure, consumption of concomitant medications interfering with phenytoin protein binding or metabolism, such as valproic acid, phenobarbital, heparin, or sulfonamides, and transfusion of blood products and albumin during the study period. Serum albumin levels were categorized into three groups according to the study by Buckley et al: mild hypoalbuminemia (3–3.5 g/dL), moderate hypoalbuminemia (2.5–3 g/dL), and severe hypoalbuminemia (<2.5 g/dL).13 Relevant demographic and clinical characteristics, including age, sex, body-mass index, ICU-admission indication, serum albumin level, creatinine concentration, total bilirubin concentration, and Glasgow Coma Scale on admission, were recorded for all patients.
Patients received phenytoin sodium as an IV loading dose of 15–20 mg/kg, followed by maintenance doses of 4–7 mg/kg/day (divided in three doses), administered by IV infusion at 8-hour intervals. On the fourth day of treatment (the time by which phenytoin is expected to reach the steady-state level), 5 mL blood samples were collected to obtain phenytoin trough serum concentration (30 minutes before the next dose). Blood samples were centrifuged at room temperature for 10 minutes at 3,500 rpm. Serum samples were divided into two parts: one used to measure the total phenytoin serum concentration, and the remaining one filtered through an ultrafilter (Amicon, cutoff 10,000 Da) to measure free fraction.
An isocratic HPLC method was developed for analysis of total and free phenytoin serum concentrations. The mobile phase consisted of water (prepared by reverse osmosis) and analytical-grade acetonitrile (55:45; Merck, Darmstadt, Germany). The flow rate was 1 mL/min, and the analysis was performed at room temperature. Proteins of samples were precipitated with the addition of acetonitrile and centrifuged at 9,000 rpm. About 20 µL supernatant was injected into the HPLC column (C18 [5 µm, 25×0.46 cm]) for determination of free and total phenytoin concentration. Samples were introduced to the HPLC column through a Rheodyne injector fitted with a 100 µL loop. The in-house LC method was validated by spiking the predetermined concentrations of free phenytoin as 0.5, 1, 3, 5, 10, and 15 µg/mL in blank serum. The experiment was performed in triplicate. The method was proven to be linear over the studied concentrations, with a regression coefficient of 0.9946. Calculated interday and intraday precision and accuracy were in an acceptable range according to ICH guidelines for validation of analytical methods in biological fluids (Table 1). The limit of detection and limit of quantification, determined using signal:noise ratio, were 0.25 µg/mL and 0.43 µg/mL, respectively. Recovery of phenytoin from serum was calculated as 75.6%±3.24%.
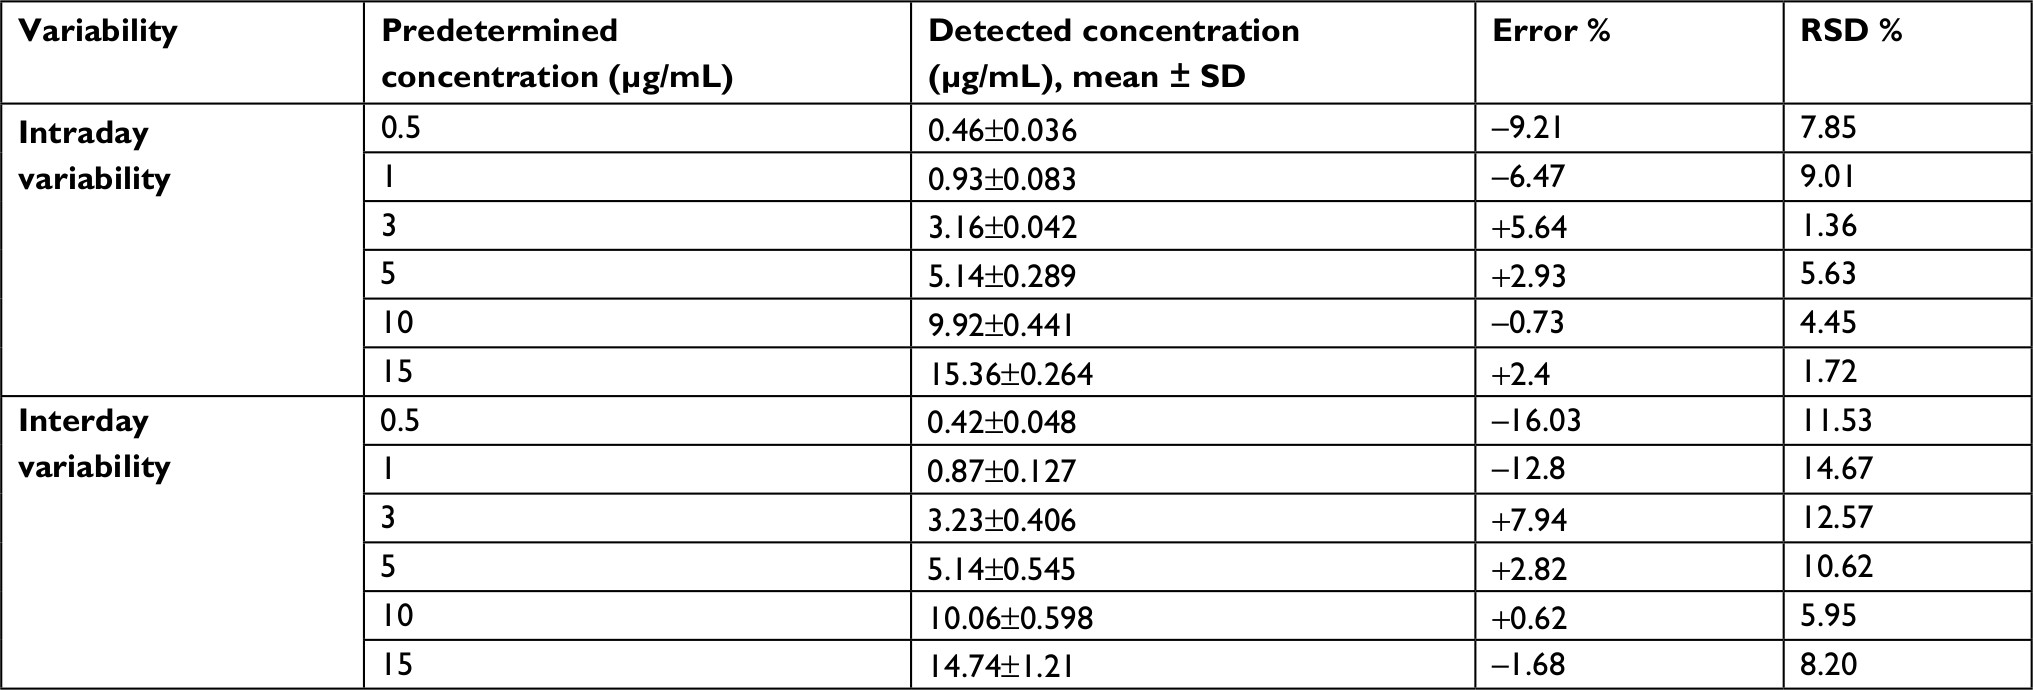 | Table 1 Accuracy and precision of the analytical method developed for detection of phenytoin in human serum (n=3) |
In addition to direct measurement, free phenytoin serum concentrations were also calculated using both conventional and revised Sheiner–Tozer equations as the study by Kane et al:17,18
1) Conventional equation:
|
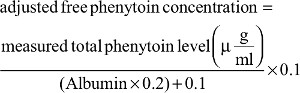
2) Revised equation:
|

Eventually, correlations and level of agreement between measured and calculated free phenytoin concentrations were evaluated in all patients, considering the effect of patients’ sex and age-group (>55 years and <55 years) on the extent of agreement.
Sample-size calculation and data analysis
A sample of 65 patients was calculated on the basis of the expected mean serum concentration of phenytoin (40 µg/mL) as a primary outcome measure, considering a=5% and accuracy level 3 µg/mL. Data obtained were analyzed by SPSS version 16.0 (SPSS, Chicago, Ill, USA). The χ2 and independent t-tests were used to analyze qualitative and quantitative variables. Also, Pearson analysis was used to assess correlations. P<0.05 was considered significant.
Results
A flow diagram of patients is shown in (Figure 1). Of 97 patients who were assessed to be enrolled in the study, 22 did not meet the inclusion criteria. Among the remaining 75 who were included in the study, ten were excluded (two due to death, one discharged before taking blood samples, and seven due to unsuitable blood samples).
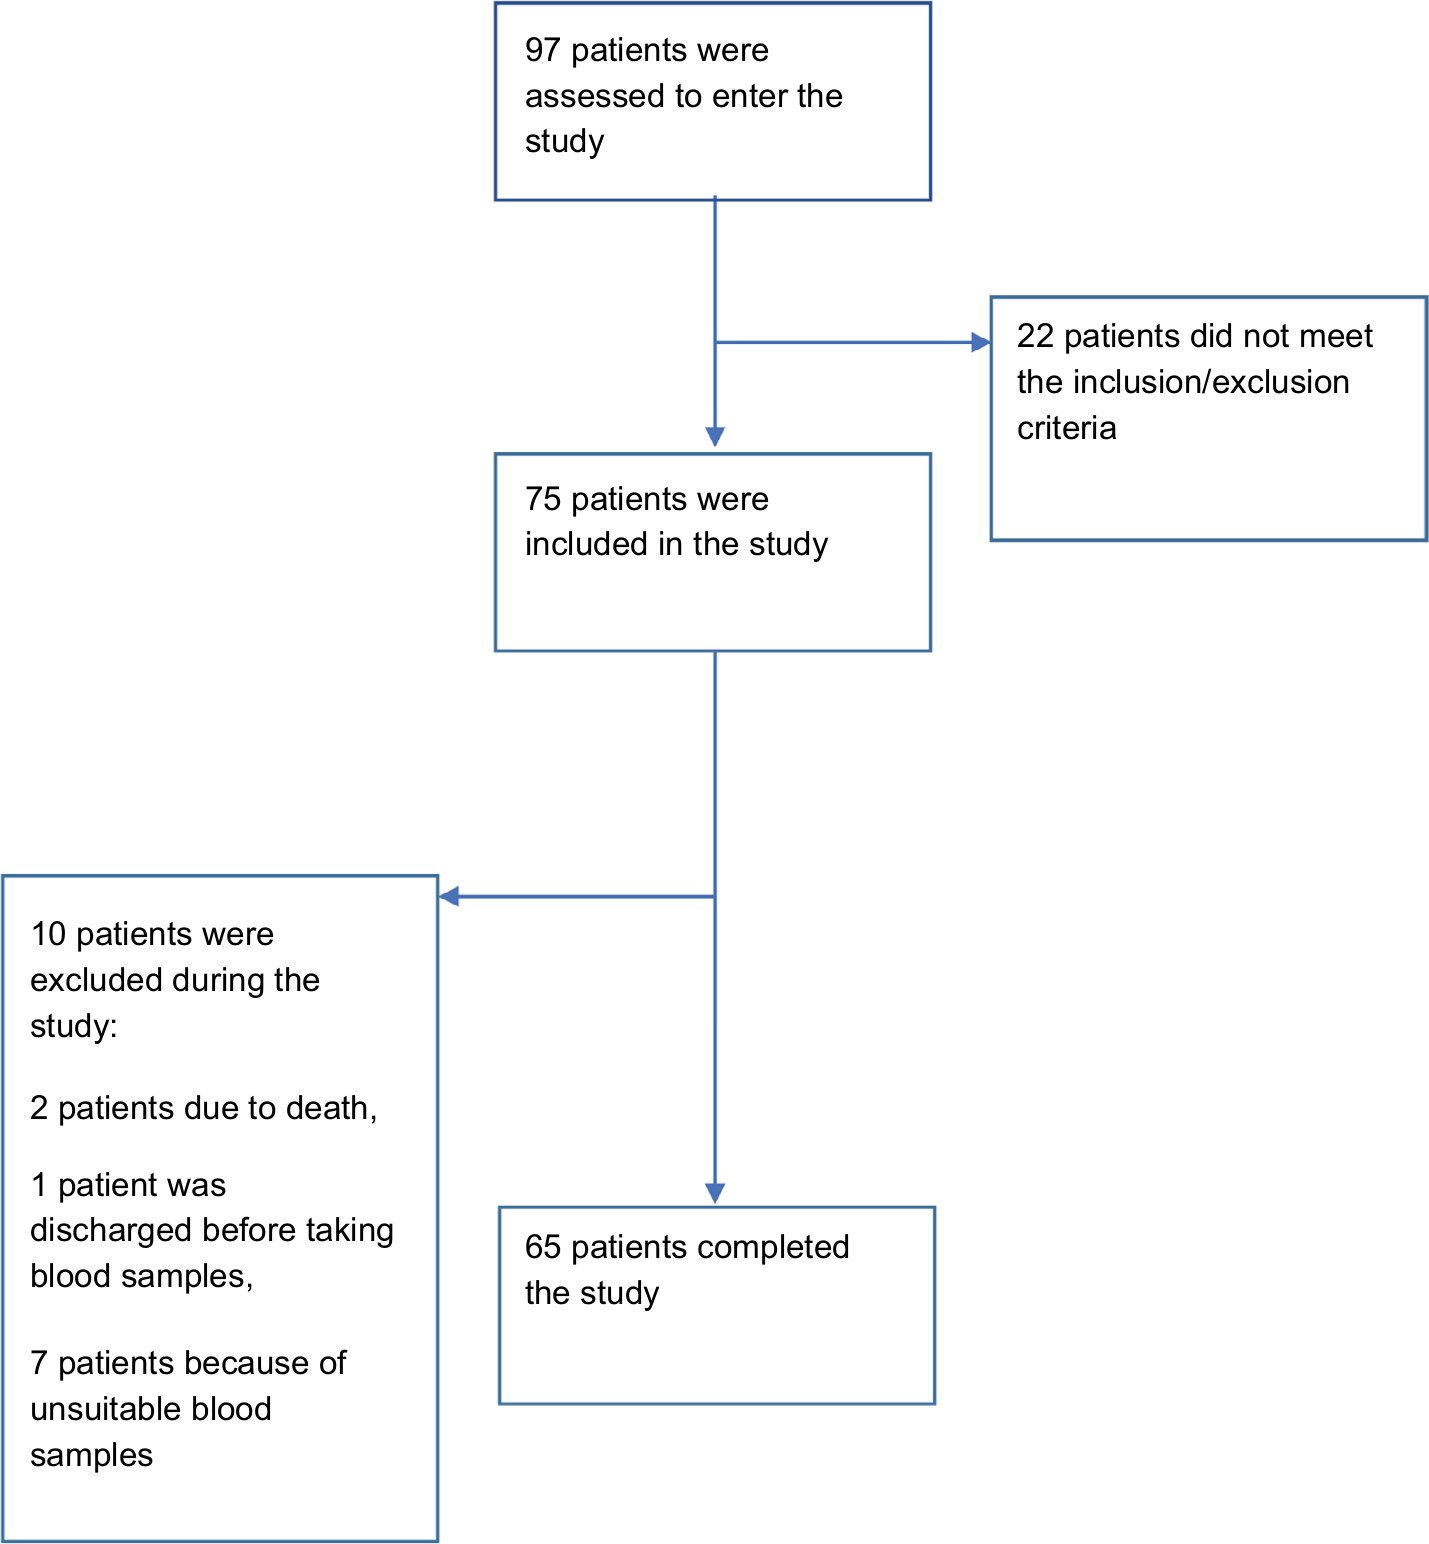 | Figure 1 Study flow diagram. |
The demographic characteristics of patients are summarized in Table 2. Of 65 patients who were recruited in this study, 38 were male and 27 female, with a mean age of 39.71±17.56 years. All patients had hypoalbuminemia, and the mean albumin serum concentration of the study population was 2.63±0.57 g/dL. Means of measured total and free phenytoin concentrations were 13.21±5.56 and 1.63±0.74 µg/mL, respectively. Also, means of calculated free phenytoin concentrations obtained by using conventional and revised Sheiner–Tozer equations were 2.15±0.95 and 1.57±0.71 µg/mL, respectively. In total, means of measured total and free phenytoin serum concentrations were in concordance in 38.46% of patients. In other words, measured total phenytoin concentration was not an accurate indicator of free phenytoin concentration (the active form of the drug) in 61.54% of patients. Pearson correlation analysis showed a significant but poor correlation between measured free and total phenytoin concentrations (r=0.29, P=0.02). Based on the results, the mean calculated free phenytoin concentration obtained using the conventional Sheiner–Tozer equation was in agreement with mean measured free phenytoin concentration in 66.15% of patients, which means the conventional Sheiner–Tozer equation was able to estimate free phenytoin concentration accurately in 66.15% of patients (43 of 65 patients). At the same time, mean calculated free phenytoin concentration obtained by using the revised Sheiner–Tozer equation was in agreement with mean measured free concentration in 64.6% of patients (42 of 65 patients). Pearson correlation analysis showed a significant but relatively weak–moderate linear correlation between measured and calculated free phenytoin concentration using conventional and revised equations in these patients (r=0.45 [P=0.001] and r=0.43 [P=0.001], respectively).
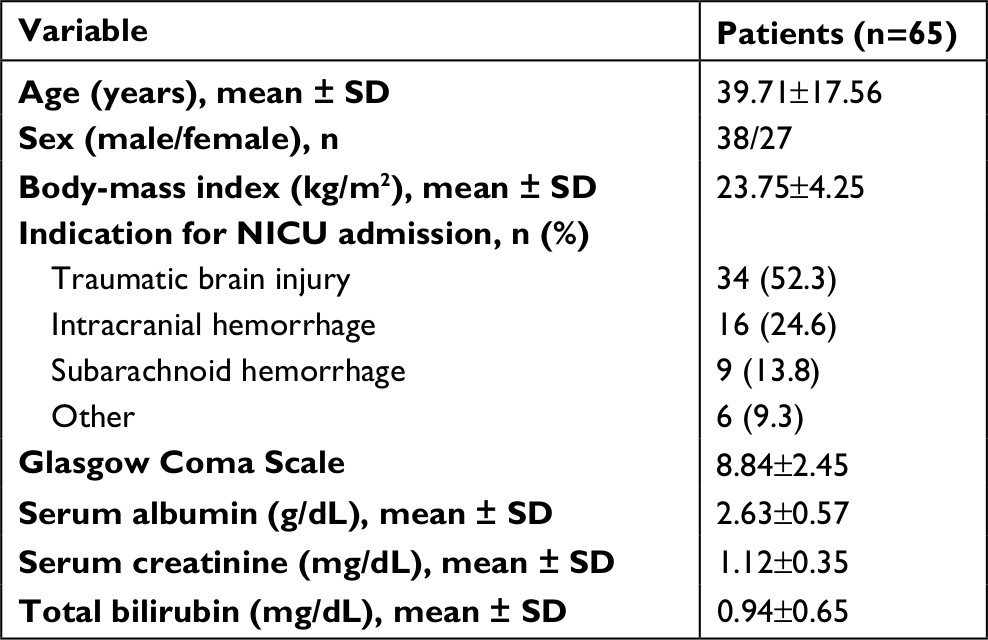 | Table 2 Demographic and clinical characteristics of patients Abbreviation: NICU, neurointensive-care unit. |
Data on agreement assessment of measured and calculated free phenytoin concentrations obtained by using conventional and revised Sheiner–Tozer equations are summarized in Table 3. In 33.85% of patients (22 of 65 patients), there was disagreement between measured free phenytoin concentration and calculated values obtained by using the conventional equation, while disagreement between measured concentration and calculated values obtained using the revised Sheiner–Tozer equation was observed in 35.4% of patients (23 of 65 patients). As such, using the revised Sheiner–Tozer equation did not improve accuracy in prediction of free phenytoin concentration. The level of agreement/disagreement based on age-group and sex of patients is shown in Table 4. Level of agreement between measured phenytoin serum concentrations and calculated values obtained by conventional and revised equations was 66.67% and 66.67% in females and 65.79% and 63.16% in males. These results demonstrated that accuracy of the Sheiner–Tozer equation for prediction of free phenytoin serum concentration was not affected by patient sex. Our data analysis showed that patients <55 years old had higher levels of agreement between measured free phenytoin concentrations and calculated values obtained by using conventional and revised equations (68.42% and 68.42%) than patients >55 years old (50% and 37.5%).
 | Table 3 Agreement between measured and calculated free phenytoin concentration using conventional and revised equations |
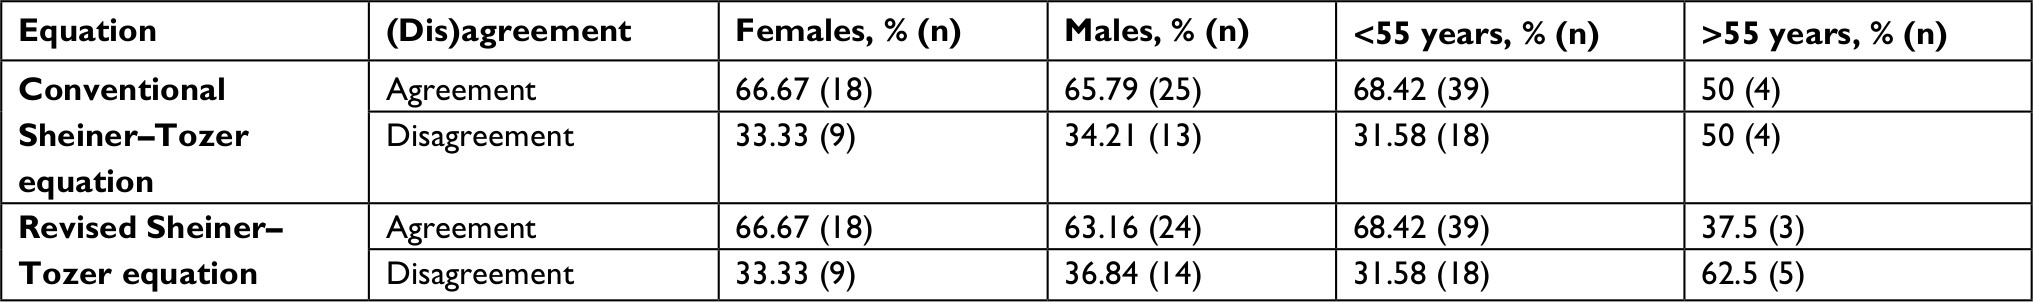 | Table 4 Measured and calculated free phenytoin concentration based on age and sex |
Measured free phenytoin concentrations were >2 µg/mL (supratherapeutic) in 32.30%of patients, within 1–2 µg/mL (the therapeutic range) in 46.15% of patients, and <1 µg/mL (subtherapeutic) in 23.07% of patients. Also, 52.38% of patients who had supratherapeutic phenytoin serum concentrations were suffering from severe hypoalbuminemia, which indicated that patients with severe hypoalbuminemia were at higher risk of phenytoin toxicity. Therefore, monitoring of free phenytoin concentration is suggested specially in these patients.
Discussion
The results of the present study showed that there was a weak correlation between measured total and free phenytoin concentrations. Therefore, the decision about phenytoin-dose adjustment should be made based on phenytoin free concentration as the active form of the drug. On the other hand, calculated free phenytoin concentrations obtained by using conventional and revised Sheiner–Tozer equations predicted free phenytoin concentrations accurately in 66.15% and 64.6% of patients, respectively. There was a relatively weak–moderate correlation between calculated and measured free phenytoin concentrations, which means that using conventional and revised Sheiner–Tozer equations was not been able to predict free phenytoin serum concentration accurately in all patients, especially in older patients with severe hypoalbuminemia.
As phenytoin is an agent with high protein binding that follows a nonlinear pharmacokinetic pattern, numerous factors, including presence of hypoalbuminemia, renal or hepatic dysfunction, hypermetabolic and hypercatabolic conditions, hyperlipidemia, diabetic mellitus, malnutrition, inflammation, or concomitant use of medications interfering with phenytoin protein binding or metabolism, can alter its serum concentration.7,19 The presence of several of these factors in critically ill patients can result in hypoalbuminemia and may put these patients at risk of phenytoin toxicity or uncontrolled seizures. Therefore, phenytoin pharmacokinetic properties necessitate the importance of dosing and monitoring of serum drug concentrations for optimal efficacy and safety, especially in ICU patients.20
Although total concentration is used routinely in practice for the monitoring of phenytoin serum concentration, studies evaluating correlation and agreement between free and total phenytoin concentrations have shown conflicting results. In this regard, results of studies on noncritically ill patients with normal serum albumin concentrations have demonstrated strong correlations between free and total phenytoin serum concentrations and concluded that phenytoin dose can be adjusted based on total phenytoin concentration in these patients.2,21 In contrast, studies conducted on critically ill patients, such as those with traumatic brain injury, have shown that due to hypoalbuminemia and several other factors, such as renal or hepatic impairment, which can affect phenytoin plasma protein binding, there was poor correlation between free and total phenytoin serum concentrations.22–25 Though demonstrating a moderate correlation between total and free phenytoin concentration (r=0.795), Gerhard et al’s retrospective study in critically ill children emphasized that total serum concentration cannot be reliable for dose adjustment in critically ill children.26 In another study, elevation of unbound phenytoin fraction beyond 10% and even up to 24% was seen in 76% of critically ill traumatic patients, especially in patients with hypoalbuminemia and hepatic and renal impairments.27 In addition to hypoalbuminemia, there are several other factors in ICU patients that can affect free phenytoin concentration. Sadeghi et al demonstrated that severity of brain injury and dependence on mechanical ventilation, even in the absence of hypoalbuminemia and renal and hepatic failure, can affect levels of agreement between total and free phenytoin concentrations, and there was poor correlation between free and total phenytoin concentrations, especially in patients with severe head trauma.28
Our findings, consistent with the results of the mentioned studies, showed that although total phenytoin concentration can be considered a reliable therapeutic target in patients with stable chronic diseases without hypoalbuminemia, decision-making based on total phenytoin concentration in critically ill patients may put patients at risk of phenytoin toxicity or uncontrolled seizures. Therefore, measurement of free phenytoin concentration is recommended in these patients.
However, despite the value of measuring free phenytoin concentration, due to technical difficulties, costliness, unavailability, and the time-consuming nature of methods for measuring free serum concentration, several equations have been developed for calculation of free phenytoin concentration in clinical practice. As such, the Sheiner–Tozer equation is one of the most common equations used for the calculation of free phenytoin concentration on the basis of total phenytoin concentration and simultaneous serum albumin in patients with hypoalbuminemia.15
Several studies have evaluated the precision and accuracy of the Sheiner–Tozer equation in estimation of free phenytoin serum concentration. In this regard, the results of Buckley et al’s retrospective study showed that despite the presence of a significant correlation between measured and calculated free phenytoin concentrations estimated using the Sheiner–Tozer equation (r=0.817), in 23% of ICU patients with hypoalbuminemia or end-stage renal disease, there was disagreement between measured and calculated free phenytoin concentrations. In 72% of these patients (ie, 72% of the 23% patients mentioned), the calculated phenytoin concentration overestimated the free phenytoin concentration, which means that adjusting doses based on calculated concentration may put these patients at risk of uncontrolled seizures. The study conducted by Hong et al on 49 patients with epilepsy demonstrated a moderate linear correlation between measured and calculated free phenytoin concentration using the Sheiner–Tozer equation (r=0.822), but patients with hypoalbuminemia had higher discordance between measured and calculated free phenytoin concentration compared to normoalbuminemic patients.29 The results of another retrospective study conducted by Krasowski et al demonstrated that measured free phenytoin concentrations had greater concordance with calculated free concentrations than total concentrations, and suggested that the Sheiner–Tozer formula can be used to estimate free phenytoin concentration in situations wherein direct measurement of free phenytoin concentration is not possible. However, they recommended that measuring free phenytoin concentration, when possible, should be considered by clinicians to adjust the dose of phenytoin precisely, especially in the inpatient setting.27 On the other hand, there are some studies that have shown different results. Mlynarek et al concluded that use of the Sheiner–Tozer equation can provide precise and correct estimation of free phenytoin concentrations, probably due to the small sample and uniformity of their study population.30 Also, in another study with a relatively small sample in neurocritically ill patients, there were strong correlations between calculated and measured free phenytoin concentrations.31 However, due to the relatively small sample and differences in patient characteristics, the results of these studies cannot be generalized and should be interpreted with caution. In some studies, the effects of factors other than hypoalbuminemia on free phenytoin concentration have been considered and derivatives of the Sheiner–Tozer equation developed to improve its accuracy and precision in predicting free phenytoin concentration. According to the results of a large retrospective study, the estimation of free phenytoin concentration by the two revised Sheiner–Tozer equations was more precise and accurate than the traditional equation. As such, they concluded that these equations can be used when measuring unbound phenytoin concentration is not possible. Based on multiple regression analysis, they concluded that albumin, total phenytoin serum concentration, and creatinine clearance were important factors in determining the optimal Sheiner–Tozer coefficient.32 The limitation of that study, including the normal serum albumin and renal function of the majority of the study population, as well as the blood sampling before reaching steady-state conditions, does not allow generalization of their results as in Brown et al’s study use of the revised Sheiner -Tozer equation could not predict free phenytoin concentration accurately.33 Finally, Kiang et al conducted a comprehensive review of several studies, and concluded that although the revised Sheiner–Tozer equation can improve the accuracy of estimating free phenytoin concentration in intensive-care and elderly patients, multiple factors, such as different characteristics of study populations, age, time of sampling, renal function, concomitant medications, and types of methods for assaying phenytoin and albumin concentration, can affect the predictive ability of these equations. Therefore, further studies considering confounding effects of these variables are needed to propose optimally revised equations that can accurately and precisely predict free phenytoin concentration.15
In our study, we attempted to remove the effects of some of these factors, such as renal and hepatic dysfunction, as well as drug interactions on free phenytoin concentrations, by restricting inclusion/exclusion criteria. However, using the revised Sheiner–Tozer equation could not improve estimation of free phenytoin concentration in comparison to the conventional equation.
It should be mentioned that in almost all previous studies, associations between calculated or measured free phenytoin concentrations and clinical outcomes were not evaluated. In addition to evaluating the concordance between measured and calculated free phenytoin concentrations by various equations, it is necessary to consider the effects of phenytoin-dosage adjustment by these methods on clinical outcomes. As such, it is recommended that the optimal dose of phenytoin be determined based on the patient’s clinical status and therapeutic drug monitoring be considered only guidance for phenytoin-dose adjustment.
Conclusion
Adjusting the phenytoin dose in ICU patients with hypoalbuminemia based on calculated free phenytoin-concentration values obtained by using conventional and revised Sheiner–Tozer equations cannot be accurate in all patients, and may put patients at risk of phenytoin toxicity or uncontrolled seizures. Therefore, phenytoin-dosage adjustment should be done on the basis of measured free phenytoin concentrations, as well as in consideration of the clinical status of patients, in order to achieve the best clinical decisions.
Acknowledgments
The authors thank all staff of the ICU ward of Besat Hospital and all patients for helping and participating in the study. This study was the results of Ms Javadi’s (first author of this article) thesis for the degree of Doctor of Pharmacy. This research was partially supported by funding from the vice-chancellor for research and technology, Hamadan University of Medical Sciences, Hamadan, Iran (9407284059). This funding was not assigned to the publication fee.
Disclosure
The authors report no conflicts of interest in this work.
References
Nuwer MR, Browne TR, Dodson WE, et al. Generic substitutions for antiepileptic drugs. Neurology. 1990;40(11):1647–1651. | ||
Rimmer EM, Buss DC, Routledge PA, Richens A. Should we routinely measure free plasma phenytoin concentration? Br J Clin Pharmacol. 1984;17(1):99–102. | ||
Lindow J, Wijdicks EF. Phenytoin toxicity associated with hypoalbuminemia in critically ill patients. Chest. 1994;105(2):602–604. | ||
Ghiculescu R. Therapeutic drug monitoring: which drugs, why, when and how to do it. Aust Prescr. 2008;31(2):42–44. | ||
Yaari Y, Selzer ME, Pincus JH. Phenytoin: mechanisms of its anticonvulsant action. Ann Neurol. 1986;20(2):171–184. | ||
Macdonald RL, Mclean MJ. Anticonvulsant drugs: mechanisms of action. Adv Neurol. 1986;44:713–736. | ||
Martin E, Tozer TN, Sheiner LB, Riegelman S. The clinical pharmacokinetics of phenytoin. J Pharmacokinet Biopharm. 1977;5(6):579–596. | ||
Wallace S, Whiting B. Factors affecting drug binding in plasma of elderly patients. Br J Clin Pharmacol. 1976;3(2):327–330. | ||
Gugler R, Manion CV, Azarnoff DL. Phenytoin: pharmacokinetics and bioavailability. Clin Pharmacol Ther. 1976;19(2):135–142. | ||
Houghton GW, Richens A, Leighton M. Effect of age, height, weight and sex on serum phenytoin concentration in epileptic patients. Br J Clin Pharmacol. 1975;2(3):251–256. | ||
Dasgupta A. Usefulness of monitoring free (unbound) concentrations of therapeutic drugs in patient management. Clin Chim Acta. 2007;377(1-2):1–13. | ||
Dasgupta A. Clinical utility of free drug monitoring. Clin Chem Lab Med. 2002;40(10):986–993. | ||
Buckley MS, Reeves BA, Barletta JF, Bikin DS. Correlation of free and total phenytoin serum concentrations in critically ill patients. Ann Pharmacother. 2016;50(4):276–281. | ||
Zielmann S, Mielck F, Kahl R, et al. A rational basis for the measurement of free phenytoin concentration in critically ill trauma patients. Ther Drug Monit. 1994;16(2):139–144. | ||
Kiang TK, Ensom MH. A comprehensive review on the predictive performance of the sheiner-tozer and derivative equations for the correction of phenytoin concentrations. Ann Pharmacother. 2016;50(4):311–325. | ||
Bolt J, Gorman SK, Precision GSK. Precision, bias, and clinical utility of the Sheiner–Tozer equation to guide phenytoin dosing in critically ill adults. J Clin Pharmacol. 2013;53(4):451–455. | ||
Kane SP, Bress AP, Tesoro EP. Characterization of unbound phenytoin concentrations in neurointensive care unit patients using a revised Winter-Tozer equation. Ann Pharmacother. 2013;47(5):628–636. | ||
Fraser AD. New drugs for the treatment of epilepsy. Clin Biochem. 1996;29(2):97–110. | ||
Cwik MJ, Liang M, Deyo K, Andrews C, Fischer J. Simultaneous rapid high-performance liquid chromatographic determination of phenytoin and its prodrug, fosphenytoin in human plasma and ultrafiltrate. J Chromatogr B Biomed Sci Appl. 1997;693(2):407–414. | ||
von Winckelmann SL, Spriet I, Willems L. Therapeutic drug monitoring of phenytoin in critically ill patients. Pharmacotherapy. 2008;28(11):1391–1400. | ||
Johno I, Kuzuya T, Suzuki K, et al. Is free fraction measurement of phenytoin always necessary in pediatric epileptic patients? Ther Drug Monit. 1988;10(1):39–44. | ||
Bauer LA, Edwards WA, Dellinger EP, Raisys VA, Brennan C. Importance of unbound phenytoin serum levels in head trauma patients. J Trauma. 1983;23(12):1058–1060. | ||
Shohrati M, Rouini M, Mojtahedzadeh M, Firouzabadi M. Evaluation of phenytoin pharmacokinetics in neurotrauma patients. Daru. 2007;15(1). | ||
Banh HL, Burton ME, Sperling MR. Interpatient and intrapatient variability in phenytoin protein binding. Ther Drug Monit. 2002;24(3):379–385. | ||
Boucher BA, Rodman JH, Jaresko GS, Rasmussen SN, Watridge CB, Fabian TC. Phenytoin pharmacokinetics in critically ill trauma patients. Clin Pharmacol Ther. 1988;44(6):675–683. | ||
Wolf GK, Mcclain CD, Zurakowski D, Dodson B, Mcmanus ML. Total phenytoin concentrations do not accurately predict free phenytoin concentrations in critically ill children. Pediatr Crit Care Med. 2006;7(5):434–439. | ||
Krasowski MD, Penrod LE. Clinical decision support of therapeutic drug monitoring of phenytoin: measured versus adjusted phenytoin plasma concentrations. BMC Med Inform Decis Mak. 2012;12(1):7. | ||
Sadeghi K, Hadi F, Ahmadi A, et al. Total phenytoin concentration is not well correlated with active free drug in critically-ill head trauma patients. J Res Pharm Pract. 2013;2(3):105. | ||
Hong JM, Choi YC, Kim WJ. Differences between the measured and calculated free serum phenytoin concentrations in epileptic patients. Yonsei Med J. 2009;50(4):517–520. | ||
Mlynarek ME, Peterson EL, Zarowitz BJ. Predicting unbound phenytoin concentrations in the critically ill neurosurgical patient. Ann Pharmacother. 1996;30(3):219–223. | ||
Ibarra M, Vázquez M, Fagiolino P, Mutilva F, Canale A, Total CA. Total, unbound plasma and salivary phenytoin levels in critically ill patients. Journal of Epilepsy and Clinical Neurophysiology. 2010;16(2):69–73. | ||
Kane SP, Bress AP, Tesoro EP. Characterization of unbound phenytoin concentrations in neurointensive care unit patients using a revised Winter-Tozer equation. Ann Pharmacother. 2013;47(5):628–636. | ||
Brown AL, Sangha KS, Mueller EW, Kaur D, Keegan SP. Response to “Characterization of unbound phenytoin concentrations in neurointensive care unit patients using a revised Winter-Tozer equation” by Sean P. Kane, Adam P. Bress, and Eljim P. Tesoro. Ann Pharmacother. 2013;47(10):1374–1375. |
 © 2018 The Author(s). This work is published and licensed by Dove Medical Press Limited. The
full terms of this license are available at https://www.dovepress.com/terms
and incorporate the Creative Commons Attribution
- Non Commercial (unported, 3.0) License.
By accessing the work you hereby accept the Terms. Non-commercial uses of the work are permitted
without any further permission from Dove Medical Press Limited, provided the work is properly
attributed. For permission for commercial use of this work, please see paragraphs 4.2 and 5 of our Terms.
© 2018 The Author(s). This work is published and licensed by Dove Medical Press Limited. The
full terms of this license are available at https://www.dovepress.com/terms
and incorporate the Creative Commons Attribution
- Non Commercial (unported, 3.0) License.
By accessing the work you hereby accept the Terms. Non-commercial uses of the work are permitted
without any further permission from Dove Medical Press Limited, provided the work is properly
attributed. For permission for commercial use of this work, please see paragraphs 4.2 and 5 of our Terms.