Back to Journals » Clinical Ophthalmology » Volume 13
Correlation between laser speckle flowgraphy and optical coherence tomography angiography measurements in normal and glaucomatous eyes
Authors Kohmoto R, Sugiyama T, Ueki M, Kojima S, Maeda M, Nemoto E ![]() , Tokuoka S, Ikeda T
, Tokuoka S, Ikeda T
Received 22 April 2019
Accepted for publication 13 August 2019
Published 12 September 2019 Volume 2019:13 Pages 1799—1805
DOI https://doi.org/10.2147/OPTH.S213031
Checked for plagiarism Yes
Review by Single anonymous peer review
Peer reviewer comments 2
Editor who approved publication: Dr Scott Fraser
Ryohsuke Kohmoto,1 Tetsuya Sugiyama,1 Mari Ueki,1,2 Shota Kojima,1 Michiko Maeda,1 Emika Nemoto,1 Satoru Tokuoka,3 Tsunehiko Ikeda1
1Department of Ophthalmology, Osaka Medical College, Takatsuki, Japan; 2Department of Ophthalmology, Takatsuki Red Cross Hospital, Takatsuki, Japan; 3Department of Ophthalmology, Hokusetsu General Hospital, Takatsuki, Japan
Correspondence: Ryohsuke Kohmoto
Department of Ophthalmology, Osaka Medical College, 2-7 Daigaku-machi, Takatsuki, Osaka 569-8686, Japan
Tel +81 72 683 1221
Fax +81 72 681 8195
Email [email protected]
Purpose: To investigate the relationship between laser speckle flowgraphy (LSFG) and optical coherence tomography angiography (OCTA) measurements of the peripapillary retina and optic nerve head (ONH) in normal eyes and eyes with primary open-angle glaucoma (POAG).
Patients and methods: One eye from each of 46 normal subjects and mild and moderate/advanced POAG patients were included. ONH blood flow acquired by LSFG, circumpapillary vessel density (cpVD, a 250 μm-wide elliptical annulus around the optic disc), and intra-papillary vessel density (ipVD, a 1.5×1.5 mm scan field) acquired by OCTA were measured. Their values were compared among normal controls and patients at each stage of glaucoma using one-way ANOVA, and the correlation between measurements obtained by the two methods was examined by univariate regression analysis.
Results: ONH tissue blood flow, tissue mean blur rate (MBR-T), and cpVD in the outer layer of the retina significantly decreased with the progression of glaucoma stage, although the latter showed no significant difference between normal subjects and mild-stage glaucoma patients. MBR-T was significantly correlated with cpVD, but not with ipVD, in the retinal outer layer.
Conclusion: A correlation was found only between MBR-T and cpVD in the retinal outer layer. A difference in MBR-T, but not in cpVD, was detected between normal controls and mild glaucoma patients.
Keywords: optic nerve head, blood flow, laser speckle flowgraphy, optical coherent tomography angiography
Introduction
Glaucoma is a multifactorial disease in which various factors such as aging, myopia, diabetes, sleep apnea, oxidative stress, and family history are involved.1–5 Currently, inducing a decrease of IOP is the only evidence-based treatment.6 However, there are cases in which, despite IOP being kept sufficiently low, disease progression occurs in terms of the visual field, so that factors that are not dependent on IOP may also be involved in disease progression. Ocular circulation abnormality has been pointed out to be one such factor.7
Laser speckle flowgraphy (LSFG) was first taken to measure optic nerve head (ONH) circulation in animal in 1995 and in humans in 1997.8,9 LSFG has been used in many ocular blood flow studies.10 The updated model of LSFG, LSFG-NAVI (Softcare Co., Ltd., Fukuoka, Japan) was approved as a medical apparatus by the Japanese Pharmaceuticals and Medical Devices Agency in 2008. It has adopted a new index: mean blur rate (MBR), the relative velocity index of erythrocytes.11 LSFG-NAVI can measure the MBR in the ONH, retina, and choroid non-invasively and with high reproducibility in normal eyes as well as glaucomatous eyes.12,13 Animal studies showed that the MBR in the ONH tissue, measured by LSFG-NAVI, and the ONH capillary blood flow, acquired by hydrogen gas clearance methods, were highly correlated, suggesting that MBR in the ONH tissue is usable for interindividual and intergroup comparisons.14,15
Optical coherence tomography angiography (OCTA) can obtain 3D retinochoroidal blood flow images which can be analyzed by layer using split-spectrum amplitude-decorrelation angiography to rapidly and accurately produce high-quality vascular images.16,17 The circumpapillary vessel density (cpVD) obtained by OCTA was found significantly associated with the progression of visual field defects in glaucoma.18,19 Not limited to glaucoma, OCTA was reported to detect optic disc perfusion for non-arteritic anterior ischemic optic neuropathy.20
Recently, in a comparison of MBR obtained by LSFG with the peripapillary relative intensity (PRI) acquired by OCTA, superficial-choroidal PRI was found significantly correlated with MBR in the ONH tissue area.21 Another study found OCTA vessel density had a higher glaucoma diagnostic ability compared to LSFG parameters in patients with normal tension glaucoma (NTG).22 Thus, LSFG and OCTA are both useful tools for managing glaucoma, and it is considered to be meaningful to investigate the relationship between the two more deeply.
The aim of the current study is to investigate in greater depth the relationships between the two methods; to this aim, we analyzed the correlation of ONH blood flow analysis by LSFG and cpVD, as well as intra-papillary vessel density (ipVD) acquired by OCTA, in normal and glaucomatous eyes.
Materials and methods
In this prospective study, 14 normal subjects and 32 glaucoma patients (mild stage: 16, moderate or advanced stage: 16) were included. Glaucoma patient staging was performed using the Anderson & Patella classification.23 One eye of each of these 46 subjects was randomly selected to be included in the analysis. This study was double-blind.
Glaucoma patients had been undergoing topical therapy with a variety of anti-glaucoma eye drops, including prostaglandin analogue solutions (latanoprost, tafluprost, travoprost, or bimatoprost), beta-adrenoceptor blockers (timolol or carteolol), carbonic anhydrase inhibitors (dorzolamide or brinzolamide), an alpha2-adrenoceptor agonist (brimonidine), and a rho kinase inhibitor (ripasudil).
Exclusion criteria included smoking, severe cataract, retinal or optic nerve diseases other than glaucoma, high myopia (refractive error worse than −6.00 D), systemic diseases that may affect ophthalmic blood flow such as systemic hypertension, diabetes mellitus, and any systemic medication able to alter ocular blood flow, such as calcium blockers. The study was conducted in strict adherence to the tenets of the Declaration of Helsinki, and its protocol was reviewed and approved by the Institutional Review Board/Ethics Committee of Osaka Medical College (No. 2534). Written informed consent was obtained from the subjects of the study.
The patients were instructed not to drink coffee or alcohol for 1 day prior to the measurements with LSFG and OCTA. Mydriasis was induced with 1–2 drops of topical 0.5% tropicamide (Mydrin M ophthalmic solution; Santen Pharmaceutical Co., Ltd., Osaka, Japan) before measurements. About 3 hrs after eating, 1 hr after mydriasis, LSFG and OCTA measurements were taken at about the same time in the morning. ONH blood flow was measured in a sitting position. Each measurement was repeated 3 times using LSFG (LSFG-NAVI; Softcare Co., Ltd.). The principles by which ONH blood flow can be determined using LSFG have been previously described.10,24 The MBR values in the tissue and vascular areas of the ONH (MBR-T and MBR-V, respectively) were automatically calculated using the LSFG Analyzer software (version 7.0.26.0, Softcare Co., Ltd; Figure 1A and B). The average of these three measurements was used in data analysis.
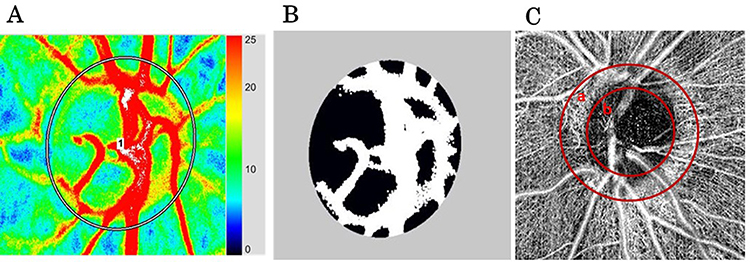 |
Figure 1 (A) ONH blood flow acquired by LSFG. “1” represents region of interest inside ONH. (B) The black area shows MBR-T and the white area shows MBR-V. (C) CpVD “area a” represents a vascular density of 250-μm-wide elliptical annulus around the optic disc. IpVD “area b” represents a vascular density of 1.5×1.5-mm scan field centered on the ONH.Abbreviations: ONH, optic nerve head; LSFG, laser speckle flowgraphy; MBR-T, tissue mean blur rate; MBR-V, vascular mean blur rate; cpVD, circumpapillary vessel density; ipVD, intra-papillary vessel density. |
The OCTA, namely an RS 3000 Advance (NIDEK Co., Ltd., Tokyo, Japan), was used to analyze cpVD (a 250-μm-wide elliptical annulus around the optic disc) and ipVD (a 1.5×1.5-mm scan field; Figure 1C). The images were obtained using a spectral domain-OCT device with a central wavelength of 880 nm, an acquisition speed of 53,000 A-scans/s, and an axial and transversal resolution in tissue of 7 and 20 μm, respectively. Scans were obtained from 3 × 3 mm cubes, with each cube consisting of 256 clusters of four repeated B-scans centered on the ONH. OCTA was also measured in a sitting position. OCTA characterizes vascular information at each retinal layer as an en face angiogram. In the current study, we used vessel density measurements at the retinal surface, outer retinal, choroid, and lamina cribrosa layers. Based on these default settings, the radial peripapillary capillary plexus extended from the top of the internal limiting membrane (ILM) to 104 μm below it, while the outer layer of the retina extended from 109 μm below the top of the ILM to the retinal pigment epithelium (RPE), the choroid extended from 4 to 125 μm below the RPE, and the deep capillary network at the lamina cribrosa extended from 63 to 376 μm below the ILM.
Statistical analysis
We compared MBR values (MBR-T, MBR-V) and vessel densities (cpVD, ipVD) among normal controls and patients at each stage of glaucoma using one-way ANOVA, and also examined correlations between MBR values and vessel densities using univariate regression analysis. Statistical analysis was performed using BellCurve for Excel (Social Survey Research Information Co., Ltd., Tokyo, Japan) and P<0.05 were considered to be statistically significant.
Results
There were no significant differences among the groups in terms of age, sex and refractive error (Table 1). Significant differences were found in MBR-T between normal subjects and patients with mild-stage primary-open angle glaucoma (POAG), and between mild-stage patients and those with moderate to severe POAG (Figure 2A). The cpVD in the outer layer of the retina of POAG patients in the moderate to severe stage was significantly lower than that of mild-stage patients and normal subjects. However, no significant cpVD difference was found between normal subjects and patients with POAG in the mild stage (Figure 2B). On the other hand, no significant differences in MBR-V, cpVD in other layers, or ipVD in any layer were found in any group comparison (Tables 2 and 3).
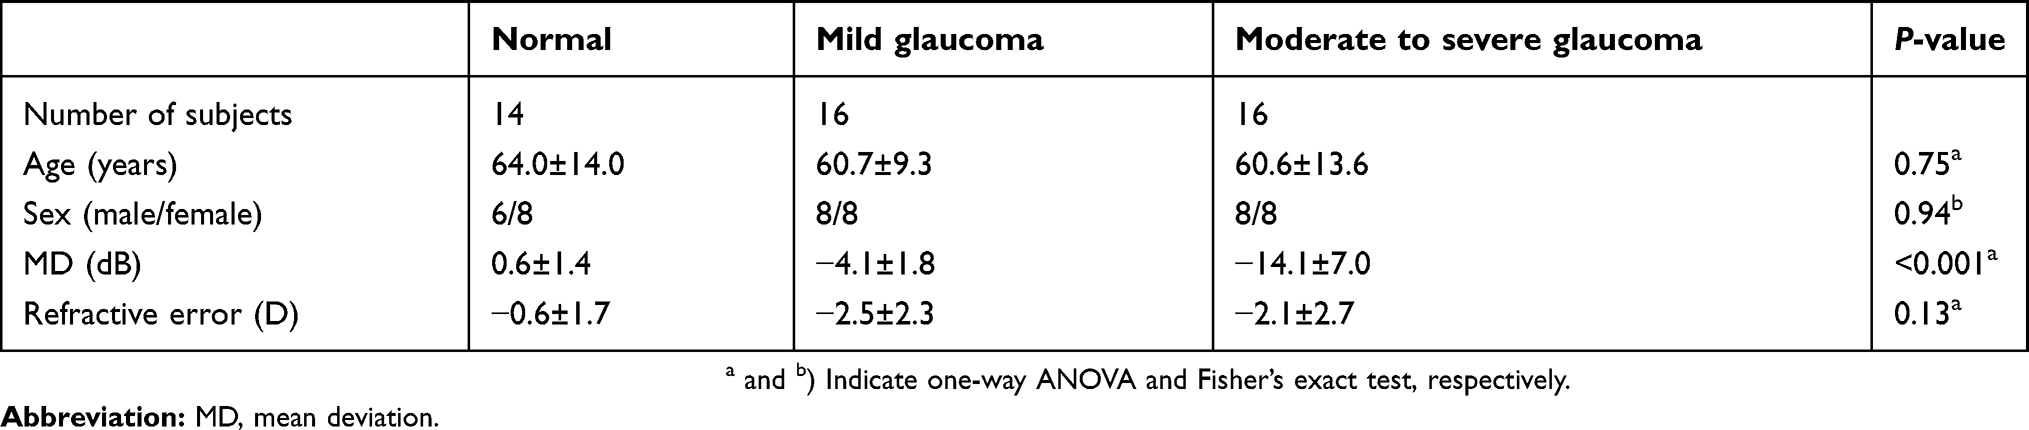 |
Table 1 Age, sex, MD, and refractive error in each group |
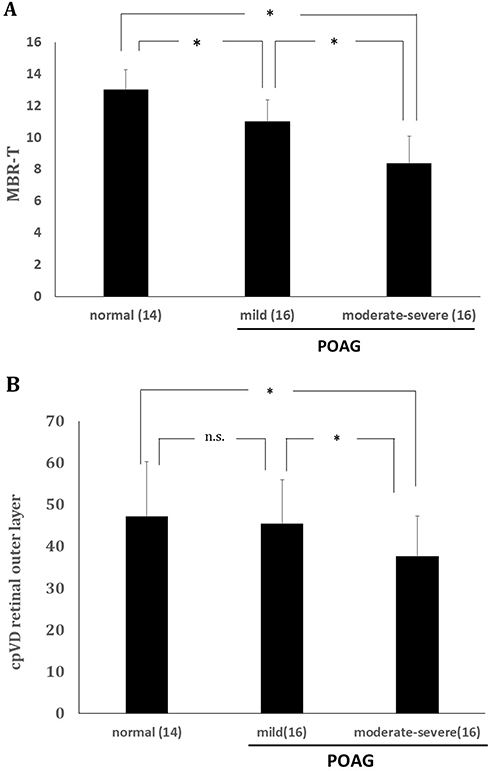 |
Figure 2 (A) ONH tissue blood flow (MBR-T, mean ± standard error) changes in normal subjects and patients in each glaucoma stage. P<0.001 (one-way ANOVA), *P<0.01 (Dunnett’s test). (B) Retinal outer layer cpVD changes (mean ± standard error) in each glaucoma stage. P=0.02 (one-way ANOVA), *P<0.01 (Dunnett’s test). Abbreviations: n.s, not significant; ONH, optic nerve head; MBR-T, tissue mean blur rate; cpVD, circumpapillary vessel density. |
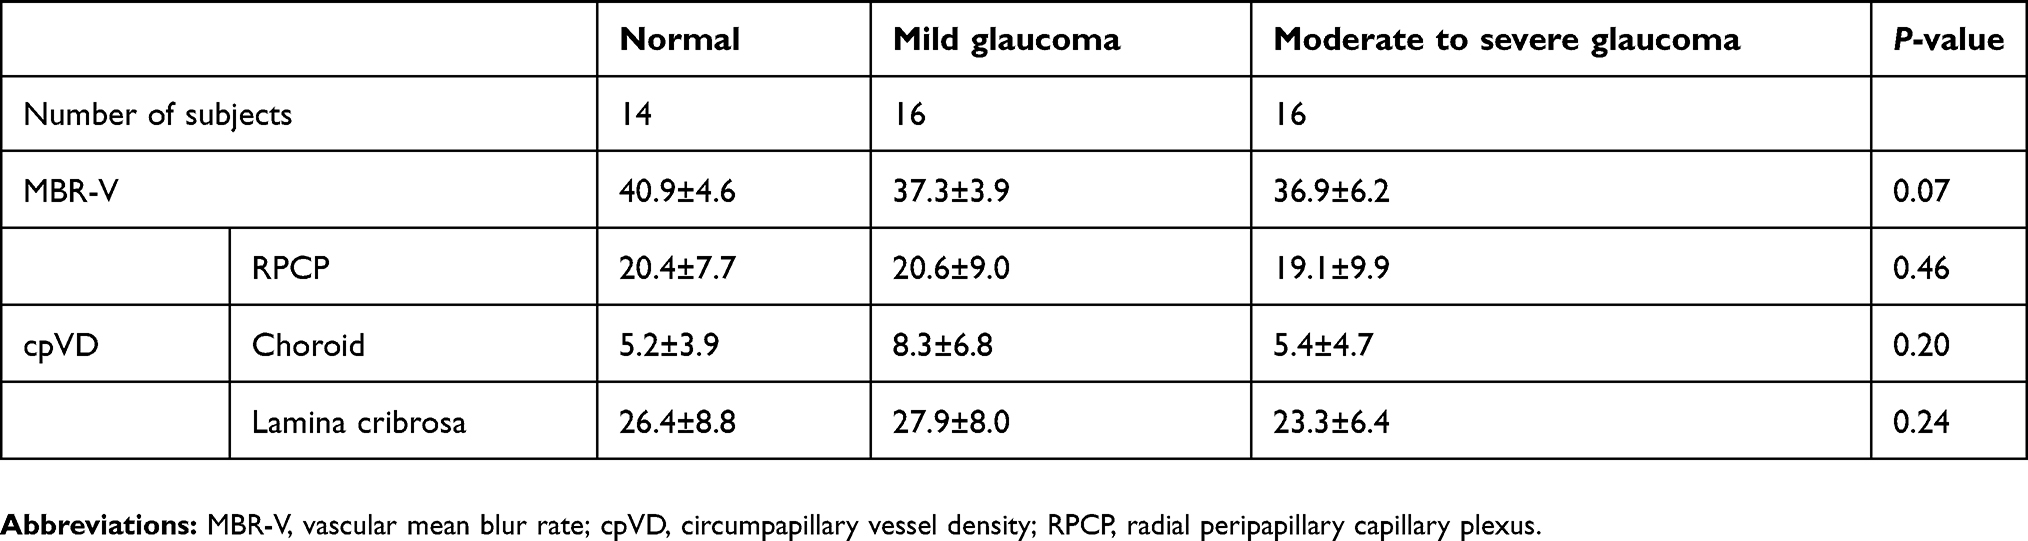 |
Table 2 MBR-V and cpVD in various layers |
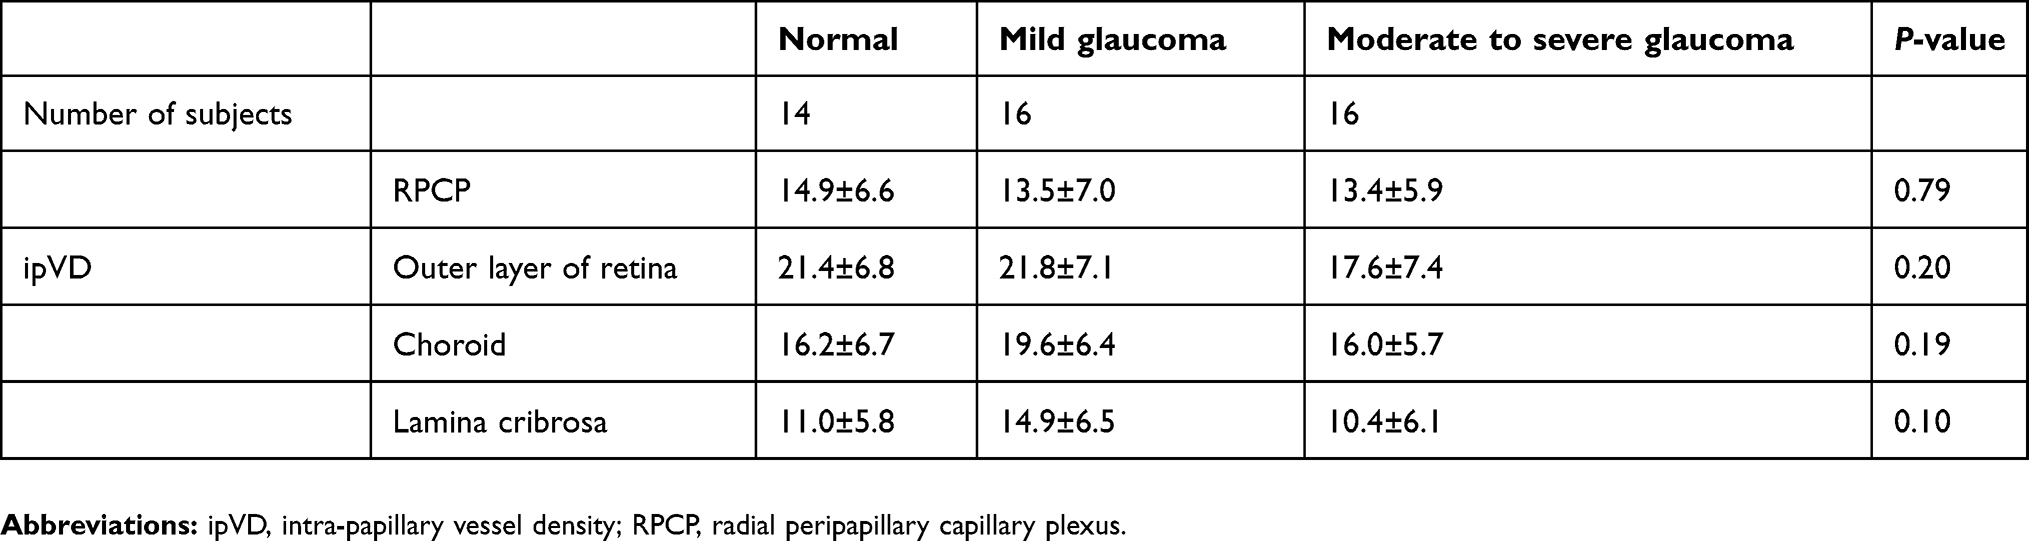 |
Table 3 Intra-papillary vessel density in various layers |
Regarding the correlation between measurements performed with LSFG and OCTA, MBR-T was significantly correlated with cpVD in the outer layer of the retina (Figure 3), and no other significant correlations were found between parameters obtained by the two methods (Tables 4 and 5).
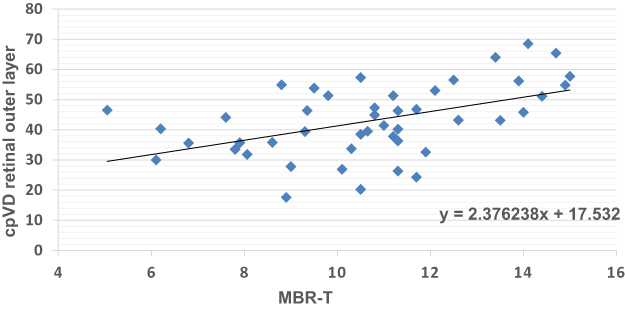 |
Figure 3 Correlation between retinal outer layer cpVD and MBR-T. P=0.0005, r=0.49 (univariate regression analysis).Abbreviations: MBR-T, tissue mean blur rate; cpVD, circumpapillary vessel density. |
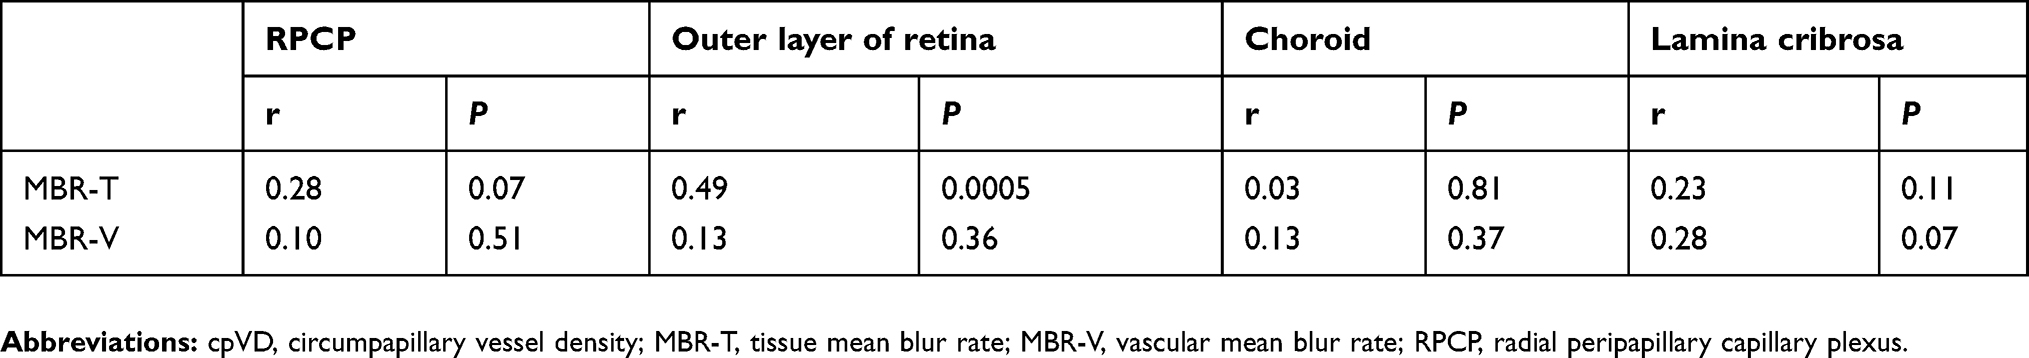 |
Table 4 Correlation between cpVD and MBR-T or MBR-V in various layers |
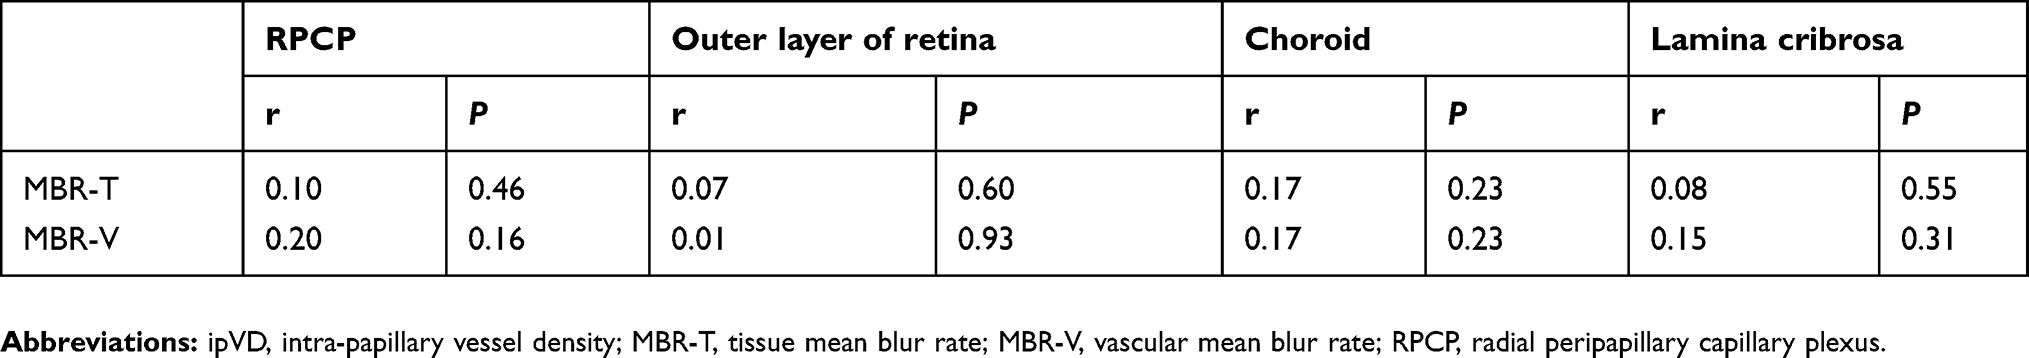 |
Table 5 Correlation between ipVD and MBR-T or MBR-V in various layers |
Discussion
In the analysis of the correlation between measurements performed with LSFG and OCTA, the only significant correlation was that between MBR-T and cpVD in the outer layer of the retina. On the contrary, no significant correlation was observed between the MBR values and ipVD. Our study also found significant differences in MBR-T among normal subjects, mild glaucoma, and moderate to severe glaucoma, while a significant difference was not found in cpVD between normal subjects and mild glaucoma.
As mentioned above, MBR-T was significantly correlated with cpVD in the outer layer of the retina, but not in the other layers. The outer layer of the retina was defined as 109 μm to RPE under the ILM, which is around the anterior lamina cribrosa in our study. A previous study reported that MBR-T in the rabbit was highly correlated with capillary blood flow near the lamina cribrosa, obtained by the hydrogen gas clearance method.14,15 Another study reported that the high correlation between reduction in blood flow measured by LSFG and the microsphere method provides evidence that MBR-T is an index of blood flow in a deep ONH region.25 The significant correlation between MBR-T and cpVD in the outer layer of the retina in the current study was consistent with these previous reports. Moreover, a recent study revealed that both MBR-V and MBR-T were correlated, in particular, with the retinal surface layer and choroidal surface layer,21 while MBR-V did not correlate with any vessel density in our study. This discrepancy might be due to differences in measurement area and to the use of different OCTA models.
In the current study, neither MBR-T nor MBR-V correlated with ipVD. A critical problem in measuring ipVD is that large retinal vessels can shadow the tissue below, or be projected as artifacts onto the highly reflective tissues below.26 In other words, it may be difficult to visualize microvasculature in the deep portion of the ONH by OCTA. In fact, cpVD has been reported to have a higher diagnostic ability than ipVD.27 That may be the reason why ipVD showed no correlation with MBR in the present study. Another OCTA, such as Optovue (Fremont, CA, USA) with a 3D projection artifact removal technique, might yield different results.
In the present study, both MBR-T and cpVD in the outer layer of the retina were significantly lowered with glaucoma stage progression, although cpVD showed no significant difference between normal subjects and patients with mild-stage glaucoma. A previous report found MBR-T to be significantly associated with structural and visual field damage in glaucomatous eyes.28 On the contrary, Rao et al found that the diagnostic ability of the vessel density parameters of OCTA was only moderate.27 Another study revealed that cpVD is useful for differentiating moderate and advanced glaucoma, while MBR-T is useful for identifying early glaucoma.29 These previous reports are consistent with our results. Our result that retinal outer layer cpVD, but not ipVD, was lowered with the progression of glaucoma is also consistent with a previous report.27
The current study showed that MBR-T, but not MBR-V, significantly decreased with the progression of glaucoma stage. However, it was reported that both MV and MT were lower in the OAG subjects than the controls.21 One reason for this discrepancy may lie in the fact that divided glaucoma patients into two groups based on stage of disease and compared MBRs among the two glaucoma and one control groups. The previous study included relatively advanced stage glaucoma patients, while included patients in the mild glaucoma group in our study were relatively early-stage glaucoma patients. To date, MBR-T in the ONH has been shown to better correlate with capillary blood flow,14,15,25 than MBR-V, suggesting that MBR-T in the ONH is more quantifiable than MBR-V. In contrast to MBR-V, MBR-T in the ONH also significantly correlated with retinal nerve fiber layer thickness in patients with glaucoma.28 Together, these findings help to put into context the results in the current study.
Several limitations of the present study should be noted. First, our sample size was relatively small. Larger prospective studies are needed in the future. Second, we did not evaluate potential confounders such as blood pressure, ocular perfusion pressure, or anti-glaucoma medications. These factors might affect, in particular, the differences in MBR-T and cpVD among normal subjects and patients with various stages of glaucoma.
Conclusion
The present study revealed a significant correlation between MBR-T and cpVD, but not ipVD, in the retinal outer layer. In order to monitor the decrease of ONH blood flow with glaucoma progression, MBR-T was the most sensitive measurement, followed by cpVD, while ipVD was not very useful.
Acknowledgments
We would like to thank Editage Author Services for editing this manuscript. No financial support was received for this project.
Disclosure
The authors report no conflicts of interest in this work.
References
1. Suzuki Y, Iwase A, Araie M, et al. Risk factors for open-angle glaucoma in a Japanese population: the Tajimi study. Ophthalmology. 2006;113(9):1613–1617. doi:10.1016/j.ophtha.2006.04.029
2. Yamada E, Himori N, Kunikata H, et al. The relationship between increased oxidative stress and visual field defect progression in glaucoma patients with sleep apnea syndrome. Acta Ophthalmol. 2018;96(4):479–484. doi:10.1111/aos.13801
3. Izzotti A, Bagnis A, Saccà SC. The role of oxidative stress in glaucoma. Mutat Res. 2006;612(2):105–114. doi:10.1016/j.mrrev.2005.11.001
4. Tielsch JM, Katz J, Sommer A, et al. Family history and risk of primary open angle glaucoma. The Baltimore Eye Survey. Arch Opthalmol. 1994;112(1):69–73. doi:10.1001/archopht.1994.01090130079022
5. AGIS Investigators. The Advanced Glaucoma Intervention Study (AGIS): 12. Baseline risk factors for sustained loss of visual field and visual acuity in patients with advanced glaucoma. Am J Ophthalmol. 2002;134(4):499–512. doi:10.1016/S0002-9394(02)01659-8
6. Anderson DR. Collaborative normal tension glaucoma study. Curr Opinion Ophthalmol. 2003;14(2):86–90. doi:10.1097/00055735-200304000-00006
7. Flammer J, Orugül S, Costa VP, et al. The impact of ocular blood flow in glaucoma. Prog Retin Eye Res. 2002;21(4):359–393. doi:10.1016/S1350-9462(02)00008-3
8. Tamaki Y, Araie M, Kawamoto E, et al. Non-contact, two-dimensional measurement of tissue circulation in choroid and optic nerve head using laser speckle phenomenon. Exp Eye Res. 1995;60(4):373–383. doi:10.1016/s0014-4835(05)80094-6
9. Tamaki Y, Araie M, Tomita K, et al. Real-time measurement of human optic nerve head and choroid circulation, using the laser speckle phenomenon. Jpn J Ophthalmol. 1997;41(1):49–54.
10. Sugiyama T, Araie M, Riva CE, et al. Use of laser speckle flowgraphy in ocular blood flow research. Acta Ophthalmol. 2010;88(7):723–729. doi:10.1111/j.1755-3768.2009.01586.x
11. Konishi Y, Tokimoto Y, Kohra K, et al. New laser speckle flowgraphy system using CCD camera. Opt Rev. 2002;9:163–169. doi:10.1007/s10043-002-0163-4
12. Aizawa N, Yokoyama Y, Chiba N, et al. Reproducibility of retinal circulation measurements obtained using laser speckle flowgraphy-NAVI in patients with glaucoma. Clin Ophthalmol. 2011;5:1171–1176.
13. Luft N, Wozniak PA, Aschinger GC, et al. Ocular blood flow measurements in healthy white subjects using laser speckle flowgraphy. PLoS One. 2016;11(12):e0168190. doi:10.1371/journal.pone.0168190
14. Takahashi H, Sugiyama T, Tokushige H, et al. Comparison of CCD-equipped laser speckle flowgraphy with hydrogen gas clearance method in the measurement of optic nerve head microcirculation in rabbits. Exp Eye Res. 2013;108:10–15. doi:10.1016/j.exer.2012.12.003
15. Aizawa N, Nitta F, Kunikata H, et al. Laser speckle and hydrogen gas clearance measurements of optic nerve circulation in albino and pigmented rabbits with or without optic disc atrophy. Invest Ophthalmol Vis Sci. 2014;55(12):7991–7996. doi:10.1167/iovs.14-15373
16. Jia Y, Morrison JC, Tokayer J, et al. Quantitative OCT angiography of optic nerve head blood flow. Biomed Opt Express. 2012;3(12):3127–3137. doi:10.1364/BOE.3.003127
17. Jia Y, Tan O, Tokayer J, et al. Split-spectrum amplitude-decorrelation angiography with optical coherence tomography. Opt Express. 2012;20(4):4710–4725. doi:10.1364/OE.20.004710
18. Yarmohammadi A, Zangwill LM, Diniz-Filho A, et al. Relationship between optical coherence tomography angiography vessel density and severity of visual field loss in glaucoma. Ophthalmology. 2016;123(12):2498–2508. doi:10.1016/j.ophtha.2016.08.041
19. Akagi T, Iida Y, Nakanishi H, et al. Microvascular density in glaucomatous eyes with hemifield visual field defects: an optical coherence tomography angiography study. Am J Ophthalmol. 2016;168:237–249. doi:10.1016/j.ajo.2016.06.009
20. Ling JW, Yin X, Lu QY, et al. optical coherence tomography angiography of optic disc perfusion in non-arteritic anterior ischemic optic neuropathy. Int J Ophthalmol. 2017;10(9):1402–1406. doi:10.18240/ijo.2017.09.12
21. Kiyota N, Kunikata H, Shiga Y, et al. Relationship between laser speckle flowgraphy and optical coherence tomography angiography measurements of ocular microcirculation. Graefes Arch Clin Exp Ophthalmol. 2017;255(8):1633–1642. doi:10.1007/s00417-017-3820-9
22. Takeyama A, Ishida K, Anraku A, et al. Comparison of optical coherence tomography angiography and laser speckle flowgraphy for the diagnosis of normal-tension glaucoma. J Ophthalmol. 2018. eCollection. doi:10.1155/2018/1751857
23. Anderson DR, Patella VM. Automated Static Perimetory.
24. Sugiyama T. Basic Technology and clinical applications of the updated model of laser speckle flowgraphy to ocular diseases. Photonics. 2014;1:220–234. doi:10.3390/photonics1030220
25. Wang L, Cull GA, Piper C, et al. Anterior and posterior optic nerve head blood flow in nonhuman primate experimental glaucoma model measured by laser speckle imaging technique and microsphere method. Invest Ophthalmol Vis Sci. 2012;53(13):8303–8309. doi:10.1167/iovs.12-10911
26. Jia Y, Wei E, Wang X, et al. Optical coherence tomography angiography of optic disc perfusion in glaucoma. Ophthalmology. 2014;121(7):1322–1332. doi:10.1016/j.ophtha.2014.01.021
27. Rao HL, Pradhan ZS, Weinreb RN, et al. regional comparisons of optical coherence tomography angiography vessel density in primary open-angle glaucoma. Am J Ophthalmol. 2016;171:75–83. doi:10.1016/j.ajo.2016.08.030
28. Yokoyama Y, Aizawa N, Chiba N, et al. Significant correlations between optic nerve head microcirculation and visual field defects and nerve fiber layer loss in glaucoma patients with myopic glaucomatous disk. Clin Ophthalmol. 2011;5:1721–1727.
29. Kiyota N, Kunikata H, Shiga Y, et al. Ocular microcirculation measurement with laser speckle flowgraphy and optical coherence tomography angiography in glaucoma. Acta Ophthalmol. 2018;96(4):e485–e492. doi:10.1111/aos.13801
 © 2019 The Author(s). This work is published and licensed by Dove Medical Press Limited. The
full terms of this license are available at https://www.dovepress.com/terms
and incorporate the Creative Commons Attribution
- Non Commercial (unported, 3.0) License.
By accessing the work you hereby accept the Terms. Non-commercial uses of the work are permitted
without any further permission from Dove Medical Press Limited, provided the work is properly
attributed. For permission for commercial use of this work, please see paragraphs 4.2 and 5 of our Terms.
© 2019 The Author(s). This work is published and licensed by Dove Medical Press Limited. The
full terms of this license are available at https://www.dovepress.com/terms
and incorporate the Creative Commons Attribution
- Non Commercial (unported, 3.0) License.
By accessing the work you hereby accept the Terms. Non-commercial uses of the work are permitted
without any further permission from Dove Medical Press Limited, provided the work is properly
attributed. For permission for commercial use of this work, please see paragraphs 4.2 and 5 of our Terms.