Back to Journals » Clinical Ophthalmology » Volume 15
Corneal Epithelial Thickness Profile in Healthy Portuguese Children by High-Definition Optical Coherence Tomography
Authors Loureiro TO ![]() , Rodrigues-Barros S, Lopes D, Carreira AR
, Rodrigues-Barros S, Lopes D, Carreira AR ![]() , Gouveia-Moraes F
, Gouveia-Moraes F ![]() , Vide-Escada A, Campos NP
, Vide-Escada A, Campos NP
Received 26 November 2020
Accepted for publication 25 December 2020
Published 24 February 2021 Volume 2021:15 Pages 735—743
DOI https://doi.org/10.2147/OPTH.S293695
Checked for plagiarism Yes
Review by Single anonymous peer review
Peer reviewer comments 2
Editor who approved publication: Dr Scott Fraser
Tomás de Oliveira Loureiro, Sandra Rodrigues-Barros, Diogo Lopes, Ana Rita Carreira, Filipe Gouveia-Moraes, Ana Vide-Escada, Nuno Patricio Campos
Ophthalmology Department, Hospital Garcia de Orta, Almada, Portugal
Correspondence: Tomás de Oliveira Loureiro
Ophthalmology Department, Hospital Garcia de Orta, Avenida Torrado da Silva, Almada, 2805-267, Portugal
Tel +351 913 513 175
Email [email protected]
Introduction and Objective: To evaluate corneal epithelial thickness (ET) and corneal thickness (CT) profiles in healthy eyes of Portuguese children and provide information to establish the first normative Caucasian database for these age group.
Methods: Sixty healthy eyes of 60 children aged between 8 and 18 were evaluated using the Cirrus high-definition optical coherence tomography device. The average ET and CT were assessed using Cirrus Review Software with predefined concentric corneal ring-shaped zones. Specific regions of ET (central, superior, inferior, temporal, nasal, superonasal, inferotemporal, superotemporal and inferonasal) were also assessed. The mean ET, the mean CT and the difference of ET in corresponding octants were compared by gender. Correlations between central epithelial thickness (CET), age and refractive error were evaluated.
Results and Discussion: The average ET was lower in the peripheric zones, whereas the average CT was higher. ET was thinner in the superior area than in the inferior (p< 0.05). ET was thicker in boys than in girls (p< 0.05), but CT did not differ. CET was not correlated with older age or refractive error.
Conclusion: Optical coherence tomography analysis of ET reveals that it is thinner in the periphery, where the CT is thicker. Unlike CT, ET seems to be influenced by gender. ET profile proved to be a useful tool in keratoconus diagnosis and subclinical keratoconus detection in adults. As epithelial changes occur early in the disease and keratoconus is more aggressive in pediatric population, a normative database of ET profile could contribute to enhance early recognition of the disease in this age group.
Keywords: epithelial thickness, AS-OCT, keratoconus, children
Introduction
The corneal epithelium is the outermost layer of the cornea. Beyond the protective role of the eye, it plays a major role while contributing to the refractive power of the eye.
Corneal epithelial thickness (ET) is not homogenously distributed and tends to alter its profile to compensate curvature and stromal irregularities in order to re-establish a regular and smooth ocular surface.1–3 These compensatory ET changes were described according to four rules by DZ Reinstein.4–9
Modifications in ET profile were reported after refractive procedures, contact lenses wear and in many pathologies such as dry eye and keratoconus (KC).10–14 Distribution of ET has been recognized as an important parameter in the diagnosis of forme fruste keratoconus in adults. Thinning of ET at the conus with surrounding thickening is an important manifestation in the earliest stages.3,15,16
Several imaging modalities have been used for ET measurement such as very high-frequency (VHF) digital ultrasound, confocal microscopy and anterior segment optical coherence tomography (AS-OCT). The latter, as a non-contact method and with negligent corneal infection risk, is a reliable modality for ET analyses.17–19 Prakash et al reported coefficients of reliability of 0.93 and reproducibility of 0.8 for ET measurement.19
Keratoconus usually initiates during adolescence and progresses until the third decade of life. It has a more severe course in children, with faster progression leading to poor visual outcomes. As such, early diagnosis is imperative and epithelial mapping can bring new and valuable information to enhance early diagnosis. However, normative database of these measurements is lacking for European children.
The aim of this study was to evaluate ET and corneal thickness CT in healthy eyes of Portuguese children, paving the way for a normative database for this age group.
Methods
This is a single center, prospective and randomized study that included healthy children between 8 and 18 years of age. Inclusion criteria were absence of corneal pathology, previous ocular surgery or trauma, no contact lens wearing in the past 3 months, best corrected visual acuity (BVCA) <0.1 logMAR, astigmatism <2 diopters (D), normal topography and tomographic parameters using Pentacam® (Belin-Ambrosio Deviation Value <1.22) and absence of family history of keratoconus.20 Children with history of eye rubbing were excluded. The study was conducted by the principles of the Declaration of Helsinki, the parents given their written informed consent and approval was obtained from the institutional Research Committee of Hospital Garcia de Orta (Almada, Portugal).
Ophthalmological evaluation included best corrected visual acuity (BCVA) presented in logMAR, spherical equivalent (SE) from the refraction of the correcting glasses, biomicroscopy of anterior segment and fundoscopy.
Corneal epithelial thickness (ET) and corneal thickness (CT) were automatically measured by anterior segment spectral-domain Cirrus 5000 HD-OCT (Carl Zeiss Meditec, Germany). The pachymetry map scan includes 8 radial scans (1024 axial scans each) repeated 5 times covering a 9mm diameter area. The children were positioned on the headrest looking to the fixation light and the image was centered on the pupil center. Two scans were obtained for each eye by one single examiner with a minute break and average values were registered.
The software algorithm measures ET as the distance between the middle of the first (tear film) and second (anterior surface of the Bowman layer) hyperreflective lines on the B-scan (Figure 1). CT was measured as the distance between the air-tear and cornea-aqueous interfaces.
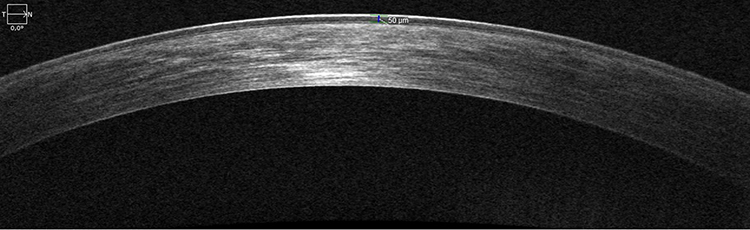 |
Figure 1 HD-OCT showing the hyperreflective epithelium boundaries, corresponding to tear film and anterior surface of Bowman layer, respectively. |
Data were exported and processed with Cirrus HD-OCT review software (version 10.0) which provides average automated ET of four concentric ring-shaped zones centered on the center of the cornea (central (CET): 0–2 mm, paracentral: 2–5 mm, midperipheral: 5–7 mm and peripheral: 7–9 mm) and CT from three concentric zones (central (CCT): 0–2 mm, paracentral: 2–5 mm and midperipheral 5–7mm). ET and CT were also presented for specific octants of the cornea: superior (S), inferior (I), temporal (T), nasal (N), superonasal (SN), superotemporal (ST), inferotemporal (IT) and inferonasal (IN) within the paracentral, midperipheral and peripheral zones. Associations between corresponding corneal regions were calculated and compared by gender for those overlapping rings.
A randomization 1:1 scheme was applied to select only one eye of each child. Qualitative variables are presented as numbers and percentages. Quantitative variables are presented as mean and standard deviation. Between-group analysis was performed using the Mann–Whitney-U-test. Within-group analysis was performed using the Wilcoxon or Friedman tests, as appropriate. Corrections for multiplicity were applied when appropriate. Correlations were tested using the Spearman correlation coefficient. Statistical significance was set at p<0.05 (two sided). IBM® SPSS® Statistics v23.0 was used.
Results
Our study included a total of 60 children, 31 boys (51.3%) and 29 girls (49.7%). The mean age was 12.2 ± 3.0 years (8–18 years) and there was no difference between boys and girls (11.7 ± 2.9 years vs 12.8 ± 3.12 years; p=0.89).
Thirty right-eyes (50%) and thirty left eyes (50%) were selected after randomization. The mean BCVA was 0.007 ± 0.023 logMAR (0–0.097 logMAR) and the mean SE was −0.24 ± 1 D (−2.00 - +2.00 D). There were no differences between gender (BCVA: p=0.89; SE: p=0.78). All eyes had unremarkable ophthalmological evaluation, regarding slit lamp microscopy, fundoscopy and no topographic or tomographic criteria for keratoconus.
The corneal epithelial thickness distribution is presented in Figure 2. There were no statistically significant differences between right and left eyes, as assessed using the Mann–Whitney-U-test. ET reduces from the center to the periphery (Table 1). Mean ET was 46.8 ± 2.8µm (46.1–47.5µm) in the center (CET), 45.8 ± 2.7µm (42–54µm) in the paracentral area, 44.6 ± 2.1µm (40–51µm) in the midperipheral area and 43.8 ± 2.2µm (39–50µm) in the peripheral area. Standard deviation (SD) was 2.5µm for CET, 2.7µm for paracentral ET, 2.1µm for midperipheral ET and 2.2µm for peripheral ET with no statistically significant differences between gender.
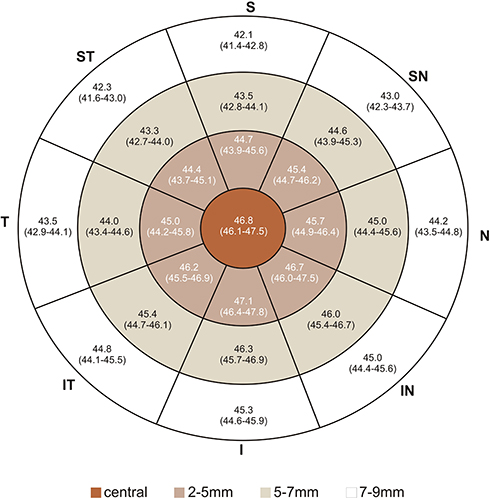 |
Figure 2 Representative corneal epithelial thickness map. Numbers represent mean (95% CI for mean). |
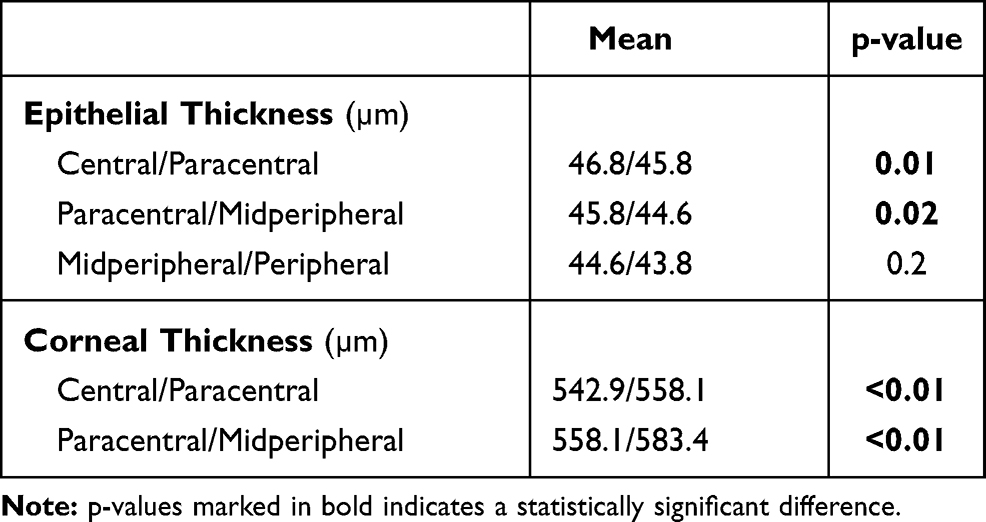 |
Table 1 Regional Mean Epithelial and Corneal Thickness Associations |
The associations between opposite octants are presented in Table 2. The highest ET difference was registered between inferior and superior octants. Inferior ET was higher than superior ET in each area, with statistical significance (p<0.01). The difference between inferior and superior octants (I-S) was 3.3 in the paracentral, 3.5 in the midperipheral and 3.6 in the peripheral areas. The difference between IN and ST was 2.1, 2.6, 2.7, respectively (p<0.01). The difference between IT and SN was 0.6, 0.8, 1.2 but it did not show any statistical significance (p=0.38; p=0.55; p=0.31, respectively). The lowest difference was between nasal and temporal quadrants: 0.7, 0.8, 0.9 (p=0.78; p=0.35; p=0.41). Same results were obtained when comparing by gender.
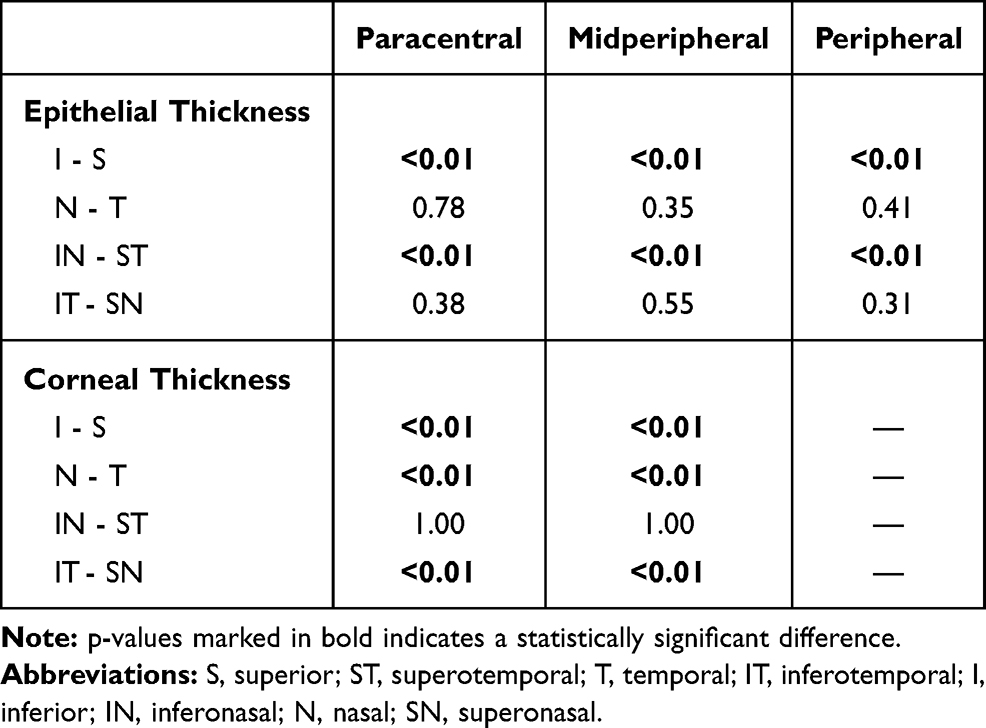 |
Table 2 Epithelial and Corneal Thickness Differences Between Opposite Octants |
Minimum ET was 44.5 ± 2.9µm, 42.9 ± 2.1µm, 41.5 ± 3.1µm and 39.3 ± 3.9µm from center to periphery, respectively, whereas maximum ET was 49.1 ± 3.3µm, 47.8 ± 3.7µm, 48.4 ± 3.7µm and 48.7 ± 4.8µm, respectively. The difference between the minimum and maximum ET (min-max) was −7.2, −6.1, −6.2 and −6.3, respectively, and no differences were registered between gender. The lowest ET was registered in superior and superotemporal octants whereas the highest ET value was registered in the inferior and inferonasal octants, in all concentric areas.
ET distribution by gender is presented in Figures 3 and 4. Mean ET was inferior in girls: in the center (p=0.03), in paracentral area (p=0.05) and in midperipheral area (p=0.04). In the paracentral area, superior (p=0.01), superotemporal (p=0.01) and temporal (p=0.02) ET was inferior in girls. In the midperipheral area, superior (p<0.01) and superotemporal (p=0.04) ET was also inferior in girls. There were no differences between gender in the peripheral area (Table 3).
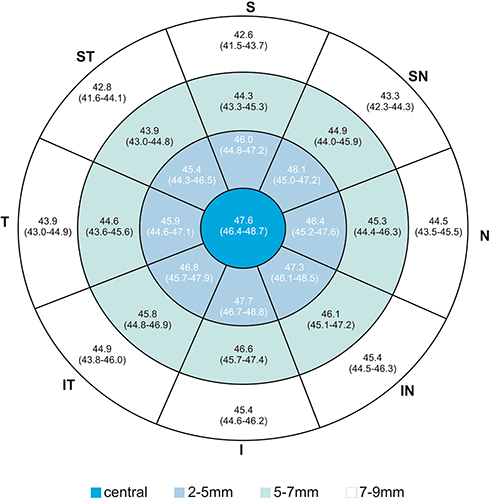 |
Figure 3 Representative corneal epithelial thickness in boys. Numbers represent mean (95% CI for mean). |
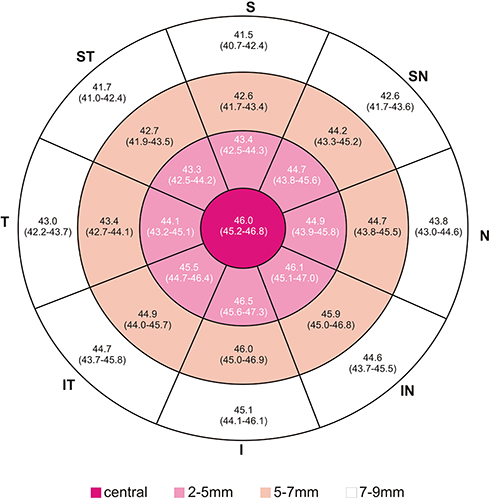 |
Figure 4 Representative corneal epithelial thickness in girls. Numbers represent mean (95% CI for mean). |
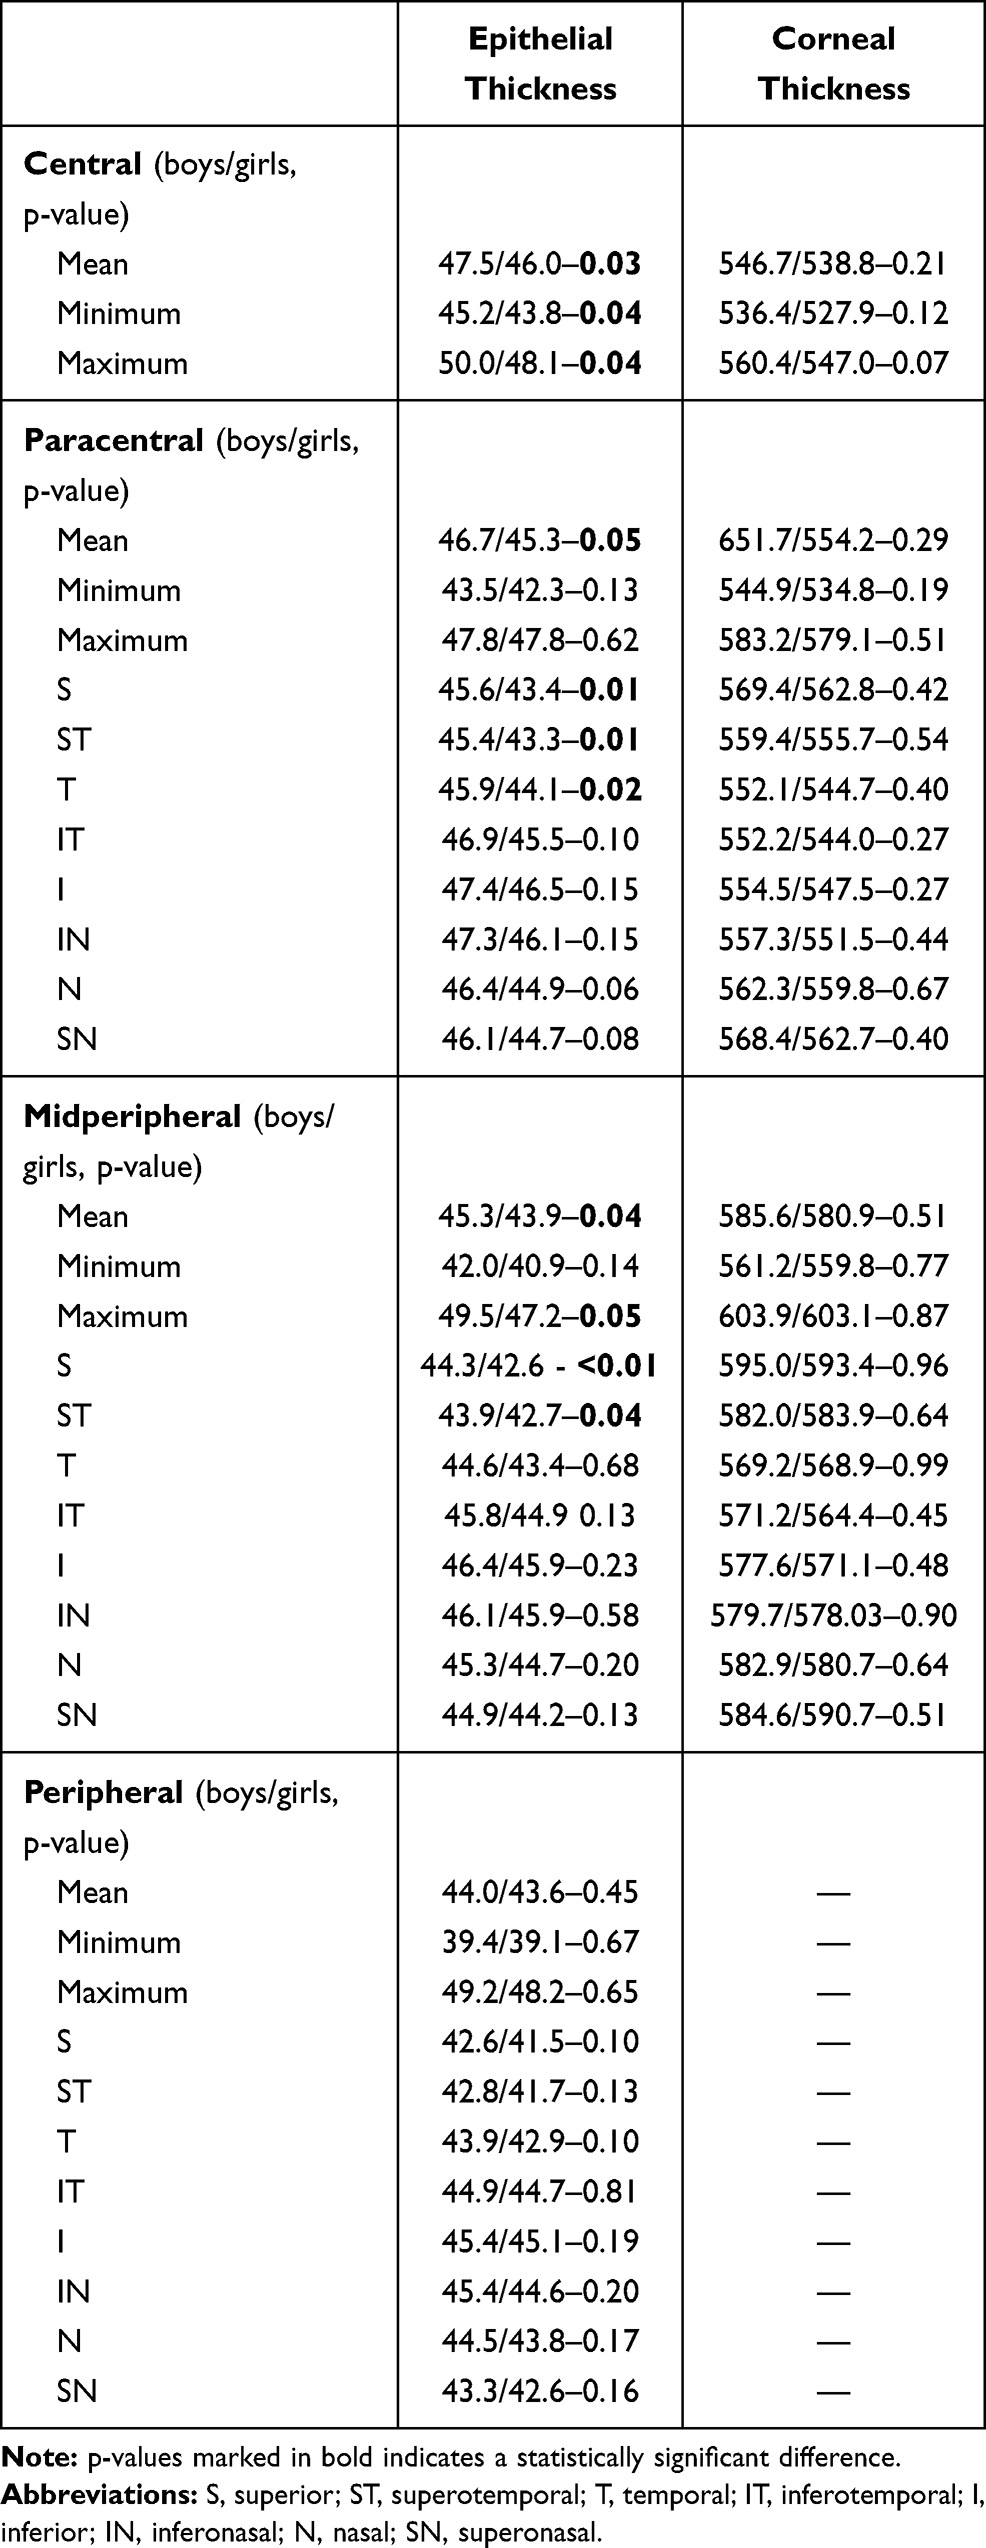 |
Table 3 Epithelial and Corneal Thickness Variations Between Gender |
Corneal thickness (CT) distribution is presented in Figure 5. CT increases from the center to the periphery (Table 1). CCT was 542.9 ± 25.9µm (536.2–549.6µm), 558.1 ± 26.7µm (520–624µm) in the paracentral area and 583.4 ± 25.9µm (536–635µm) in the midperipheral area. The lowest CT was registered in temporal, inferotemporal and inferior octants whereas the highest values were registered in the superior and superotemporal octants.
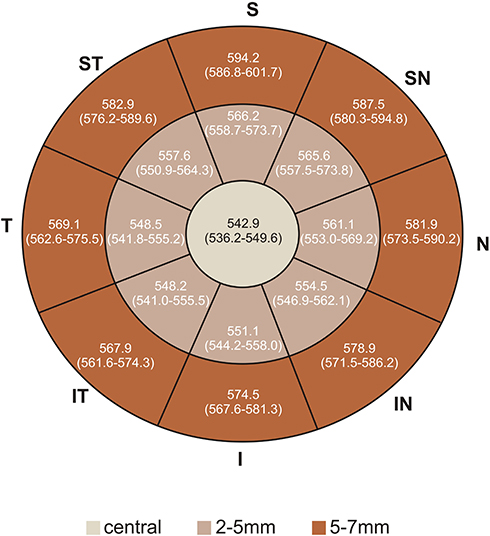 |
Figure 5 Representative corneal thickness map. Numbers represente mean (95% CI for mean). |
CT distribution by gender is presented in Figures 6 and 7. There were no differences between gender (Table 3).
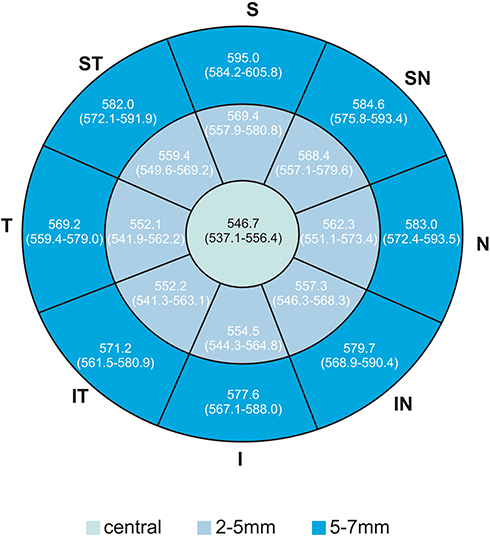 |
Figure 6 Representative corneal epithelial thickness map in boys. Numbers represent mean (95% CI for mean). |
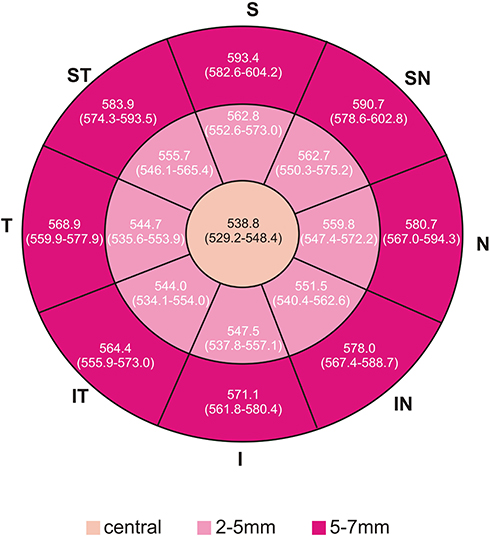 |
Figure 7 Representative corneal epithelial thickness map in girls. Numbers represent mean (95% CI for mean). |
There were no statistically significant correlations, as tested by Spearman rho, between age and CET (p=0.4), paracentral ET (p=0.43), midperipheral ET (p=0.51) and peripheral ET (p=0.34). Similarly, no correlations were found between SE and CET (p=0.81), paracentral ET (p=0.73), midperipheral ET (p=0.75) and peripheral ET (p=0.76).
There were no correlations between age and CCT (p=0.51), paracentral ET (p=0.53), midperipheral CT (p=0.49) and peripheral CT (p=0.44). Similarly, no correlations found between SE and CCT (p=0.73), paracentral CT (p=0.77), midperipheral CT (p=0.76) and peripheral CT (p=0.76).
Discussion
The corneal epithelium is outermost anterior layer of the cornea and, apart from maintaining ocular surface integrity, it contributes to the refractive power of the eye. Epithelium alone represents 1.03D in the 2mm central diameter and 0.85D over the 3.6 mm diameter corneal area.21 Additionally, this layer plays a dynamic role in establishing corneal regularity. Alfred Vogt was the first to show that the epithelium has the ability to alter its thickness facing stromal irregularities, contributing for a smooth ocular surface and enhancing vision.22 Later on, compensatory ET changes were reunited in four rules: 1 – epithelium thickens in areas where tissue has been removed or the curvature has been flattened;6–8 2 – epithelium thins over regions that are elevated or the curvature steepened;4,5 3 – the more irregular the topography, the more epithelial remodeling occurs; 4 – the amount of epithelial remodeling is defined by the rate of change of curvature of an irregularity.9
Epithelial thickness was first-time measured in vivo in 1993 by Reinstein et al, using VHF digital ultrasound. In vivo confocal microscopy proved to be a reliable tool but has shown to provide lower ET values than VHF digital ultrasound.23 Spectral domain anterior segment optical coherence tomography (AS-OCT), the most widely used method in recent years, measures the epithelial and full corneal thickness and provides reliable thickness maps with 5µm resolution but also provides lower values than VHF digital ultrasound.24 Corneal epithelial thickness is gaining popularity as a screening tool for corneal ectatic diseases and for predicting the risk of corneal ectasia after refractive ablative surgery.25–27 Its thickness and distribution modifications were described for some ocular disorders in adults, particularly keratoconus.28,29
The majority of papers regarding epithelial thickness with OCT were performed in healthy adults. The average ET reported were between 50 and 55 µm in adults and were nearly the same in Asian children.30,31 In our study, ET were slightly inferior. However, these could be only a device-dependent variation. To our best knowledge, there is only one study using Zeiss Cirrus 5000 HD-OCT, in healthy adults, which reported values closer to the ones present in our children, mimicking the results observed in Asian adults and children.29
The epithelium thins as it approaches the periphery, whereas the cornea thickens.30,32,33 Epithelium has shown to be thinner in superior quadrants than in inferior ones, both in adults and children.30,31 King Smith explained this with the gravity of tear film flow, as the inferior pooling could falsely lead to thicker readings in inferior area.34 Reinstein opposed this theory and, using very high frequency (VHF) digital ultrasound, a contact method that excludes the tear film from analyses due to immersion of the eye in a saline solution, concluded that inferior meridian was thicker than superior. He pointed out that tarsus, while blinking, presses the epithelium with larger force being applied on the superior meridian.12 Hashmani et al proposed that superior meridian thins due to shorter contact time with tear film, less nourishing effects and more pronounced desquamation leading to overtime thinning.30 In our paper, ET followed the same distribution.
Nasal ET was found to be thicker than temporal ET, both in adults and children, as a result of nasal cornea to be more protected from tarsus rubbing and, for example from eye rubbing.29,31 In our paper, we did not find a statistically significant difference between these quadrants maybe because applied force on epithelium by tarsus in children is evenly distributed or because eye rubbers were excluded.
Regarding gender, the ET has been reported to be inferior in females, with differences ranging from 1 to 2µm.35,36 In children, ET was also inferior in girls.31 In our paper, we found ET to be 1.5µm higher in boys. This difference could be explained by hormonal factors.35,36 The lack of difference in the peripheral area could be due to high variable measurements and loss of reproducibility in the periphery due to signal degradation.24
Regarding ET age variation, studies are inconsistent. VHF studies and Wang, using AS-OCT did not find differences in adults.12 However, Wu, Yang and Kim found ET to decrease with age.37,38 Kanellopoulos et al pointed that as the person ages, the readings become more variable and less reliable.39 Regarding children, Ma et al found ET to increase with age in pediatric population.31 We did not find any correlation between ET and age in pediatric population. As in most studies, we did not also find correlation between ET and spherical equivalent.
ET measurements and distribution proved to be a useful tool in keratoconus diagnosis in adults and could be valuable in subclinical keratoconus detection. Epithelial changes could be the first detectable alterations.40
The plasticity of the epithelium was identified in early KC stages. Here, the epithelium thins at the apex of the cone and thickens in the surrounding area, in a “doughnut pattern”, what could detect a cone hidden by the epithelium.15 Using epithelial thickness maps, 50% of topographically normal fellow eyes of KC eyes have been found to have KC.11 As the KC are mostly located in the inferior quadrants, the distribution of ET could change and become more variable. In KC, the minimum CET could be found in the inferior area instead of the superior observed in normal eyes41 and higher differences could be registered between minimum and maximum ET (min-max).4 Due to this, it is extremely important to know physiologic thickness distribution.
Li et al and Silverman et al developed highly accurate computerized algorithms to differentiate normal and keratoconic corneas based on ET.3,4 Vega Estrada et al even showed a correlation between ET measurements and the degree of visual impairment in keratoconus.42 ET can also aid in KC progression detection as the inferior ET is lower in paracentral area in progressive KC compared to stable KC at the same disease stage.43
KC in pediatric population has several differences compared to adults. The diagnosis may be more challenging and KC is usually detected in more advanced stages since children are less prone to complain, they usually maintain good binocular vision until the dominant eye gets impaired and ocular aberrations from KC could be partially compensated by their high accommodative power.44,45 Moreover, the cone is usually located near the center so irregular astigmatism is less pronounced in children.46
For these reasons, children are often undiagnosed and untreated. In a large series, at the time of diagnosis, 27.8% of pediatric KC were in an advanced stage versus 7.8% in adults. The annual progression rate was 88% in children.47 As children experience faster KC progression, early detection and treatment is imperative to prevent irreversible vision impairment.
AS-OCT is a quick and non-invasive method, with no risk of infection, and proved to be valuable tool for subclinical KC detection in adults.11 As such, it could be an attractive modality for KC screening in children, leading to early intervention and preventing vision loss and need for corneal transplantation. To take advantage of AS-OCT, it is important to create normative database for further improve our knowledge on the role of AS-OCT in KC screening in children. Modifications from the normal distribution of ET, such as the difference between opposite octants should raise suspicion.
We acknowledge that the small sample could preclude more strengthness of the study, however, this is the first study in a European pediatric population. Although VHF-US has superior accuracy (1um) over AS-OCT, it would be extremely difficult to use in this population due to eye contact.
This is the first time that peripheral epithelium is studied in children, which may be useful for recognizing patterns of modifications between corneal zones. We aim to provide the basis for prospective ongoing clinical trials to study the differences between normal and KC eyes.
Conclusion
Optical coherence tomography analysis of corneal epithelial thickness reveals that it is thinner in the periphery and in superior quadrants whereas it is thicker in the inferior quadrants. Unlike epithelial thickness that is higher in boys, corneal thickness does not seem to be influenced by gender. Gender-based variations in corneal profile should be considered when evaluating patients suspected to have corneal disease, namely keratoconus. As the epithelial changes occur early in the disease, this normative database could be a helpful tool in pediatric patients to enhance early keratoconus diagnosis.
Disclosure
The authors have no conflicts of interest to declare.
References
1. Reinstein DZ, Silverman RH, Sutton HFS, Coleman DJ. Very high-frequency ultrasound corneal analysis identifies anatomic correlates of optical complications of lamellar refractive surgery: anatomic diagnosis in lamellar surgery. Ophthalmology. 1999;106:474–482. doi:10.1016/S0161-6420(99)90105-7
2. Huang D, Tang M, Shekhar R. Mathematical model of corneal surface smoothing after laser refractive surgery. Am J Ophthalmol. 2003;135:267–278. doi:10.1016/S0002-9394(02)01942-6
3. Silverman RH, Urs R, Roychoudhury A, Archer TJ, Gobbe M, Reinstein DZ. Epithelial remodeling as basis for machine-based identification of keratoconus. Investig Ophthalmol Vis Sci. 2014;55:1580. doi:10.1167/iovs.13-12578
4. Li Y, Tan O, Brass R, Weiss JL, Huang D. Corneal epithelial thickness mapping by Fourier-domain optical coherence tomography in normal and keratoconic eyes. Ophthalmology. 2012;119:2425–2433. doi:10.1016/j.ophtha.2012.06.023
5. Rocha KM, Perez-Straziota CE, Stulting RD, Randleman JB. SD-OCT analysis of regional epithelial thickness profiles in keratoconus, postoperative corneal ectasia, and normal eyes. J Refract Surg. 2013;29:173–179. doi:10.3928/1081597X-20130129-08
6. Reinstein DZ, Srivannaboon S, Gobbe M, et al. Epithelial thickness profile changes induced by myopic LASIK as measured by artemis very high-frequency digital ultrasound. J Refract Surg. 2009;25:444–450. doi:10.3928/1081597X-20090422-07
7. Reinstein DZ, Archer TJ, Gobbe M. Change in epithelial thickness profile 24 hours and longitudinally for 1 year after myopic LASIK: three-dimensional display with artemis very high-frequency digital ultrasound. J Refract Surg. 2012;28:195–201. doi:10.3928/1081597X-20120127-02
8. Reinstein DZ, Archer TJ, Gobbe M, Silverman RH, Coleman DJ. Epithelial thickness after hyperopic LASIK: three-dimensional display with artemis very high-frequency digital ultrasound. J Refract Surg. 2010.
9. Reinstein DZ, Archer T. Combined Artemis very high-frequency digital ultrasound-assisted transepithelial phototherapeutic keratectomy and wavefront-guided treatment following multiple corneal refractive procedures. J Cataract Refract Surg. 2006;32:1870–1876. doi:10.1016/j.jcrs.2006.07.016
10. Cheng HC, Lin KK, Chen YF, Hsiao CH. Pseudokeratoconus in a patient with soft contact lens-induced keratopathy: assessment with Orbscan I. J Cataract Refract Surg. 2004;30:925–928. doi:10.1016/j.jcrs.2003.08.016
11. Reinstein DZ, Archer TJ, Urs R, Gobbe M, RoyChoudhury A, Silverman RH. Detection of keratoconus in clinically and algorithmically topographically normal fellow eyes using epithelial thickness analysis. J Refract Surg. 2015;31:736–744. doi:10.3928/1081597X-20151021-02
12. Reinstein DZ, Gobbe M, Archer TJ, Silverman RH, Coleman J. Epithelial, stromal, and total corneal thickness in keratoconus: three-dimensional display with artemis very-high frequency digital ultrasound. J Refract Surg. 2010.
13. Wang J, Fonn D, Simpson TL. Topographical thickness of the epithelium and total cornea after hydrogel and PMMA contact lens wear with eye closure. Investig Ophthalmol Vis Sci. 2003.
14. Pérez JG, Méijome JMG, Jalbert I, Sweeney DF, Erickson P. Corneal epithelial thinning profile induced by long-term wear of hydrogel lenses. Cornea. 2003;22:304–307. doi:10.1097/00003226-200305000-00005
15. Reinstein DZ, Archer TJ, Gobbe M. Corneal epithelial thickness profile in the diagnosis of keratoconus. J Refract Surg. 2009;25:604–610. doi:10.3928/1081597X-20090610-06
16. Kanellopoulos AJ, Aslanides IM, Asimellis G. Correlation between epithelial thickness in normal corneas, untreated ectatic corneas, and ectatic corneas previously treated with CXL; is overall epithelial thickness a very early ectasia prognostic factor? Clin Ophthalmol. 2012;789. doi:10.2147/OPTH.S31524
17. Li Y, Meisler DM, Tang M, et al. Keratoconus diagnosis with optical coherence tomography pachymetry mapping. Ophthalmology. 2008;115:2159–2166. doi:10.1016/j.ophtha.2008.08.004
18. Li Y, Tang M, Zhang X, Salaroli CH, Ramos JL, Huang D. Pachymetric mapping with Fourier-domain optical coherence tomography. J Cataract Refract Surg. 2010;36:826–831. doi:10.1016/j.jcrs.2009.11.016
19. Prakash G, Agarwal A, Mazhari AI, et al. Reliability and reproducibility of assessment of corneal epithelial thickness by fourier domain optical coherence tomography. Investig Ophthalmol Vis Sci. 2012;53:2580. doi:10.1167/iovs.11-8981
20. Ambrósio R, Valbon BF, Faria-Correia F, Ramos I, Luz A. Scheimpflug imaging for laser refractive surgery. Curr Opin Ophthalmol. 2013;24:310–320. doi:10.1097/ICU.0b013e3283622a94
21. Simon G, Ren Q, Kervick GN, Parel JM. Optics of the corneal epithelium. Refract Corneal Surg. 1993.
22. Fisher RF. Textbook and atlas of slit lamp microscopy of the living eye. Br J Ophthalmol. 1980;64:381. doi:10.1136/bjo.64.5.381-a
23. Li HF, Petroll WM, Møller-Pedersen T, Maurer JK, Cavanagh HD, Jester JV. Epithelial and corneal thickness measurements by in vivo confocal microscopy through focusing (CMTF). Curr Eye Res. 1997;16:214–221. doi:10.1076/ceyr.16.3.214.15412
24. Reinstein DZ, Yap TE, Archer TJ, Gobbe M, Silverman RH. Comparison of corneal epithelial thickness measurement between Fourier-domain OCT and very high-frequency digital ultrasound. J Refract Surg. 2015;31:438–445. doi:10.3928/1081597X-20150623-01
25. Randleman JB, Woodward M, Lynn MJ, Stulting RD. Risk assessment for ectasia after corneal refractive surgery. Ophthalmology. 2008;115:37–50.e4. doi:10.1016/j.ophtha.2007.03.073
26. Ambrósio R, Dawson DG, Salomão M, Guerra FP, Caiado ALC, Belin MW. Corneal ectasia after LASIK despite low preoperative risk: tomographic and biomechanical findings in the unoperated, stable, fellow eye. J Refract Surg. 2010;26:906–911. doi:10.3928/1081597X-20100428-02
27. Klein SR, Epstein RJ, Randleman JB, Stulting RD. Corneal ectasia after laser in situ keratomileusis in patients without apparent preoperative risk factors. Cornea. 2006;25:388–403. doi:10.1097/01.ico.0000222479.68242.77
28. Baghdasaryan E, Tepelus TC, Marion KM, Bagherinia H, Sadda SR, Hsu HY. Evaluation of corneal epithelial thickness imaged by high definition optical coherence tomography in healthy eyes. Cornea. 2019;38:62–66. doi:10.1097/ICO.0000000000001745
29. Samy MM, Shaaban YM, Badran TAF. Age- and sex-related differences in corneal epithelial thickness measured with spectral domain anterior segment optical coherence tomography among Egyptians. Med (United States). 2017.
30. Hashmani N, Hashmani S, Saad CM. Wide corneal epithelial mapping using an optical coherence tomography. Invest Ophthalmol Vis Sci. 2018;59:1652. doi:10.1167/iovs.17-23717
31. Ma Y, Zhu X, He X, Lu L, Zhu J, Zou H. Corneal thickness profile and associations in Chinese children aged 7 to 15 years old. PLoS One. 2016.
32. Feng Y, Simpson TL. Corneal, limbal, and conjunctival epithelial thickness from optical coherence tomography. Optom Vis Sci. 2008;85:E880–E883. doi:10.1097/OPX.0b013e318185272d
33. Du C, Wang J, Cui L, Shen M, Yuan Y. Vertical and horizontal corneal epithelial thickness profiles determined by ultrahigh resolution optical coherence tomography. Cornea. 2012;31:1036–1043. doi:10.1097/ICO.0b013e31823f8d56
34. King-Smith PE, Fink BA, Fogt N, Nichols KK, Hill RM, Wilson GS. The thickness of the human precorneal tear film: evidence from reflection spectra. Investig Ophthalmol Vis Sci. 2000.
35. Giuffrè G, Di Rosa L, Fiorino F, Bubella DM, Lodato G. Variations in central corneal thickness during the menstrual cycle in women. Cornea. 2007;26:144–146. doi:10.1097/01.ico.0000244873.08127.3c
36. Gupta PD, Johar K, Nagpal K, Vasavada AR. Sex hormone receptors in the human eye. Surv Ophthalmol. 2005;50:274–284. doi:10.1016/j.survophthal.2005.02.005
37. Wu Y, Wang Y. Detailed distribution of corneal epithelial thickness and correlated characteristics measured with SD-OCT in myopic eyes. J Ophthalmol. 2017;2017:1–8. doi:10.1155/2017/1018321
38. Kim BJ, Ryu IH, Kim SW. Age-related differences in corneal epithelial thickness measurements with anterior segment optical coherence tomography. Jpn J Ophthalmol. 2016;60:357–364. doi:10.1007/s10384-016-0457-x
39. Kanellopoulos AJ, Asimellis G. In vivo three-dimensional corneal epithelium imaging in normal eyes by anterior-segment optical coherence tomography: a clinical reference study. Cornea. 2013;32:1493–1498. doi:10.1097/ICO.0b013e3182a15cee
40. Kalkan Akcay E, Uysal BS, Sarac O, et al. The effect of corneal epithelium on corneal curvature in patients with keratoconus. Semin Ophthalmol. 2015;30:364–371. doi:10.3109/08820538.2013.874490
41. Temstet C, Sandali O, Bouheraoua N, et al. Corneal epithelial thickness mapping using Fourier-domain optical coherence tomography for detection of form fruste keratoconus. J Cataract Refract Surg. 2015;41:812–820. doi:10.1016/j.jcrs.2014.06.043
42. Vega-Estrada A, Mimouni M, Espla E, Alió Del Barrio J, Alio JL. Corneal epithelial thickness intrasubject repeatability and its relation with visual limitation in keratoconus. Am J Ophthalmol. 2019;200:255–262. doi:10.1016/j.ajo.2019.01.015
43. Serrao S, Lombardo G, Calì C, Lombardo M. Role of corneal epithelial thickness mapping in the evaluation of keratoconus. Contact Lens Anterior Eye. 2019;42:662–665. doi:10.1016/j.clae.2019.04.019
44. Sahebjada S, Fenwick EK, Xie J, Snibson GR, Daniell MD, Baird PN. Impact of keratoconus in the better eye and the worse eye on vision-related quality of life. Investig Ophthalmol Vis Sci. 2014;55:412. doi:10.1167/iovs.13-12929
45. Schlegel Z, Lteif Y, Bains HS, Gatinel D. Total, corneal, and internal ocular optical aberrations in patients with keratoconus. J Refract Surg. 2009;25:S951–S957. doi:10.3928/1081597X-20090915-10
46. Soeters N, Van Der Valk R, Tahzib NG. Corneal cross-linking for treatment of progressive keratoconus in various age groups. J Refract Surg. 2014;30:454–460. doi:10.3928/1081597X-20140527-03
47. Olivo-Payne A, Abdala-Figuerola A, Hernandez-Bogantes E, Pedro-Aguilar L, Chan E, Godefrooij D. Optimal management of pediatric keratoconus: challenges and solutions. Clin Ophthalmol. 2019;Volume 13:1183–1191. doi:10.2147/OPTH.S183347
 © 2021 The Author(s). This work is published and licensed by Dove Medical Press Limited. The
full terms of this license are available at https://www.dovepress.com/terms
and incorporate the Creative Commons Attribution
- Non Commercial (unported, 3.0) License.
By accessing the work you hereby accept the Terms. Non-commercial uses of the work are permitted
without any further permission from Dove Medical Press Limited, provided the work is properly
attributed. For permission for commercial use of this work, please see paragraphs 4.2 and 5 of our Terms.
© 2021 The Author(s). This work is published and licensed by Dove Medical Press Limited. The
full terms of this license are available at https://www.dovepress.com/terms
and incorporate the Creative Commons Attribution
- Non Commercial (unported, 3.0) License.
By accessing the work you hereby accept the Terms. Non-commercial uses of the work are permitted
without any further permission from Dove Medical Press Limited, provided the work is properly
attributed. For permission for commercial use of this work, please see paragraphs 4.2 and 5 of our Terms.