Back to Journals » Clinical Ophthalmology » Volume 12
Comparison of optical biometry versus ultrasound biometry in cases with borderline signal-to-noise ratio
Authors Chia TMT, Nguyen MT, Jung HC ![]()
Received 6 April 2018
Accepted for publication 20 July 2018
Published 10 September 2018 Volume 2018:12 Pages 1757—1762
DOI https://doi.org/10.2147/OPTH.S170301
Checked for plagiarism Yes
Review by Single anonymous peer review
Peer reviewer comments 3
Editor who approved publication: Dr Scott Fraser
Tao Ming Thomas Chia,1 Minh T Nguyen,2 Hoon C Jung3,4
1Roski Eye Institute, University of Southern California, Los Angeles, CA, USA; 2Department of Ophthalmology and Visual Sciences, University of Wisconsin School of Medicine and Public Health, Madison, WI, USA; 3Department of Ophthalmology, University of Washington, Seattle, WA, USA; 4Eye Clinic, VA Puget Sound Health Care System, Seattle, WA, USA
Purpose: To ascertain if optical biometry determination of axial length (AL) and intraocular lens (IOL) power is significantly different compared to ultrasound (US) biometry in cases with borderline signal-to-noise ratio (SNR).
Patients and methods: Sixty patients who had cataract and IOL Master biometry with borderline SNR (1.6–2.0) were included. A retrospective chart review was performed to compare data collected with optical biometry and US biometry in cataract cases with borderline SNR.
Results: Results showed that optical biometry IOL and AL measurements were not significantly different from the US measurements. Analysis also demonstrated good agreement between the two methods.
Conclusion: Our study suggests that, in cases of borderline quality data, IOL power and AL measurements with optical biometry are still useful in surgical planning and that additional US measurements may be used more as a corroborative tool.
Keywords: cataract, intraocular lens, optical biometry, ultrasound biometry
Introduction
With an incidence of 53.7%, cataract remains a significant ophthalmic morbidity where surgical treatment continues to be the definitive treatment and active area of research.1,2 An increasing number of technologies have been introduced over time to assist in biometric measurement of the eye, further enhancing refractive accuracy and precision as an achievable quality metric.
Optical biometry has been one of the mainstay elements in biometry over the past two decades, essentially supplanting routine use of applanation and immersion-based ultrasound (US) for most cataract assessments.3–6 However, this technique has inherent limitations based on use of wavelengths in this region of the electromagnetic spectrum. Data quality for optical biometry is frequently diminished in cases of very dense cataracts and posterior subcapsular cataracts, and this can be quantified in the form of signal-to-noise ratio (SNR).7–9 Olsen et al reported a minimum difference in axial length (AL) between optical biometry and US at an SNR value of ≥2.1. They also found that the rate of error started increasing at SNR of 2.0 and reached its peak at approximately 1.3.10 In these clinical scenarios, it is common to then rely on applanation or immersion US, which serves as either an adjunct or primary biometric device for surgical planning.11 When optical biometry results in clear-cut poor quality data, US often is the only tool available, though this typically requires more time, human personnel power, extra training and a higher level of patient contact.12–19
What is less known is how different technologies compare when signal from the optical biometry is of borderline quality, which could result from poor patient fixation, high refractive error, dense media opacities or posterior subcapsular cataract.20,21 The objective of this study was to determine the differences in AL and recommended intraocular lens (IOL) power measured in the same eye with these methods when optical biometry yields borderline quality results.
Patients and methods
This retrospective medical record review research project was approved by the Institutional Review Board of Department of Veteran Affairs (VA) Puget Sound Health Care System, and the study protocol adhered to the tenets of the Declaration of Helsinki. Electronic medical records were searched for patients who underwent cataract surgery at a single hospital-based eye clinic after they received both optical biometry with the IOL Master (IOLMaster 500, Carl Zeiss Meditec, Dublin, CA, USA) and US biometry (Eyecubed, Ellex Inc., Minneapolis, MN, USA) prior to surgery. Since this is a low-risk retrospective study and all patients were de-identified prior to data analysis, the Institutional Review Board at VA Puget Sound has waived the need for informed consent (FWA00004617).
Patients who had IOL Master biometry with borderline SNR (1.6–2.0) were included, while patients with good SNR (>2.0), poor SNR (<1.6), and borderline SNR associated with non-physiologic AL values were excluded (Figure 1). A total of 60 patients and 95 eyes were reviewed. Of the 22 patients who met the inclusion criteria, 25 eyes were analyzed for IOL power, while 27 eyes were analyzed for AL. All optical biometry and US scans were performed by the same two experienced personnel. Of note, these personnel separately took measurements on different eyes.
 | Figure 1 Different levels of signal quality resulting from optical biometry. |
The Holladay 1 IOL formula was used for comparison for each biometric unit with an identical surgeon factor. Additional analysis with the Hoffer Q (fixed identical peripheral anterior chamber depth [pACD]), SRK-T (fixed identical A constant) and average of all three formulae was also performed. The calculated IOL power for one single piece acrylic IOL (ZCB00, Abbott Medical Optics Inc., Santa Ana, CA, USA) in the capsular bag with a refractive target of −0.50 and the mean AL were then compared.
Statistical analysis was performed using SPSS version 24 (IBM Corporation, New York, NY, USA) with P<0.05 considered statistically significant.
Results
The mean AL for IOL Master was 24.391 mm, and the mean AL for US biometry was 24.336 mm. The mean difference of AL determination was 0.055 mm (95% CI, −0.013–0.1219). The mean difference of IOL power calculation between IOL Master and US biometry was 0.092 D (Holladay I), 0.204 D (Hoffer Q), 0.130 D (SRK-T) and 0.093 D (average of all three formulae) (Table 1). Figure 2A shows how the IOL power calculations obtained with IOL Master and US biometry compare side by side. Figure 2B shows how the AL measurements obtained with IOL Master and US biometry compare to each other. IOL Master AL measurements were not significantly different from US biometry measurements by 0.1 mm (P=0.1769) or by 0.03 mm (P=0.463) (Table 2).
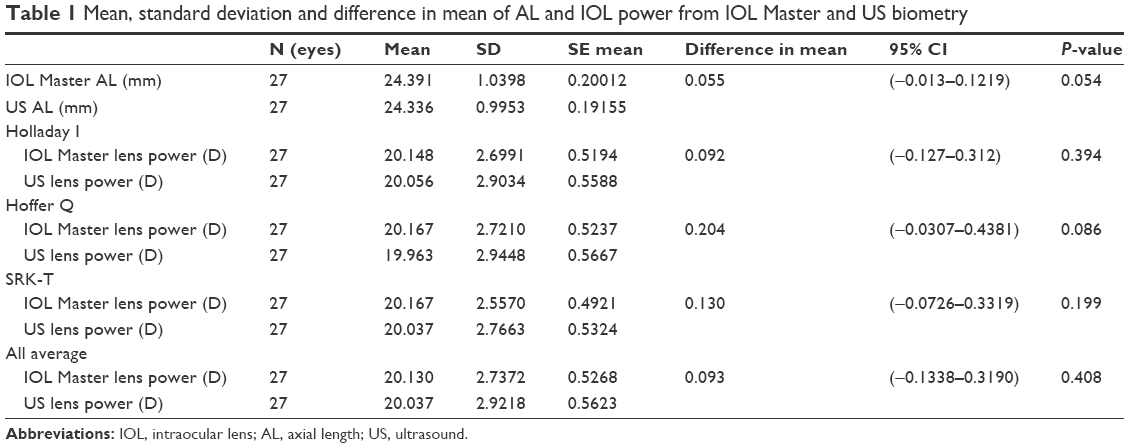 | Table 1 Mean, standard deviation and difference in mean of AL and IOL power from IOL Master and US biometry |
 | Figure 2 Box plots comparing corresponding data obtained from IOL Master and US biometry. |
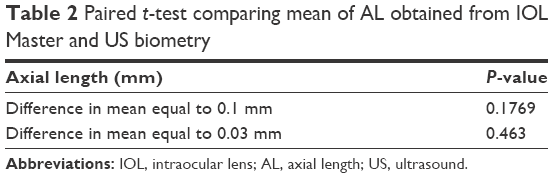 | Table 2 Paired t-test comparing mean of AL obtained from IOL Master and US biometry |
In addition, there was good correlation between biometry for AL (R=0.968) and IOL power calculation (R=0.987). The Bland–Altman plots in Figure 3 show the relationship between IOL Master and US biometry measurements for AL, as well as IOL power using Holladay I, Hoffer Q, SRK-T and the average of 3 formulae, with the variability around the mean appearing to be ±0.34, ±1.09, ±1.17, ±1.0, and ±1.12, respectively.
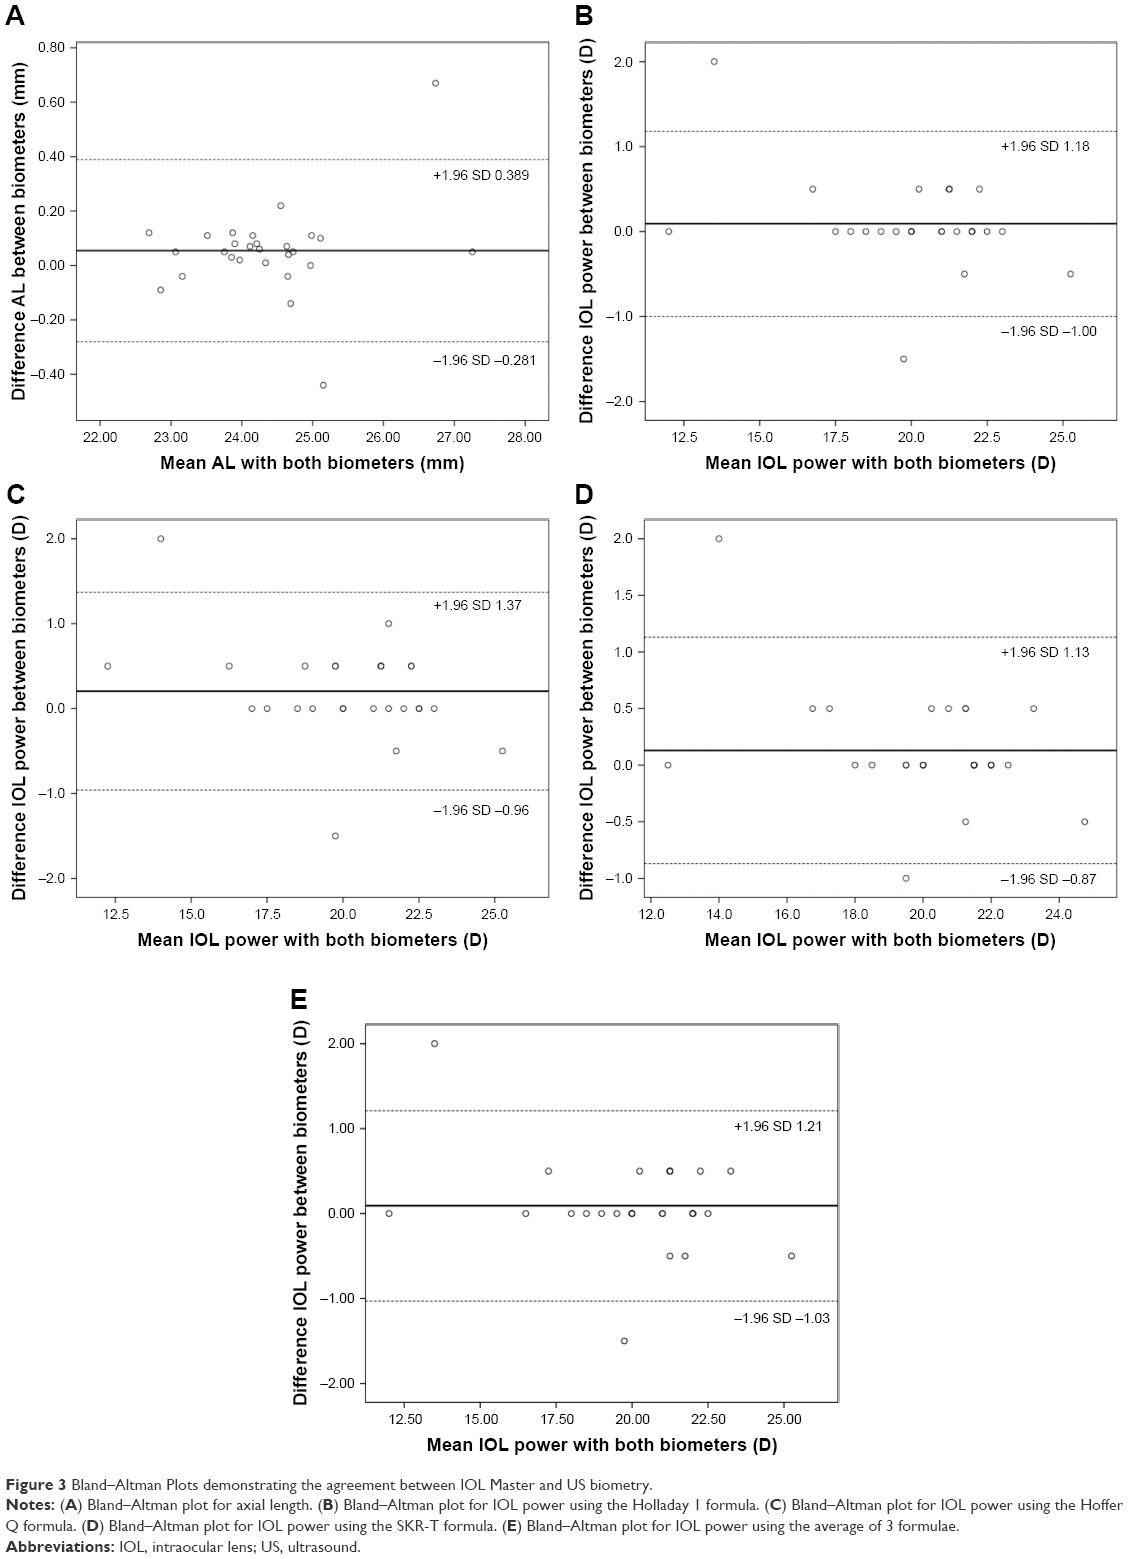 | Figure 3 Bland–Altman Plots demonstrating the agreement between IOL Master and US biometry. |
Discussion
Optical biometry offers many distinct advantages compared to US-guided biometry. It is a non-contact approach with likely accuracy and reproducibility in the context of non-severe pathology. When limitations such as dense media opacity, high axial myopia, and/or poor fixation prevent use of optical biometry, US-guided biometry becomes a useful alternative method, as it can be used in cases with significant media opacity.13–16
In this study, we compared optical biometry and US biometry in cataract cases with borderline SNR (1.6–2.0) to better assist cataract surgeons in decision making. Similarly, there were no statistically significant differences in AL measurements between the two groups. We know from previous studies that optical biometry measurements are most reliable when SNR is >2.0, while SNR of ≤1.3 results in the largest variance between optical and US biometry.10 However, little is established in literature for cases with borderline SNR. The results from this study help to determine that in such cases, optical biometry (IOL Master in particular) may still be utilized or, at the very least, clinically relevant when making IOL selections for a specific refractive target.
Even in cases where high-quality data is available, our results and literature also suggest that there is still room for improvement in order to achieve more precise post-operative refractive results. It is therefore still important to any discussion of cataract surgery that there may be a role for spectacles after surgery despite the array of treatments, technologies and formulae. A recent study in 2017 reported 49% of patients were still spectacle-dependent for distance after cataract extraction with IOL implant using the most advanced technologies to target emmetropia. In addition, there was a strong correlation between the use of spectacles post-operatively and surgeons’ advice to obtain them for optimal refractive outcome.22
Precise and accurate biometric data is a fundamental requirement for successful refractive outcomes with cataract surgery. However, pathology often highlights technological related limitations where data of lower quality is the best available. Newer modalities including those utilizing Swept source-based technologies are being integrated to overcome the technological limitations of prior generation biometry.23 Other fronts of improvement include intra-operative aberrometry where in vivo calculations can be used to corroborate pre-operative assessment for confirmation or modification of initial peri-operative plans. These additional tools are most likely useful when there is general agreement among technologies.24
For future purposes, additional review in the form of refractive outcomes from the surgery and post-operative axial length measurements would further elucidate the relative consistency between optical biometry and US as well as cataractous and non-cataractous states.
Conclusions
In conclusion, optical and US biometry compare favorably with no clinically significant difference in IOL power and axial length measurements when SNR is of borderline quality. Optical biometry still proves clinically useful in planning for such cases. Interestingly, and still an area of active interest, optical biometry can yield clinically significant refractive error even in some cases with good SNR. This suggests that appropriate discussion with patients on refractive target and post-operative spectacle use is necessary in every cataract case even as methods continue to improve.
Acknowledgment
This study was supported by an unrestricted grant from Research to Prevent Blindness Inc NYC to the University of Washington Department of Ophthalmology.
Disclosure
The authors report no conflicts of interest in this work.
References
Klein BE, Klein R, Lee KE. Incidence of age-related cataract over a 10-year interval: the Beaver Dam Eye Study. Ophthalmology. 2002;109(11):2052–2057. | ||
Congdon N, Vingerling JR, Klein BE, et al. Prevalence of cataract and pseudophakia/aphakia among adults in the United States. Arch Ophthalmol. 2004;122(4):487–494. | ||
Montés-Micó R, Carones F, Buttacchio A, Ferrer-Blasco T, Madrid-Costa D. Comparison of immersion ultrasound, partial coherence interferometry, and low coherence reflectometry for ocular biometry in cataract patients. J Refract Surg. 2011;27(9):665–671. | ||
Findl O, Drexler W, Menapace R, Heinzl H, Hitzenberger CK, Fercher AF. Improved prediction of intraocular lens power using partial coherence interferometry. J Cataract Refract Surg. 2001;27(6):861–867. | ||
Drexler W, Findl O, Menapace R, et al. Partial coherence interferometry: a novel approach to biometry in cataract surgery. Am J Ophthalmol. 1998;126(4):524–534. | ||
Kolega MŠ, Kovačević S, Čanović S, Pavičić AD, Bašić JK. Comparison of IOL – master and ultrasound biometry in preoperative intra ocular lens (IOL) power calculation. Coll Antropol. 2015;39(1):233–235. | ||
Hirnschall N, Murphy S, Pimenides D, Maurino V, Findl O. Assessment of a new averaging algorithm to increase the sensitivity of axial eye length measurement with optical biometry in eyes with dense cataract. J Cataract Refract Surg. 2011;37(1):45–49. | ||
Freeman G, Pesudovs K. The impact of cataract severity on measurement acquisition with the IOLMaster. Acta Ophthalmol Scand. 2005;83(4):439–442. | ||
Prinz A, Neumayer T, Buehl W, et al. Influence of severity of nuclear cataract on optical biometry. J Cataract Refract Surg. 2006;32(7):1161–1165. | ||
Olsen T, Thorwest M. Calibration of axial length measurements with the Zeiss IOLMaster. J Cataract Refract Surg. 2005;31(7):1345–1350. | ||
Rajan MS, Keilhorn I, Bell JA. Partial coherence laser interferometry vs conventional ultrasound biometry in intraocular lens power calculations. Eye. 2002;16(5):552–556. | ||
Velázquez-Estades LJ, Wanger A, Kellaway J, Hardten DR, Prager TC. Microbial contamination of immersion biometry ultrasound equipment. Ophthalmology. 2005;112(5):e13–e18. | ||
Verhulst E, Vrijghem JC. Accuracy of intraocular lens power calculations using the Zeiss IOL master. A prospective study. Bull Soc Belge Ophtalmol. 2001;281(281):61–65. | ||
Rose LT, Moshegov CN. Comparison of the Zeiss IOLMaster and applanation A-scan ultrasound: biometry for intraocular lens calculation. Clin Exp Ophthalmol. 2003;31(2):121–124. | ||
Bhatt AB, Schefler AC, Feuer WJ, Yoo SH, Murray TG. Comparison of predictions made by the intraocular lens master and ultrasound biometry. Arch Ophthalmol. 2008;126(7):929–933. | ||
Goebels SC, Seitz B, Langenbucher A. Comparison of the new biometer OA-1000 with IOLMaster and Tomey AL-3000. Curr Eye Res. 2013;38(9):910–916. | ||
Goebels SC, Seitz B, Langenbucher A. Reproducibility of the optical Biometer OA-1000 (Tomey). Biomed Res Int. 2014;2014:814761. | ||
Goebels S, Pattmöller M, Eppig T, Cayless A, Seitz B, Langenbucher A. Comparison of 3 biometry devices in cataract patients. J Cataract Refract Surg. 2015;41(11):2387–2393. | ||
Liampa Z, Kynigopoulos M, Pallas G, Gerding H. Comparison of two partial coherence interferometry devices for ocular biometry. Klin Monbl Augenheilkd. 2010;227(4):285–288. | ||
Lege BA, Haigis W. Laser interference biometry versus ultrasound biometry in certain clinical conditions. Graefes Arch Clin Exp Ophthalmol. 2004;242(1):8–12. | ||
Olsen T. Sources of error in intraocular lens power calculation. J Cataract Refract Surg. 1992;18(2):125–129. | ||
Farhoudi DB, Behndig A, Montan P, Lundström M, Zetterström C, Kugelberg M. Spectacle use after routine cataract surgery: a study from the Swedish National Cataract Register. Acta Ophthalmol. 2018;96(3):283–287. | ||
Srivannaboon S, Chirapapaisan C, Chonpimai P, Loket S. Clinical comparison of a new swept-source optical coherence tomography-based optical biometer and a time-domain optical coherence tomography-based optical biometer. J Cataract Refract Surg. 2015;41(10):2224–2232. | ||
Wiley WF, Bafna S. Intra-operative aberrometry guided cataract surgery. Int Ophthalmol Clin. 2011;51(2):119–129. |
 © 2018 The Author(s). This work is published and licensed by Dove Medical Press Limited. The
full terms of this license are available at https://www.dovepress.com/terms
and incorporate the Creative Commons Attribution
- Non Commercial (unported, 3.0) License.
By accessing the work you hereby accept the Terms. Non-commercial uses of the work are permitted
without any further permission from Dove Medical Press Limited, provided the work is properly
attributed. For permission for commercial use of this work, please see paragraphs 4.2 and 5 of our Terms.
© 2018 The Author(s). This work is published and licensed by Dove Medical Press Limited. The
full terms of this license are available at https://www.dovepress.com/terms
and incorporate the Creative Commons Attribution
- Non Commercial (unported, 3.0) License.
By accessing the work you hereby accept the Terms. Non-commercial uses of the work are permitted
without any further permission from Dove Medical Press Limited, provided the work is properly
attributed. For permission for commercial use of this work, please see paragraphs 4.2 and 5 of our Terms.