Back to Journals » Clinical Ophthalmology » Volume 15
Comparative Study of Lamina Cribrosa Thickness Between Primary Angle-Closure and Primary Open-Angle Glaucoma
Authors Wanichwecharungruang B ![]() , Kongthaworn A, Wagner D, Ruamviboonsuk P, Seresirikachorn K
, Kongthaworn A, Wagner D, Ruamviboonsuk P, Seresirikachorn K
Received 10 December 2020
Accepted for publication 21 January 2021
Published 18 February 2021 Volume 2021:15 Pages 697—705
DOI https://doi.org/10.2147/OPTH.S296115
Checked for plagiarism Yes
Review by Single anonymous peer review
Peer reviewer comments 2
Editor who approved publication: Dr Scott Fraser
Boonsong Wanichwecharungruang,1,2 Aungnapa Kongthaworn,1,3 Doreen Wagner,4 Paisan Ruamviboonsuk,1 Kasem Seresirikachorn1
1Department of Ophthalmology, Rajavithi Hospital, Rangsit Medical College, Bangkok, Thailand; 2Department of Ophthalmology, Priest Hospital, Bangkok, Thailand; 3Department of Ophthalmology, Nakorn-Nayok Hospital, Nakorn-nayok, Thailand; 4Senior Clinical Project Manager, Wuppertal, Germany
Correspondence: Boonsong Wanichwecharungruang
Rajavithi Hospital, 2, Rajavithi Road, Bangkok, 10400, Thailand
Tel +66 813135040
Email [email protected]
Purpose: To compare lamina cribrosa thickness (LCT) of primary angle-closure glaucoma (PACG) and primary open-angle glaucoma (POAG) using the enhanced depth-imaging mode of the Heidelberg Spectralis spectral-domain optical coherence tomography (EDI-OCT).
Patients and Methods: A comparative cross-sectional study was conducted. We enrolled 34 patients with PACG, 38 with POAG, and 62 controls, testing only one eye of each participant. Lamina cribrosa thickness was determined at the center of the optic nerve head using EDI-OCT. Nine points of LCT were measured, and LCT averages were analyzed.
Results: Mean age, number of glaucoma medications, current intraocular pressure (IOP), cup to disc ratio, and visual field indices, were not significantly different between PACG and POAG eyes. The maximum IOP (SD) was higher in PACG than in POAG, at 32.5 (10.46) vs 25.05 (6.42) mmHg (p = 0.001), and LCTs were significantly different among the PACG, POAG and control groups. Mean (SD) LCTs were 226.99 (31.08), 257.17 (19.46), and 290.75 (28.02) μm, respectively (p < 0.001). Lamina cribrosa thickness was correlated with mean deviation of the visual field (p = 0.001; correlation coefficient, rs = 0.347), while it was inversely correlated with maximum IOP (p < 0.001; correlation coefficient, rs = − 0.592). Linear regression analysis revealed that LCT was inversely related to age (p = 0.008), female (p = 0.018), and maximum IOP (p = 0.002). LCT was marginally related to visual field MD (p = 0.053).
Conclusion: Glaucomatous eyes had thinner LCT than controls, and maximum IOP was inversely correlated to the LCT. PACG eyes had higher maximum IOP and thinner LCT than POAG ones. In living eye, EDI-OCT emphasizes the pressure-dependent mechanism of glaucoma on lamina cribrosa deformation and the higher IOP-loaded stress which leads to a greater lamina cribrosa strain.
Keywords: lamina cribrosa thickness, primary angle-closure glaucoma, optical coherence tomography, Asian, intraocular pressure
Introduction
Lamina cribrosa assessment has recently become a field of interest, as it can be visualized in vivo with spectral-domain optical coherence tomography (SD-OCT).1,2 Spaide et al3 developed an Enhanced Depth Imaging (EDI) technique using SD-OCT (EDI-OCT) to visualize deeper retinal structures, such as the choroid and the lamina cribrosa. An EDI-OCT increases the visibility of the anterior and posterior lamina cribrosa surface in non-human primates compared to the conventional SD-OCT technique,4 and can therefore be used to measure lamina cribrosa thickness (LCT).
Primary angle-closure glaucoma (PACG) is one of the leading causes of blindness worldwide,5 and its prevalence is highest in Asia.6 A relatively small eye with a crowded anterior chamber leads to irido-trabecular apposition and IOP elevation. Optic nerve head and retinal nerve fiber layer (RNFL) changes in PACG have been studied using imaging technologies such as the Heidelberg retina tomograph (HRT),7,8 scanning laser polarimetry9 and OCT.10
Studies of lamina cribrosa in PACG are sparse. We conducted a comparative study of LCT in primary open-angle glaucoma (POAG) and primary PACG. This research explored thickness differences in lamina cribrosa and factors related to LCT in these two types of glaucoma.
Methods
A comparative cross-sectional study design was employed to investigate LCT in PACG and POAG patients and in healthy controls. The study was performed with the informed consent of the participants and followed all of the guidelines for experimental investigation using human subjects required by the Ethics Committee (EC) of Rajavithi Hospital. All investigations were carried out in accordance with the Declaration of Helsinki. The study protocol was approved by EC in December 2012. All participants were recruited from the Department of Ophthalmology, Rajavithi Hospital, between January and October 2013.
Participants were ≥50 years of age with a best-corrected visual acuity of ≥20/63. POAG was defined as the presence of glaucomatous optic disc (diffuse or focal thinning of the neuro-retinal rim) and an abnormal visual field consistent with glaucoma. IOP was >21 mmHg and showed an open angle when applying gonioscopy. PACG was defined as an eye that had at least 180 degrees of iridotrabecular contact or peripheral anterior synechiae (PAS) with elevated IOP, with glaucomatous optic disc and/or visual field defect. Acute PACG (APACG) was defined as PACG eye that had eye pain, halo, nausea/vomiting, corneal edema, and IOP > 21 mmHg. Patients who had the previous history of APACG were also eligible only when the optical media was clear for OCT scanning. Maximum IOP was defined as the highest IOP-recorded from our hospital database or from referral document. The control group consisted of those having an IOP of between 10 and 21 mmHg with no history of increased IOP, normal anterior chamber angle, an absence of glaucomatous disc appearance, and no visible retinal nerve fiber layer (RNFL) defect. Eyes after cataract surgery or peripheral iridotomy were eligible.
Exclusion criteria were intraocular or neurologic diseases that cause visual field loss. Cases of unreliable visual field (false negative ≥25%; false positive ≥25%; fixation losses ≥20%) and poor quality of EDI-OCT scanning (<20) were excluded. Glaucoma patients that had undergone glaucoma surgery (eg, filtering surgery, goniosynechialysis, trabeculotomy, goniotomy) were also excluded.
Ophthalmologic assessment included best-corrected visual acuity, slit-lamp biomicroscopy, Goldmann applanation tonometry, gonioscopy, axial length (IOL Master, Carl Zeiss-Meditec, Dublin, CA), central corneal thickness (CCT, Corneo-Gage Plus, Sonogage Inc., Cleveland, OH), dilated stereoscopic examination of the ONH and fundus, color disc photography, and standard automated perimetry using the 24–2 Swedish Interactive Threshold Algorithm standard program (Humphrey Visual Field Analyzer, Carl Zeiss-Meditec, Dublin, CA). An EDI-OCT using Heidelberg Spectralis OCT (Heidelberg Engineering, Heidelberg, Germany) was performed, and only one eye of each participant was analyzed.
Enhanced Depth-Imaging Spectral-Domain Optical Coherence Tomography of the Optic Nerve Head and Lamina Cribrosa Thickness Measurement
OCT B-scans of the ONH were obtained using an EDI-OCT of Heidelberg Spectralis OCT, with a 20-degree retinal window. The center of ONH was identified using a horizontal cross-sectional B-scan. The EDI mode enhanced the visualization of lamina cribrosa beneath the optic disc cup. We defined LCT as the distance between the anterior and posterior borders of the high reflective region. The image was enlarged to 1:1 pixels with the Spectralis OCT program to line up the lamina cribrosa borders. Each anterior and posterior border, which was not in a straight line, was marked with 9 points. LCT was measured by one of us (A.K.), using horizontal cross-sectional B-scan for 9 points (equally distanced) at the central plane of ONH (Figure 1). Intra-observer and inter-observer reproducibility of LCT measurements were tested in 20 cases, revealing kappa of 0.77 and 0.74, respectively. An analysis of the average LCT was performed, and Bruch’s membrane openings (BMO) were marked and measured at the horizontal scan of the lamina cribosa.
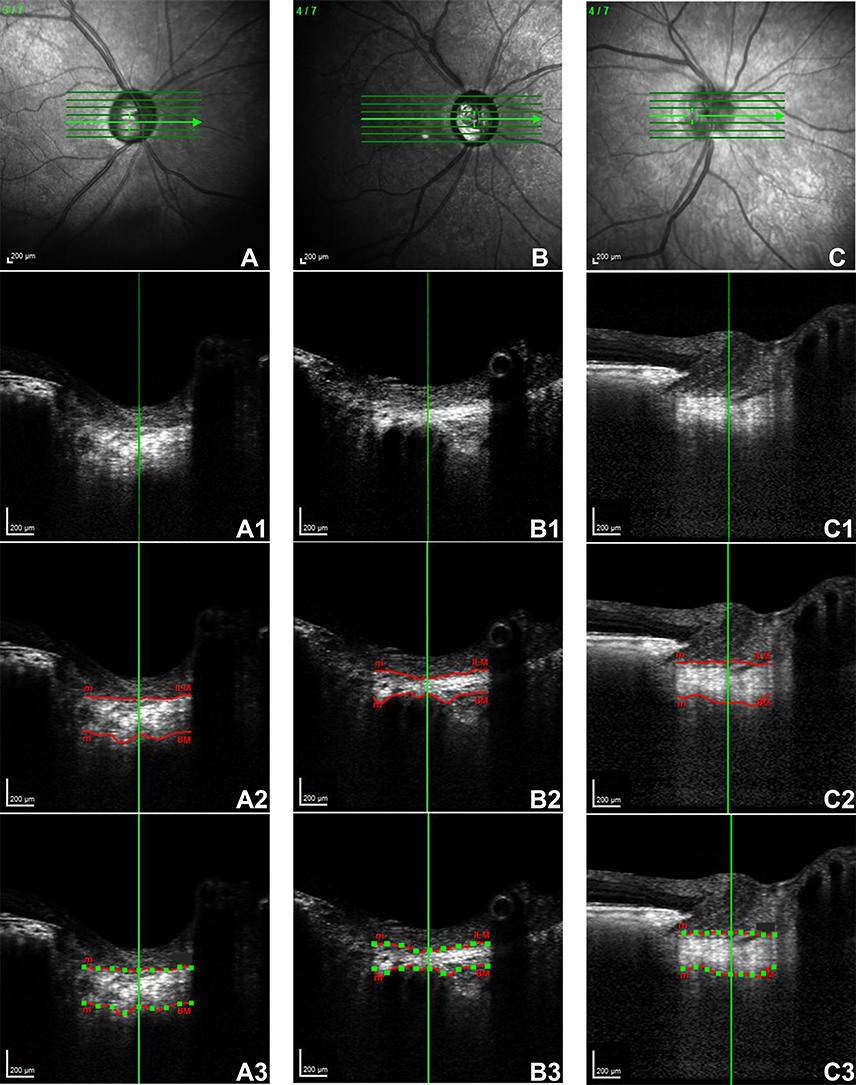 |
Figure 1 Lamina cribrosa thicknesses of different groups imaged by EDI mode of Heidelberg Spectralis SD-OCT using the horizontal cross-sectional B-scan, which ran through the center of the ONH. Notes: Anterior and posterior borders of the lamina cribrosa were determined (red line). Nine points (green dots) of each laminar thickness were measured to calculate the average. (A) The lamina cribrosa of a 78-year-old man with POAG in his right eye. (B) The lamina cribrosa of an 82-year-old woman with PACG in her right eye. (C) The lamina cribrosa of a 67-year-old woman with no glaucoma in her right eye. |
Statistical Analysis
Statistical analysis was performed with SPSS software (version 16.0.0; SPSS Inc., Chicago, IL). Normal distribution was detected using Shapiro–Wilk test. A test of variance for normal distributed data was achieved with Levene’s test, and independent Student t-tests and one-way ANOVA with Bonferonni correction were used to compare the data between and among the groups for normally distributed data. Kruskal–Wallis and Mann–Whitney-U test were applied to compare the data between and among the groups for abnormally distributed data, and the level of statistical significance was set at p < 0.05. The relationships between LCT and the characteristic factors including IOP and visual field indices were applied using Spearman correlations and linear regression analysis.
Results
Subject Baseline Characteristics
Spectralis OCT with EDI techniques were obtained for 64 controls and 77 patients with glaucoma. We excluded seven patients from this study because of poor EDI-OCT scanning quality, which the lamina borders could not be visualized clearly. A total of 62 controls and 72 glaucoma (38 POAG, and 34 PACG) were analyzed. Baseline characteristics are summarized in Table 1. Mean age was not different among the three groups (p = 0.859), nor between the POAG and PACG groups (p = 0.755). The percentages of females in the control, POAG, and PACG groups were 72.58%, 50% and 67.65%, respectively. The current IOP, maximum IOP, vertical cup-to-disc ratio (C/D), BMO, axial length, CCT, mean deviation (MD), and pattern standard deviation (PSD) of the visual field were significantly different between glaucoma and controls (p ≤ 0.016) while the number of medications, current IOP, C/D, MD, and PSD were not different between POAG and PACG groups (p = 0.525, p = 0.141, p = 0.510, p = 0.854, p = 0.378, respectively, Mann–Whitney-U test). The maximum IOP differed significantly between POAG and PACG eyes, at 25.05 ± 6.42 mmHg vs 32.50 ± 10.46 mmHg (p = 0.001). POAG had significantly longer axial length than PACG (23.73 ± 1.02 vs 22.89 ± 0.81 mm, p < 0.001), and also a thinner CCT (524.32 ± 35.31 vs 540.33 ± 28.72 μm, p = 0.015). Bruch’s membrane opening in controls was smaller than in glaucoma but was not different between the glaucoma groups.
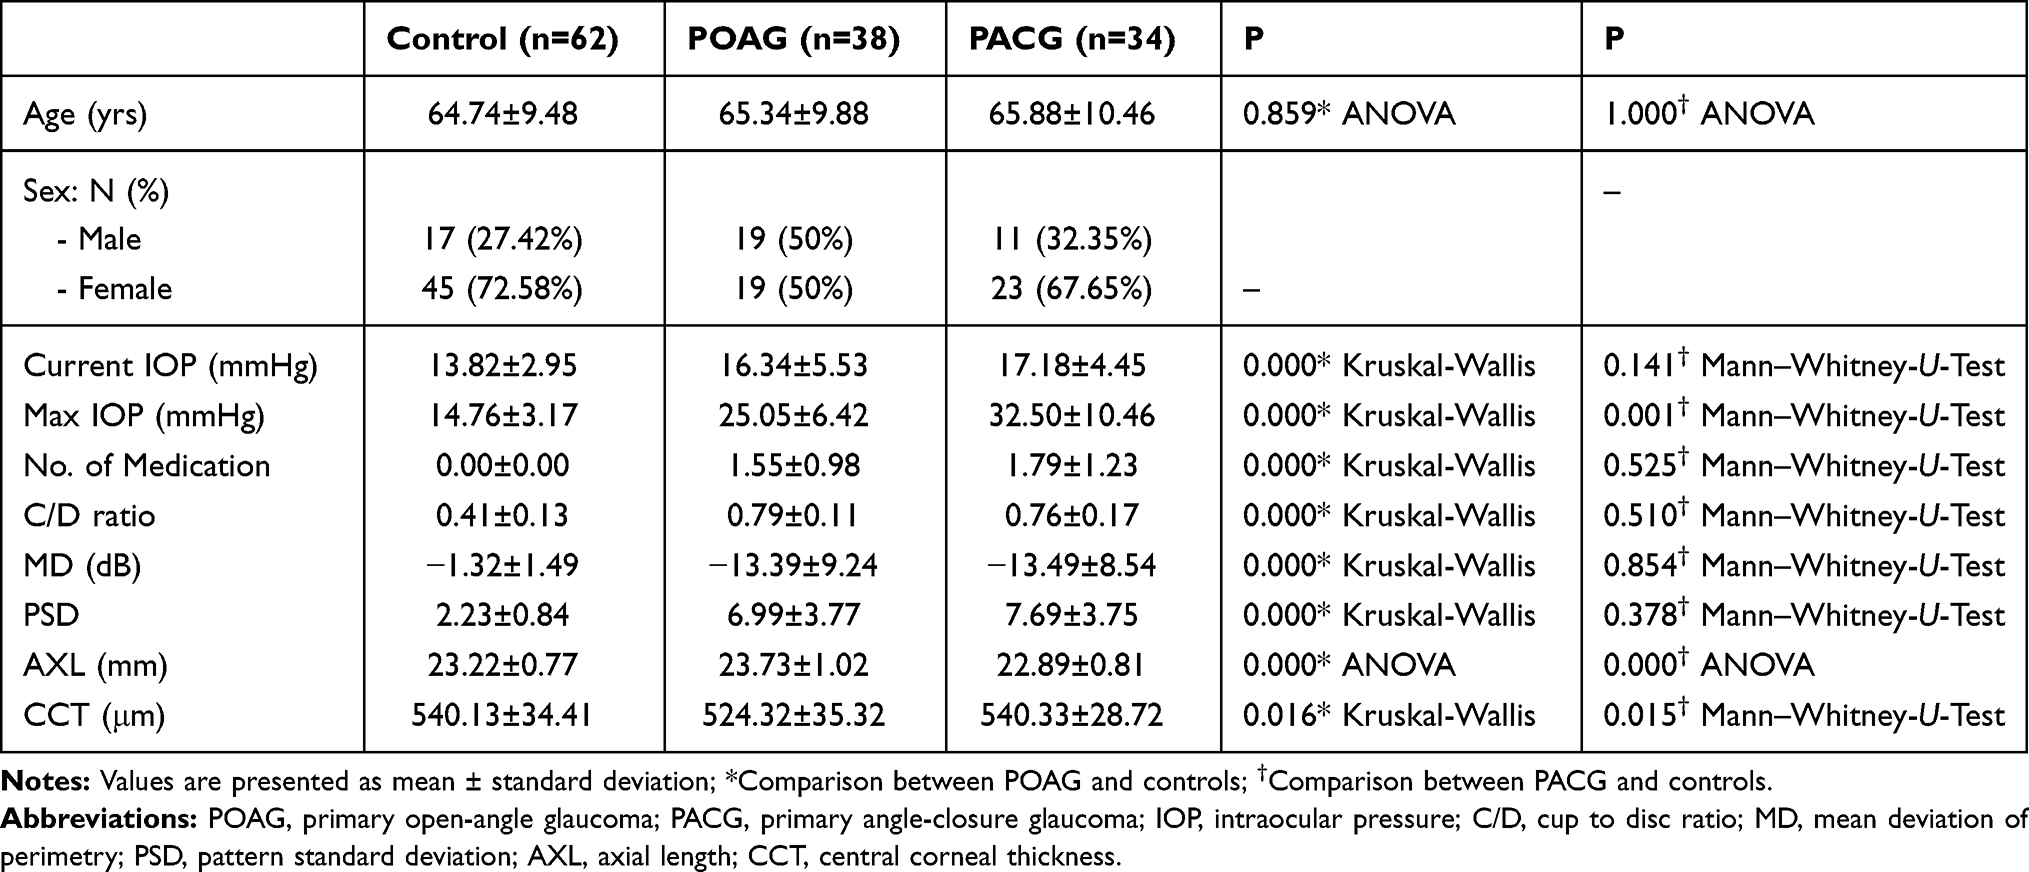 |
Table 1 Patient Characteristics of Each Group |
Comparison of Lamina Cribrosa Thickness Among Groups
Mean LCT in controls, POAG, and PACG was 290 ± 28.02 μm, 257.17 ± 19.46 μm and 226.99 ± 31.08 μm, respectively. There was a significant difference among the three groups (p < 0.001) as shown in Table 2. Mean LCT of POAG was significantly thicker than that of PACG (p < 0.001).
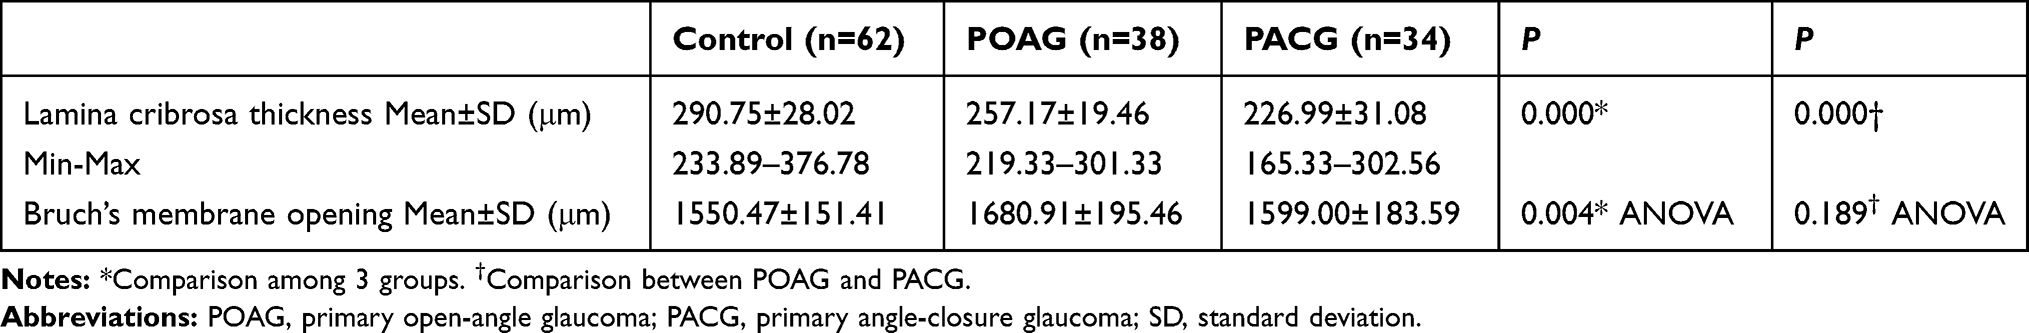 |
Table 2 Lamina Cribrosa Thickness and Bruch’s Membrane Opening Measurement, Obtained with EDI-OCT |
Relationship Between Lamina Cribrosa Thickness and Intraocular Pressure
The relationship between the LCT and the maximum IOP was evaluated using Spearman correlation analysis. The LCT and the maximum IOP were significantly different between the POAG and PACG eyes (Tables 1 and 2), and mean LCT revealed a negative correlation with the maximum IOP (p < 0.001; correlation coefficient, rs = −0.592; Figure 2).
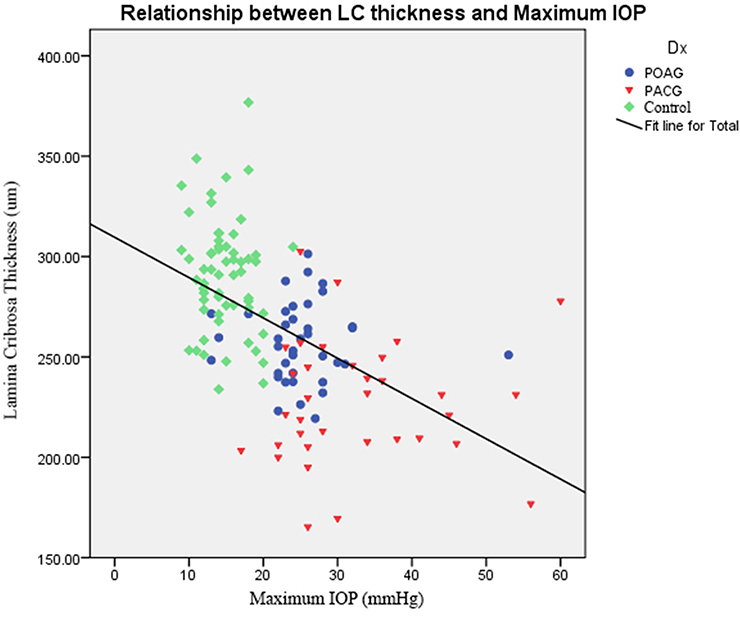 |
Figure 2 Relationship of lamina cribrosa thickness and maximum IOP using Spearman correlation analysis. Note: The correlation was statistically significant (p = 0.000; correlation coefficient, rs = −0.592). |
Relationship Between Lamina Cribrosa Thickness and Visual Field Mean Deviation
POAG and PACG eyes had a similar visual field MD (−13.39 ± 9.24 vs −13.49 ± 8.54 dB) while Spearman analysis revealed a positive correlation between LCT and MD (p = 0.001; correlation coefficient, rs = 0.347; Figure 3).
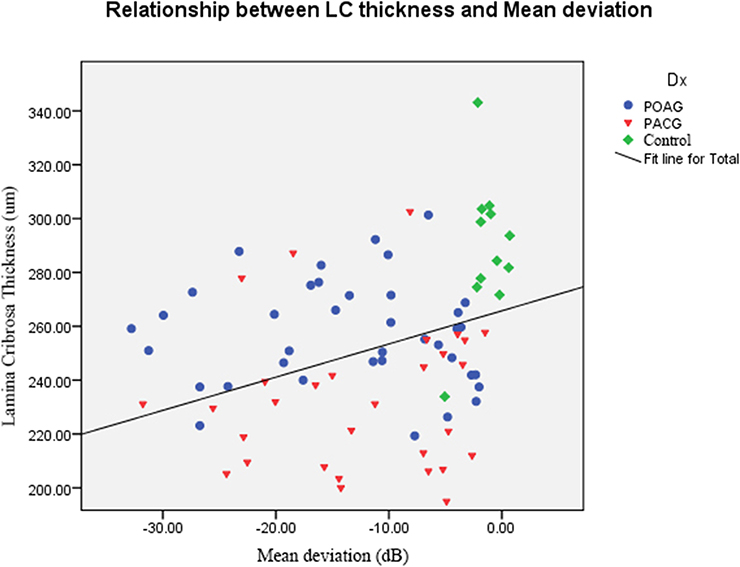 |
Figure 3 Relationship of lamina cribrosa thickness and mean deviation of the visual field using Spearman correlation analysis. Note: p = 0.001; correlation coefficient, rs = 0.347. |
Relationship Between Lamina Cribrosa Thickness, Bruch Membrane Opening, and Axial Length
Spearman analysis showed no correlation between LCT and BMO, (p = 0.803, rs = −0.023), LCT and AL (p = 0.713, rs = 0.32).
Linear regression analysis revealed that LCT was inversely related to age (p = 0.008), female (p = 0.018), and maximum IOP (p = 0.002). LCT was marginal related to visual field MD (p = 0.053).
Discussion
In the present study, EDI-OCT showed that lamina cribrosa in glaucomatous eyes was thinner than in controls. This is a posterior portion of the sclera at the optic nerve head (ONH), composed of connective tissues and elastic fibers,11 which provides the main support for the optic nerve axons when exiting the eye. The lamina cribrosa helps to maintain the pressure gradient among IOP, cerebrospinal pressure, and the surrounding tissue.12 Structural changes in the lamina cribrosa have been thought to cause early damage when glaucomatous optic neuropathy is diagnosed.11,13 Increased IOP can cause posterior displacement of the lamina,14 leading to optic nerve axon damage. Clinically, an enlarged ONH cup is a typical sign of lamina change. In addition, axoplasmic blockage by lamina distortion can cause retinal ganglion cell damage and ONH changes.
Lamina cribrosa structures have been studied in animal15 or enucleated eyes.12,14,16 Histomorphometric investigations reveal that the lamina thickness is significantly lower in eyes with advanced glaucomatous optic nerve damage than in non-glaucomatous eyes. EDI-OCT can be applied for evaluation of the LCT in living eyes and for monitoring LCT in follow-up periods.
In the present study, both groups had advanced-stage glaucoma, with an MD of −13 dB. LCT had an inverse correlation with maximum IOP, which was higher in PACG than in POAG (32 mmHg vs 25 mmHg). PACG eyes had higher IOP stress on lamina cribrosa than POAG, leading to a more severe strain of lamina deformation and thinner LCT.17
Intraocular pressure is an important risk factor for glaucoma damage and progression.18–21 In an experiment with ex vivo porcine eyes using SD-OCT, Fatehee et al22 reported that LCT decreased after acute IOP elevation, and the higher the IOP, the thinner was the lamina thickness. In our study, some cases of PACG had a history of a previous acute attack. The peak IOP destroyed the connective tissue around the ONH, and the lamina cribrosa subsequently thinned. The dose-response of IOP and glaucomatous damage is commonly presented in clinical studies. Gazzard et al23 reported a relationship between IOP and visual field loss in PACG and POAG. They found that pre-treated IOP was higher in PACG patients than in POAG patients, and that visual field defect was also worse in PACG. De Moraes et al24 found that the peak IOP, rather than the fluctuation of IOP and mean IOP, was the strongest risk factor for visual field damage progression in treated glaucoma patients. A specific threshold for IOP elevation may have to be reached to lead to lamina cribrosa deformation and/or lamina backward movement.
In addition, linear regression analysis showed that LCT was inversely related to female and age. In histologic study, female appears to have thinner LC than male.25 In glaucoma situation, IOP can possibly further damage LC and make it even thinner. Xiao et al reported that lamina thickness in healthy Chinese subjects, aged >60 years old, are thicker than in younger age groups.26 However, in our study, older age had thinner lamina cribosa. The reason for this result remained unclear. We speculated that the thickness of lamina cribosa might not indicate its rigidity. When the IOP is elevated, a thicker lamina beam might be more susceptible to be compressed, leading to thinner lamina cribosa. Future research on the relationship between lamina thickness and rigidity is required to elucidate this issue.
Hao et al reported different outcomes of LCT from those of our study. Chronic PACG (CPACG) patients had thicker LCT than those with POAG.27 These patients with CPACG had no history of acute attack previously. Both glaucoma groups had the same IOP level, at about 19 mmHg, and their visual field mean deviations were not significantly different (−10.5 vs 13 dB). The discrepancy in the results of these two studies may relate to IOP levels; we included patients with a history of acute attack, and their maximum IOP was higher than in the research by Hao et al Their study debated whether optic disc size in CPACG might be smaller than in POAG, but they did not measure the BMO. Our study showed no difference in BMO between PACG and POAG eyes.
Korean POAG patients were found to have thinner lamina than Thai POAG counterparts, while the mean severity of visual field damage in Thai patients was more advanced (−13.39 dB in Thai vs −6.58 dB in Korean).28 These differences might relate to differences in ethnicity, but different techniques were used to measure the LCT. The Korean study measured 3 points of the laminae,16 while we examined 9. They reported that LCT in normal-tension glaucoma (NTG) was thinner than in POAG.28 Their findings conflict with our observation that LCT was inversely correlated with IOP; however, NTG may have another pathophysiology, rather than IOP.29 We speculated that pre-existing thin lamina cribrosa might be susceptible to such low IOP in NTG, and a prospective study of LCT and glaucoma incidence should be conducted to elucidate this issue.
Among Asian controls, LCTs were different. The LCTs of Koreans, Thais, and Chinese were 348, 290, and 202 μm, respectively. These differences could be related to the measurement techniques; as yet, there is no standard protocol for LCT measurement. We found that the LCT, determined by EDI-OCT, was not a uniform structure; in particular, the posterior border had an irregular pattern (Figure 1). We measured the lamina at 9 points at equal distances from border to border at the central plane of the ONH, but we could not measure the entire lamina cribrosa due partly to the shadows of blood vessels. However, enhancing the contrast of SD-OCT images improved the visibility of the posterior lamina boundary. This method is similar to that used in the study by Jonas et al,30 which measured the thickness in the center of the optic disc, at the optic disc borders, and in the intermediary positions between the center and borders of the ONH. These different techniques demonstrate that LCT measurement is still inconsistent; therefore, automated software as used in choroidal thickness measurement31 to identify the anterior and posterior border of lamina cribrosa and for the lamina thickness measurement would be useful in decreasing intra- and inter-observer errors when using different techniques.
Bruch’s membrane opening, indicating the optic disc margin of the ONH, was larger in the glaucoma groups than in controls. This finding might be the cause and/or effect of IOP-related stress and strain on the lamina cribrosa and the scleral canal wall. Pre-existing large ONH, eg, in African-descent optic disc, is predisposed to glaucomatous damage.32 Large ONH, for instance in myopia, may be associated with low scleral rigidity and might be susceptible to IOP.33 On the other hand, IOP-related stress could distend lamina cribrosa and peripapillary sclera, having an effect on scleral canal wall expansion.17 The BMO would be displaced laterally. In this study, however, the BMO in POAG was not significantly different from that of PACG, and there was no correlation between IOP, LCT and BMO.
Limitations of the present study included the recruitment of patients from a referral tertiary eye care in a cross-sectional manner, so that most of the glaucomatous eyes were at an advanced stage, and we could not speculate about the trend of pre-glaucomatous thickness of lamina cribrosa in POAG and PACG eyes. The maximum IOP data of the individuals were collected from hospital records or referral letters and may not have been correct. Our small sample size might be a source of bias, and we were unable to enroll matched IOP of POAG and PACG patients.
In conclusion, this study supports the use of SD-OCT with EDI mode for detecting lamina cribrosa change. The LCT was significantly thinner in the glaucoma (POAG and PACG) group compared to control eyes, and we found that maximum IOP was inversely correlated to LCT, and PACG had a higher maximum IOP and thinner LCT than POAG. The pressure-dependent mechanism deformed the lamina cribrosa in which the higher IOP-loaded stress led to a greater lamina cribrosa strain.
Acknowledgments
The authors would like to thank Kittipong Kongsomboon, MD, MBA, PhD, Department of Preventive and Social Medicine, Faculty of Medicine, Srinakharinwirot University, Thailand for statistical advices, and John Flanagan M.A., a native speaker of English, for proof-reading this manuscript.
Funding
Supported by Rajavithi Research Grant 2556.
Disclosure
This paper was presented as a poster at the annual meeting of the Association for Research in Vision and Ophthalmology, Orlando, Florida, May 2014, with interim findings. The poster’s abstract was published in https://iovs.arvojournals.org/article.aspx?articleid=2269743. The authors report no conflicts of interest in this work.
References
1. Lee EJ, Kim TW, Weinreb RN, Park KH, Kim SH, Kim DM. Visualization of the lamina cribrosa using enhanced depth imaging spectral-domain optical coherence tomography. Am J Ophthalmol. 2011;152(1):87–95 e1. doi:10.1016/j.ajo.2011.01.024
2. Kim TW, Kagemann L, Girard MJ, et al. Imaging of the lamina cribrosa in glaucoma: perspectives of pathogenesis and clinical applications. Curr Eye Res. 2013;38(9):903–909. doi:10.3109/02713683.2013.800888
3. Spaide RF, Koizumi H, Pozzoni MC. Enhanced depth imaging spectral-domain optical coherence tomography. Am J Ophthalmol. 2008;146(4):496–500. doi:10.1016/j.ajo.2008.05.032
4. Yang H, Qi J, Hardin C, et al. Spectral-domain optical coherence tomography enhanced depth imaging of the normal and glaucomatous nonhuman primate optic nerve head. Invest Ophthalmol Vis Sci. 2012;53(1):394–405. doi:10.1167/iovs.11-8244
5. Quigley HA, Broman AT. The number of people with glaucoma worldwide in 2010 and 2020. Br J Ophthalmol. 2006;90(3):262–267. doi:10.1136/bjo.2005.081224
6. Tham YC, Li X, Wong TY, Quigley HA, Aung T, Cheng CY. Global prevalence of glaucoma and projections of glaucoma burden through 2040: a systematic review and meta-analysis. Ophthalmology. 2014;121(11):2081–2090. doi:10.1016/j.ophtha.2014.05.013
7. Uchida H, Yamamoto T, Tomita G, Kitazawa Y. Peripapillary atrophy in primary angle-closure glaucoma: a comparative study with primary open-angle glaucoma. Am J Ophthalmol. 1999;127(2):121–128. doi:10.1016/S0002-9394(98)00318-3
8. Nouri-Mahdavi K, Supawavej C, Bitrian E, et al. Patterns of damage in chronic angle-closure glaucoma compared to primary open-angle glaucoma. Am J Ophthalmol. 2011;152(1):74–80 e2. doi:10.1016/j.ajo.2011.01.008
9. Aung T, Husain R, Gazzard G, et al. Changes in retinal nerve fiber layer thickness after acute primary angle closure. Ophthalmology. 2004;111(8):1475–1479. doi:10.1016/j.ophtha.2003.12.055
10. Manassakorn A, Aupapong S. Retinal nerve fiber layer defect patterns in primary angle-closure and open-angle glaucoma: a comparison using optical coherence tomography. Jpn J Ophthalmol. 2011;55(1):28–34. doi:10.1007/s10384-010-0898-6
11. Quigley HA, Green WR. The histology of human glaucoma cupping and optic nerve damage: clinicopathologic correlation in 21 eyes. Ophthalmology. 1979;86(10):1803–1830. doi:10.1016/S0161-6420(79)35338-6
12. Jonas JB, Berenshtein E, Holbach L. Anatomic relationship between lamina cribrosa, intraocular space, and cerebrospinal fluid space. Invest Ophthalmol Vis Sci. 2003;44(12):5189–5195. doi:10.1167/iovs.03-0174
13. Quigley HA, Addicks EM, Green WR, Maumenee AE. Optic nerve damage in human glaucoma. II. The site of injury and susceptibility to damage. Arch Ophthalmol. 1981;99(4):635–649. doi:10.1001/archopht.1981.03930010635009
14. Yan DB, Coloma FM, Metheetrairut A, Trope GE, Heathcote JG, Ethier CR. Deformation of the lamina cribrosa by elevated intraocular pressure. Br J Ophthalmol. 1994;78(8):643–648. doi:10.1136/bjo.78.8.643
15. Jonas JB, Hayreh SS, Yong T. Thickness of the lamina cribrosa and peripapillary sclera in Rhesus monkeys with nonglaucomatous or glaucomatous optic neuropathy. Acta Ophthalmol. 2011;89(5):e423–7. doi:10.1111/j.1755-3768.2011.02121.x
16. Ren R, Wang N, Li B, et al. Lamina cribrosa and peripapillary sclera histomorphometry in normal and advanced glaucomatous Chinese eyes with various axial length. Invest Ophthalmol Vis Sci. 2009;50(5):2175–2184. doi:10.1167/iovs.07-1429
17. Burgoyne CF. Optic nerve: the glaucomatous optic nerve. In: Joann A, Giaconi SKL, Coleman AL, Caprioli J, editors. Pearls of Glaucoma Management. Vols. 1–13. Springer; 2010:chap 1.
18. Shields MB, Spaeth GL. The glaucomatous process and the evolving definition of glaucoma. J Glaucoma. 2012;21(3):141–143. doi:10.1097/IJG.0b013e31820719f6
19. Heijl A, Leske MC, Bengtsson B, Hyman L, Hussein M. Reduction of intraocular pressure and glaucoma progression: results from the early manifest glaucoma trial. Arch Ophthalmol. 2002;120(10):1268–1279. doi:10.1001/archopht.120.10.1268
20. Leske MC, Heijl A, Hussein M, et al. Factors for glaucoma progression and the effect of treatment: the early manifest glaucoma trial. Arch Ophthalmol. 2003;121(1):48–56. doi:10.1001/archopht.121.1.48
21. The Advanced Glaucoma Intervention Study (AGIS): 7. The relationship between control of intraocular pressure and visual field deterioration. The AGIS investigators. Am J Ophthalmol. 2000;130(4):429–440. doi:10.1016/S0002-9394(00)00538-9
22. Fatehee N, Yu PK, Morgan WH, Cringle SJ, Yu DY. The impact of acutely elevated intraocular pressure on the porcine optic nerve head. Invest Ophthalmol Vis Sci. 2011;52(9):6192–6198. doi:10.1167/iovs.10-7137
23. Gazzard G, Foster PJ, Devereux JG, et al. Intraocular pressure and visual field loss in primary angle closure and primary open angle glaucomas. Br J Ophthalmol. 2003;87(6):720–725. doi:10.1136/bjo.87.6.720
24. De Moraes CG, Juthani VJ, Liebmann JM, et al. Risk factors for visual field progression in treated glaucoma. Arch Ophthalmol. 2011;129(5):562–568. doi:10.1001/archophthalmol.2011.72
25. Kotecha A, Izadi S, Jeffery G. Age-related changes in the thickness of the human lamina cribrosa. Br J Ophthalmol. 2006;90(12):1531–1534. doi:10.1136/bjo.2006.100388
26. Xiao H, Xu XY, Zhong YM, Liu X. Age related changes of the central lamina cribrosa thickness, depth and prelaminar tissue in healthy Chinese subjects. Int J Ophthalmol. 2018;11(11):1842–1847. doi:10.18240/ijo.2018.11.17
27. Hao L, Xiao H, Gao X, Xu X, Liu X. Measurement of structural parameters of the lamina cribrosa in primary open-angle glaucoma and chronic primary angle-closure glaucoma by optical coherence tomography and its correlations with ocular parameters. Ophthalmic Res. 2019;62(1):36–45. doi:10.1159/000496558
28. Park HY, Jeon SH, Park CK. Enhanced depth imaging detects lamina cribrosa thickness differences in normal tension glaucoma and primary open-angle glaucoma. Ophthalmology. 2012;119(1):10–20. doi:10.1016/j.ophtha.2011.07.033
29. Flammer J, Haefliger IO, Org¸l S, Resink T. Vascular dysregulation: a principal risk factor for glaucomatous damage? J Glaucoma. 1999;8(3):212–219. doi:10.1097/00061198-199906000-00012
30. Jonas JB, Holbach L. Central corneal thickness and thickness of the lamina cribrosa in human eyes. Invest Ophthalmol Vis Sci. 2005;46(4):1275–1279. doi:10.1167/iovs.04-0851
31. Lee S, Fallah N, Forooghian F, et al. Comparative analysis of repeatability of manual and automated choroidal thickness measurements in nonneovascular age-related macular degeneration. Invest Ophthalmol Vis Sci. 2013;54(4):2864–2871. doi:10.1167/iovs.12-11521
32. Chi T, Ritch R, Stickler D, Pitman B, Tsai CS, Hsieh FY. Racial differences in optic nerve head parameters. Arch Ophthalmol. 1989;107:836–839. doi:10.1001/archopht.1989.01070010858029
33. Jonas JB, Budde WM, Panda-Jonas S. Ophthalmoscopic evaluation of the optic nerve head. Surv Ophthalmol. 1999;43:293–320.
 © 2021 The Author(s). This work is published and licensed by Dove Medical Press Limited. The
full terms of this license are available at https://www.dovepress.com/terms
and incorporate the Creative Commons Attribution
- Non Commercial (unported, 3.0) License.
By accessing the work you hereby accept the Terms. Non-commercial uses of the work are permitted
without any further permission from Dove Medical Press Limited, provided the work is properly
attributed. For permission for commercial use of this work, please see paragraphs 4.2 and 5 of our Terms.
© 2021 The Author(s). This work is published and licensed by Dove Medical Press Limited. The
full terms of this license are available at https://www.dovepress.com/terms
and incorporate the Creative Commons Attribution
- Non Commercial (unported, 3.0) License.
By accessing the work you hereby accept the Terms. Non-commercial uses of the work are permitted
without any further permission from Dove Medical Press Limited, provided the work is properly
attributed. For permission for commercial use of this work, please see paragraphs 4.2 and 5 of our Terms.