Back to Journals » Medical Devices: Evidence and Research » Volume 12
Comparative Analysis of Color Matching System for Teeth Recognition Using Color Moment
Authors Justiawan, Wahjuningrum DA ![]() , Hadi RP, Nurhayati AP
, Hadi RP, Nurhayati AP ![]() , Prayogo K, Sigit R, Arief Z
, Prayogo K, Sigit R, Arief Z
Received 17 September 2019
Accepted for publication 22 November 2019
Published 30 December 2019 Volume 2019:12 Pages 497—504
DOI https://doi.org/10.2147/MDER.S224280
Checked for plagiarism Yes
Review by Single anonymous peer review
Peer reviewer comments 2
Editor who approved publication: Dr Scott Fraser
Video abstract of 'Color matching system for teeth recognition using color moment' [ID 224280].
Views: 634
Justiawan,1 Dian Agustin Wahjuningrum,2 Ratna Puspita Hadi,2 Adienda Pajar Nurhayati,2 Kevin Prayogo,2 Riyanto Sigit,3 Zainal Arief4
1Department of Research and Development, Tione Indonesia Jaya, Surabaya 60111, Indonesia; 2Department of Conservative Dentistry, Faculty of Dental Medicine, Universitas Airlangga, Surabaya 60131, Indonesia; 3Department of Informatic Engineering, Magister Program of Engineering Technology, Electronic Engineering Polytechnic Institute of Surabaya, Surabaya, Indonesia; 4Department of Electrical Engineering, Magister Program of Engineering Technology, Electronic Engineering Polytechnic Institute of Surabaya, Surabaya, Indonesia
Correspondence: Dian Agustin Wahjuningrum
Department of Conservative Dentistry, Faculty of Dental Medicine, Universitas Airlangga, Mayjen Prof. Dr. Moestopo 47, Surabaya, East Java 60131, Indonesia
Tel +62 315030252
Fax +62 315022472
Email [email protected]
Background: In recent years, veritable image processing systems have been developed for several field applications, some of which are recognition and classification. One such application is in the medical field for teeth color matching systems. The color matching technique is a feasible solution for classifying patients’ teeth images to evaluate the suitable treatment of tooth replacement in dentistry. However the lighting conditions of the environment and visual teeth color deficiency will be influenced or affected by the color matching performance.
Methods: This paper proposes the comparative analysis of a color matching system, using K-nearest neighbors (KNN), neural network (NN), and decision tree (DT) algorithms to classify and recognize 16 types of dental images of persons that used several extracted features, from shade guide of teeth, with a digital camera, ranging from 250–300 lux lighting value. The extracted features are produced from RGB, HSV, and Lab color moment characteristic calculation of tooth samples. Those features were compared with input images using euclidean distance value.
Results: KNN algorithm in RGB characteristic achieves 97.5% within only a 0.02 second computation time.
Conclusion: KNN algorithm in RGB characteristic provides the best performance when compared to the other approaches.
Keywords: KNN algorithm, teeth recognition, color matching, color moment
Introduction
One major branch of medical sciences where an application field of color matching is being practiced is dentistry. For example, the damaged teeth of a patient might require some treatments such as filling or replacing the teeth with dentures. One of the important processes is the determination of the teeth color. Unmatching color will result in unsuccessful treatment. In fact, almost the same color of tooth, the lighting environment and also visual color teeth deficiency can be misleading, influencing the dentist to determine the specific type of teeth color requirement at dental treatment. The situation is confusing to the dentist, creating an uncertainty in their classification decision. Although a number of shade guide matching systems are available for clinical use, the color space from the available dental shade guides are limited. This proves that the shade guide does not represent the full spectrum of the natural patient’s teeth.1 Variations from individual perception of each color appeared due to the visual color selection, depending on shape, size, position, surrounding illumination, and background color. Although the instrument-based shade matching technique represents a step towards an objective and accurate color reproduction, it can be influenced by the skin color, the environment lighting, and lips color.2 Determination of tooth color becomes subjective and qualitative.
One of the techniques, which has been developed for increasing the performance of the color matching system, is shade-matching technologies in clinical dentistry.3 Shade-matching technologies help in determining and recognizing tooth color, reflecting objectivity and quantitatively instead of a misleading subjectivity and qualitatively. Classification of images is a set of technique or method, used to identify images according to their content.4 One application field of image processing is a medical field that is required in a high accuracy level system. An instrument of the color-measuring system with computerized color analysis allows more standardized and accurate color matching than conventional techniques.
Basically, the teeth color is composed from a white color with several different values. While the color white indicates a perfect light, which represents an end of a spectrum, human color perception is determined by the brightness, hue, and saturation. However, this condition is not appropriate due to the modification of wavelength, intensity and the amount of white light, which can be influenced by the brightness, hue, and saturation of color. The color identity is specified by the wavelength of the light. The color wavelength range, which can be captured with human eyes, is at 380–780 nanometers. The combination from three basic elements of colors can produce color space parameters such as RGB, CMY, HSV, CIE XYZ, Lab, Luv, and YCrCb. The color space of RGB is determined, using three basic component colors, which are red (R), green (G), and blue (B), which is formed by electrical sensor frequency acquisition. RGB color spaces is widely applied at graphical computer system. The further development of color space is CMY, known as the cyan, magenta, and yellow component. CMY is substractive color spaces that is applied in many printer devices. It is different from HSV, CIE XYZ, Luv, and YCrCb color space that is focused on non-linear transformation based on RGB as the basic color space. Recording, transmission, and displaying system televisionused LUV and YCrCb color space. The main concept of LUV and YCrCb is separating its luminant element from UV and CbCr. Then HSV, CIE XYZ, and Lab are color spaces that can represent elements based on human eyesight. Due to this color matching system, it is applicable to computer visualization and is always influenced by human eyesight perception, especially the dentist’s; this system used RGB, HSV, and LAB color spaces.10 In addition to its basic element of colors, RGB, HSV, and Lab are the most widely used parameters of the image processing system. This is as a result of its simplified calculation, which can determine the characteristics model of the image, based on its color.
Many algorithms for image classification are proposed under certain assumptions and constraints dependent on the color elements. Most color image detection methods can be categorized into four major classes, which are: knowledge-based methods, feature invariant approaches, template matching methods, and appearance-based methods. Knowledge-based methods are based on rules, primarily deduced from knowledge or its database components. The feature invariants are obtained from the result of the characteristic data from its database. The remaining two classes, being the template matching and the appearance-based methods, are the main process for testing and verifying the system.
In this paper, we propose the comparative analysis of the color matching system for the teeth recognition. This research uses a 16 colors shade guide standard as the real data parameter, which is suitable for Indonesian teeth colors, using RGB, HSV, and Lab color models.
The first step of this research involves taking the RGB, HSV, and Lab elements to the 16 sampled teeth color from images that have been taken earlier using a digital camera in 288 lux lighting parameter. The color feature of the teeth will be obtained using moment invariant and this feature’s result will be classified and recognized using KNN, NN, and DT algorithms to take the 16 types of dental color images. This system is assumed to have an accurate performance, based on the element color parameter and the kind of algorithm involved. The time computation process is also analyzed in this system, which depicts the correlation between accuracy in performance and time computation of each algorithm.
Materials and Methods
In this section of the study, we describe some requirements processes which are implemented in this color teeth matching system for achieving high accuracy in result. Those are collecting the dental image for creating the database system, basing its parameter criteria especially on the taking images process.
Then, the identification process to the colors characteristics from its dental images using color models calculation and analysis. This color identification is called the pre-processing phase. According to the high variation result obtained from the pre-processing phase, it is required that some additional algorithms be used to classify the data, based on its identical characteristic using KNN, NN, and DT algorithms. The output from the classification process is the main feature which is represented by the characteristic of each type of dental image. These features are used in testing, validating, and measuring the accuracy level of this matching system. This proposed system is implemented with three main processes which are creating the database system, pre-processing, and processing, including the learning and testing process, as shown in Figure 1.
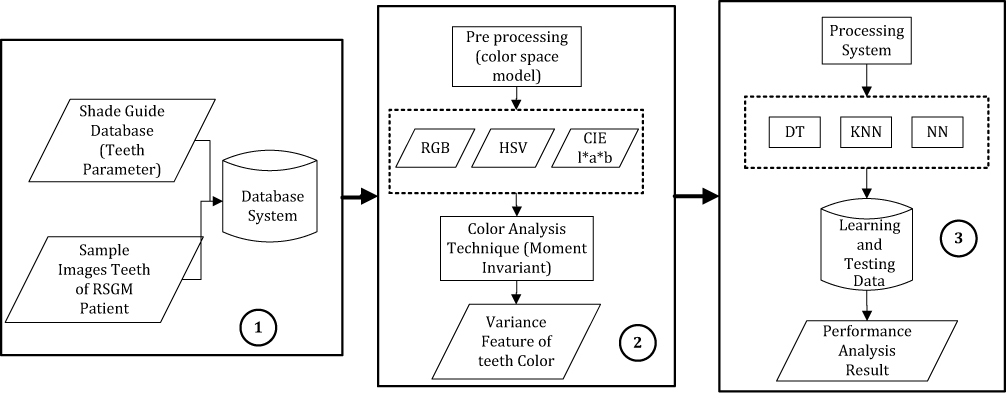 |
Figure 1 System design of color matching for dental recognition. (1) Collecting data. (2) Extracting feature. (3) Learning and testing process. |
Database System
The VitaPan dental shade guide consists of the 16 colors shade guide, which are standard real data parameters, suitable for the market. This phase of the study involves the collection of various general dental images of patients in the hospital by a digital camera, which has been calibrated prior, minimizing the influence of distance and lighting condition. The lighting condition captured during this process is set at a range of 250–300 Lux level. These dental images are stored in a specific template and can be used as a database. Each dental image is classified as piece of images that has certain color for having match to the shade guide. Furthermore, the database also contain the 16 types of dental images, based on its shade guide as the matching reference. These 16 types of dental images, as shown in Figure 2, are obtained from the teeth and mouth hospital at Airlangga University, Surabaya.
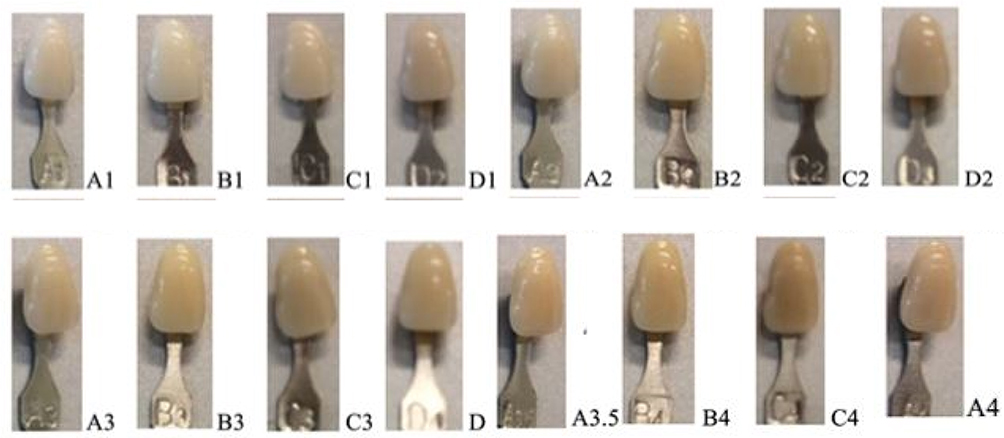 |
Figure 2 Sixteen types of dental images from the shade guide reference. The VITAPAN classical A1–D4 shade guide (Internationally established dental shade guide commercial product). The arrangement of the shades in the VITAPAN classical family of shades is as follows: A1–A4 (reddish-brownish hue). B1–B4 (reddish-yellowish hue). C1–C4 (greyish hue). D2–D4 (reddish-grey hue). Chroma is designated with numerical values 1, 2, 3, and 4. |
The color intensity of dental images is very similar, hence these images will be cropped into regions which contain only a single tooth, based on the classified types at shade guides. The single tooth will be cropped again, based on the intersection result, obtained from three horizontal and vertical partitions. These cropped areas will be formed into a 40x40 pixels size dimension, as Illustrated in Figure 3.
 |
Figure 3 Region area from dental image partition for each type. A1–A4, B1–B4, C1–C4, D1–D4 (the VITAPAN classical family shade guide; Internationally established dental shade guide commercial product). |
Pre-Processing System
The second step of this system is called pre-processing, aimed at determining the images characteristic from its colors. The color study can be performed, with the knowledge of a color key, containing the image. A popular technique for visual color determination is represented in three dimensions as the color spaces components. Those are RGB; red (r), green (g), and blue (b) as the primary colors. Combining all three primary colors will produce lighter colors which can be seen as white colors. This color combination can be used to describe the teeth color characteristics that are contained, with white colors as the main color at their images. The RGB value of the dental images can be calculated using the following equation:
(1)
The maximum value of each RGB parameters is represented by V. Then, according to the RGB result calculation, this parameter can be used as input initialization of HSV as the second color characteristics of this system.
(2)
HSV is contained with hue, value, and chroma parameters. Hue (H) is the main attribute color from another family of colors, whereas values (V) indicates the lightness level of the colors, and chroma (S) is the degree of color saturation. The value of V has been calculated before in equation (1) and will be used for H and S calculations as the conditional checking parameters, as shown in equation (2).
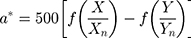
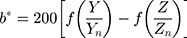
Inconsistencies in visual color determination by the dental matching system should be compared with another color models calculation, Lab. Lab color models (L*a*b*) are represented by the color characteristics based on coordinate values. The L* refers to the lightness coordinate at the range value 0 (black) to 100 (white), while the a* and b* are chromaticity coordinates from the red-green axis and yellow-blue axis, respectively. There are several steps for calculating the Lab values; first it should transform the RGB value calculation from equation (1) in the form of 3D coordinates (X, Y, Z) as derived in the following equation:9,10
(3) (4) (5)


Then, the value of L*a*b can be defined as follows:
(6) (7) (8)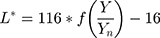
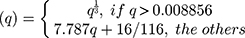
Xn, Yn, Zn values are obtained from R=G=B=1, with the range of R, G, B at 0–1. The f function in equations (6–8) is represented as f(q), which can be determined using the following equation:
(9)
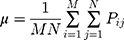
The calculation result of each color model has high variative data. Due to that problem, this requires additional calculation based on the statistical approach. In this system, there are four statistical parameters used. The first is the mean value calculation for describing the distribution of data of each color model, as calculated in equation (10).
(10)
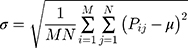
Then, for measuring the variative level of the color models, this is calculated by finding the square root from variance calculation which is called the deviation standard.
(11)
The output from mean and deviation standard will result in the variative distribution model. There are two distributions modeling systems, namely the asymmetry condition and pointed condition. The asymmetry condition can be illustrated as the negative value and the positive value in different levels. This condition can be recognized, using skewness calculation from its null values, as shown in the following equation:
(12)
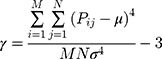
The distribution of data at pointed condition, which is centralized at positive values while another set of data are at negative values, can be derived through the Kurtosis method.
(13)
According to statistical analysis for determining the specific characteristics of each color model from the dental images, specific features, such as height, width, and the color value were extracted. This process can be called feature extraction using the moment invariant technique, based on its statistical calculation.5
Processing Process
Due to the many features result obtained from the color analysis phase, some classification algorithm is required for determining the compatible data. This feature result will be classified and recognized using KNN, NN, and DT algorithms to take the 16 types of dental color images. Decision tree is a flowchart structure that resembles a tree (the tree), where each internal node denotes a test on an attribute, each branch represents the results of the test, and the leaf node represents a class or class distribution. The chronology of the decision tree is in the pan from the root node to the leaf node that holds the prediction. There are many algorithms for arranging the decision tree system, one of them is the C.45 algorithm. The C.45 algorithm can handle numeric data which is used to gain a ratio calculation. It also requires an information value in bits unit from the object using the entropy concept. Entropy (S) is the number of bit units, which has been predicted for extracting the class (+ or -) from several random data at the sample, S. The value of entropy can be used for measuring the inauthenticity of S. The equation of entropy calculation at the S sample is derived as:11,12
(14)
where S is the sample data of training process; (15) is the number of positive resolution data, while
  is the number of negative resolution data. The result of entropy has some conditions for determining the expected data. When Entropy (S)=0, all of the data is located at the same class. Entropy (S)=1 if the numbers of positive and negative in S are the same. The number of positive and negative are not the same when the range of entropy value is more than 0 and less than 1. After calculating the entropy value, the gain concept is also implemented to obtain the attribute of A which has a relative connection to the S output. The calculation of gain is derived as:
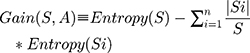
where A is the attribute of the sample (S); n is the number of partitions of A attribute. |Si| is the number of samples from partition i and |S| is the sample of S.4
The second classification algorithm of this system is NN (Neural Network). NN is the adaptive system that can be modified by its structure based on external information and internal information of its network. NN can be used for modeling the complex relation among input and output systems for finding the data pattern. Neuron is the basic of learning process from NN. Every NN has an interconnected basic processing system. it is called neuron. Network is learned using weight modification that has relation between neuron during the training process.6
The last algorithm is KNN (K-nearest neighbors), the instance-based learning algorithm.7 The KNN algorithm works based on grouping of the k object data which have the same value as the given parameter. KNN is usually used for achieving the desired data at data training and data testing. The different value between data training and data testing is represented as the distance measurement using euclidean distance calculation:8
(16)
where an and bn are the attribute values from the two records process at data training and data testing, respectively. After that, the result between data training and data testing should be compared based on its attribute value to evaluate the similarity value of this algorithm. In the KNN algorithm, a higher similarity value will be shown, indicating that the KNN modeling system has been successfully implemented for providing the high accuracy level. The similarity value can be illustrated by using 0 and 1 level, the 0 value means the data is almost the same or the same while the 1 value means the data is absolutely different or not the same. However, this level has an immeasurable similarity level. Therefore, in the KNN algorithm, the similarity level can be calculated using multiplication with some degree level known as weight (w) based on its attribute number (n).
(17)
where p is the new case data which can be used from the testing data, while q is the case in storage which is obtained from learning data. In this paper, the calculation of color models will be simulated using a Matlab simulator. Subsequently, the output value from color models calculation will be simulated again at a rapidminer simulator for having the classification process using KNN, NN, and DT algorithms. According to different result performances of those algorithms, the analysis of this system considers two main parameters. These are the accuracy performance, based on the elements of color parameter and the kind of algorithm and processing time, which indicates the correlation between accuracy in performance and computation of each algorithm when this system is being implemented on a smart phone.
Results and Discussion
This system, which has been developed with relevant functionalities and usage-friendly, can be used by dentistry. The proposed system is aimed at solving problems, associated with human visual subjectivity. To this end, measuring the successful level of this system can be analyzed, based on learning accuracy, testing accuracy and processing time performance. There are 640 total data results, obtained from the pre-processing phase in the form of RGB, HSV, and Lab color models calculation. Those data are classified, using DT, KNN, and NN, based on each color model. As shown in Table 1, the 640 data are divided into 480 learning data and 160 testing data. Each learning datum is grouped into 30 data sets, while the testing data are grouped into 10 datasets. Therefore, there are 16 datasets which will be analyzed, adjustable to represent the 16 types of teeth.
 |
Table 1 Hypothesis Null Calculation of RGB Using Color Model Parameters |
Using a dataset which comprises and represents the 16 teeth types, the null hypothesis (H0) is used for basic election at the processing phase. Statistically, the null hypothesis (H0) indicates that there is no significant relationship with other parameters. As shown in Table 1, using RGB color models at 0.05 error margin, the null hypothesis (H0) shows that there is no significant relationship between parameters measured. This calculation is based on momen color parameters such as mean (m), standard deviation (d), skewness (s), and curtosis (c). Then, R, G, and B are the components of RGB color models which are R (Red), G (green), and B (Blue).
The result of H0 shows that feature testing with those data using 0.05 degrees of freedom has a range interval from −2.0017 to 2.0017, which are the range values at Rm, Gm, and Bm.
According to the experimental results from Table 2, the percentage of learning accuracy, obtained from the RGB color model, shows that using NN achieved the best performance at 97.92%. On the other hand, while the features from the RGB color model takes testing process, the best accuracy performance decreases to 92.50% with only a 2 seconds computation time in using the KNN algorithm. The KNN method in the RGB color model has the fastest computation time, when compared to the other algorithm. Comparison, based on three performance analyses, using the KNN algorithm in the RGB model classification, achieved the best performance, although in the learning process NN is better than KNN. Due to the result obtained, NN has many reductions in testing process, to be represented by 76.88%. In addition, NN also takes a longer computation time, requiring up to 34 minutes, which is possible when applied to the real hardware for the color matching system.
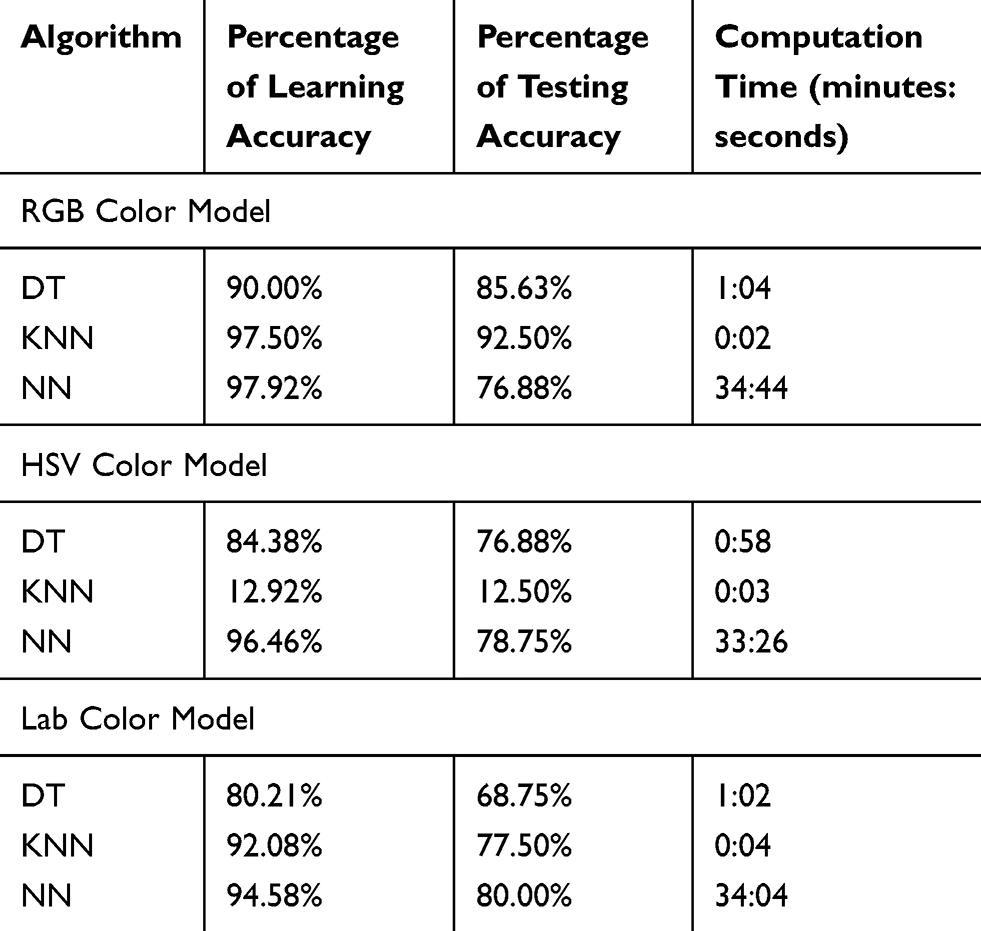 |
Table 2 The Experimental Result Data |
On the other hand, it is different when using the HSV color model to this system. Using NN, the result obtained achieved 96.46% percentage accuracy in the learning process, which is better than DT and KNN algorithms. Following the result of the testing process, using NN has the best performance, representing 78.75%. However, the weakness of NN is that it took a longer computation time, up to 33 minutes, which is not suitable for hardware implementation. When this is compared with the other algorithm in HSV color models, using the DT algorithm is compatible for hardware implementation in the color matching system. Using the DT algorithm achieved 84.38% in learning process and 76.88% in testing process; however, it is lower than NN performance. The computation time of the DT algorithm only required 58 seconds, which is faster than the NN algorithm.
Using the NN algorithm with the Lab color model also achieved the best performance, representing 94.58% for the learning process and 80% for the testing process. Due to the weakness of NN computation time, the modeling system from the NN algorithm is not suitable for hardware implementation which required 34 minutes for processing the system. Using KNN is the feasible solution for the Lab color model system. The accuracy performance of KNN is 92.08% in the learning process and 77.5% in the testing process, requiring a diminutive duration of 0.4 seconds processing time.
According to the color models comparison performance, RGB has the best performance when it is classified using the KNN algorithm, especially at a stable lighting condition (288 lux). The result obtained shows that RGB has accuracy performance in the testing process, with a significant representation of 92.50% within only a 0.02 seconds computation time. Contrary to this observation, the result obtained is different when the lighting condition is not constant in the range of 250–300 lux. The best color model system is using the HSV or Lab color model, which cannot be influenced by the lighting condition. The HSV color model is suitable with the use of the DT algorithm; on the other hand, the Lab is compatible when using the KNN algorithm.
Conclusions
In this paper we propose the comparative analysis of the color matching system for dental recognition, using color moment. The methodology used, based on color recognition, is presented to classify the tooth color models. The simulation result shows that this color matching system achieves the best performance with the use of the RGB color model with KNN algorithm classifier at stable lighting condition. On the other hand, at unstable lighting condition can be used with HSV and DT algorithm combination or Lab color model with the KNN algorithm classifier.
Disclosure
The authors report no conflicts of interest in this work.
References
1. Jian W, Lin J, Alison S, John D, Shigemi I. Assessing the accuracy of computer color matching with a new dental porcelain shade system. J Prosthet Dent. 2014;111(3):247–253. doi:10.1016/j.prosdent.2013.07.008
2. Tam WK, Lee HJ. Dental shade matching using digital camera. J Dent Elsevier. 2012;40(2):e3–e10. doi:10.1016/j.jdent.2012.06.004
3. Chu SJ, Richard DT, Paravina RD. Dental color matching instruments and systems (review of clinical and research aspects). J Dent Elsevier. 2010;38(2):e2–e16. doi:10.1016/j.jdent.2010.07.001
4. Hicham R, Abdelmajid E, Farid B. Classification and recognition of dental images using decisional tree.
5. Mangijao Singh S, Hemachandran K. Image retrieval based on the combination of color histogram and color moment. Int J Comput Appl. 2010;58(3):27–34. doi:10.5120/9263-3441
6. Suprachaya V, Suphakant P. Neural network-based teeth recognition using singular value decomposition and color histogram. In: 2010 2nd
7. Liu J, Zhao N, Runnan H. Study of color matching system for porcelain teeth. In: 2013 IEEE
8. Annesha M, Joydeep M. Image clustering using color moments, histogram, edge and K means clustering. Int J Sci Res. 2013;2(1):532–537.
9. Dan S, Marius DP, Marius DS, Vladimir B, Tudor C, Simona B. A software application to detect dental color. Appl Med Inf J. 2015;37(3):31–38.
10. Pecho OE, Ghinea R, Alessandretti R, et al. Visual and instrumental shade matching using CIELAB and CIEDE2000 color difference formulas. Dent Mater. 2016;32:82–92. doi:10.1016/j.dental.2015.10.015
11. Vasile P, Vasile C, Alex G, Diana D, Bogdan C. Decision support system for color matching in dentistry. Informatica. 2015;LX(1):111–119.
12. Li W, Wang W, Liu M. New color cluster algorithm for image retrieval. In: 2009 Third International Symposium on Intelligent Information Technology Application. IEEE; 2009;3:561–564. Available from: https://ieeexplore.ieee.org/document/5370007.
 © 2019 The Author(s). This work is published and licensed by Dove Medical Press Limited. The
full terms of this license are available at https://www.dovepress.com/terms
and incorporate the Creative Commons Attribution
- Non Commercial (unported, 3.0) License.
By accessing the work you hereby accept the Terms. Non-commercial uses of the work are permitted
without any further permission from Dove Medical Press Limited, provided the work is properly
attributed. For permission for commercial use of this work, please see paragraphs 4.2 and 5 of our Terms.
© 2019 The Author(s). This work is published and licensed by Dove Medical Press Limited. The
full terms of this license are available at https://www.dovepress.com/terms
and incorporate the Creative Commons Attribution
- Non Commercial (unported, 3.0) License.
By accessing the work you hereby accept the Terms. Non-commercial uses of the work are permitted
without any further permission from Dove Medical Press Limited, provided the work is properly
attributed. For permission for commercial use of this work, please see paragraphs 4.2 and 5 of our Terms.