Back to Journals » International Journal of Nanomedicine » Volume 13
Combined use of vancomycin-modified Ag-coated magnetic nanoparticles and secondary enhanced nanoparticles for rapid surface-enhanced Raman scattering detection of bacteria
Authors Wang CW, Gu B, Liu QQ, Pang YF, Xiao R, Wang SQ
Received 30 August 2017
Accepted for publication 7 December 2017
Published 27 February 2018 Volume 2018:13 Pages 1159—1178
DOI https://doi.org/10.2147/IJN.S150336
Checked for plagiarism Yes
Review by Single anonymous peer review
Peer reviewer comments 4
Editor who approved publication: Dr Linlin Sun
Chongwen Wang,1,2,* Bing Gu,3,4,* Qiqi Liu,1,* Yuanfeng Pang,2,5 Rui Xiao,1 Shengqi Wang1–3
1Beijing Key Laboratory of New Molecular Diagnosis Technologies for Infectious Diseases, Beijing Institute of Radiation Medicine, Beijing, People’s Republic of China; 2College of Life Sciences and Bio-Engineering, Beijing University of Technology, Beijing, People’s Republic of China; 3Medical Technology School, Xuzhou Medical University, Xuzhou, People’s Republic of China; 4Department of Laboratory Medicine, Affiliated Hospital of Xuzhou Medical University, Xuzhou, People’s Republic of China; 5Department of Toxicology, Capital Medical University, Beijing, People’s Republic of China
*These authors contributed equally to this work
Background: Pathogenic bacteria have always been a significant threat to human health. The detection of pathogens needs to be rapid, accurate, and convenient.
Methods: We present a sensitive surface-enhanced Raman scattering (SERS) biosensor based on the combination of vancomycin-modified Ag-coated magnetic nanoparticles (Fe3O4@Ag-Van MNPs) and Au@Ag nanoparticles (NPs) that can effectively capture and discriminate bacterial pathogens from solution. The high-performance Fe3O4@Ag MNPs were modified with vancomycin and used as bacteria capturer for magnetic separation and enrichment. The modified MNPS were found to exhibit strong affinity with a broad range of Gram-positive and Gram-negative bacteria. After separating and rinsing bacteria, Fe3O4@Ag-Van MNPs and Au@Ag NPs were synergistically used to construct a very large number of hot spots on bacteria cells, leading to ultrasensitive SERS detection.
Results: The dominant merits of our dual enhanced strategy included high bacterial-capture efficiency (>65%) within a wide pH range (pH 3.0–11.0), a short assay time (<30 min), and a low detection limit (5×10² cells/mL). Moreover, the spiked tests show that this method is still valid in milk and blood samples. Owing to these capabilities, the combined system enabled the sensitive and specific discrimination of different pathogens in complex solution, as verified by its detection of Gram-positive bacterium Escherichia coli, Gram-positive bacterium Staphylococcus aureus, and methicillin-resistant S. aureus.
Conclusion: This method has great potential for field applications in food safety, environmental monitoring, and infectious disease diagnosis.
Keywords: surface-enhanced Raman scattering, Fe3O4@Ag magnetic nanoparticle, Au@Ag nanoparticles, vancomycin-modified, rapid bacteria detection
Introduction
The growing prevalence of multidrug-resistant bacterial pathogens has gained recognition as a serious public health crisis across the world.1 Besides implementing strict hygienic regulations, rapidly and accurately detecting the pathogenic microorganism is critical to limit the spread of pathogens and to reduce their antibiotic resistance.2,3 The current gold standard methods are conventional culture and antibiotic susceptibility testing, which remain the most reliable and inexpensive for microbial identification. However, they require 6–24 h to grow and additional dozens of hours for confirmation by morphologic and biochemical characterization. Thus, these methods are not appropriate for rapid screening of pathogens.4 As an alternative, some molecular-based methods, such as polymerase chain reaction,5 chemiluminescence assays,6 DNA sequencing,7 and enzyme-linked immunosorbent assays,8 have been developed to rapidly detect low concentration of bacteria. These modern techniques have been proven to be sensitive and specific, but require bulky sophisticated instruments and are of high cost and are technologically complex.9,10 Thus, the development of fast, low-cost, highly sensitive methods for the detection of pathogens is still urgently needed.
Surface-enhanced Raman scattering (SERS) has been shown to be a powerful and promising tool in bacteria identification and detection because of its high sensitivity, simple preparation, nondestructive data acquisition, and importantly, its ability to generate entire organism fingerprints.11–17 SERS detection of bacteria highly depends on the performance of SERS substrates because the enhancement is attributed to the electromagnetic field in the proximity of roughened noble metal surface.18–21 Scientists have developed various types of SERS-active nanoparticles (NPs) or chips for acquiring high-quality SERS spectra of bacteria, such as Ag NPs,22 Ag nanowires,23 Ag NPs@Si arrays,24 and Au-coated magnetic NPs (MNPs),25 because of the rapid progress of nanotechnology in recent years. Although these reported SERS substrates can amplify the Raman signal of bacteria with good specificity, the sensitivity and reliability of the SERS substrates are still easily subjected to interference in complex environments. Thereby, two stumbling blocks are still needed to be overcome in practical SERS detection of pathogens: spectral interference from the mixture and the laborious multistep sample pretreatment.
Vancomycin is a broad-spectrum glycopeptide antibiotic that can easily bind to D-Ala-D-Ala moieties in the peptidoglycan of the cell wall of a Gram-positive bacterium through hydrogen bonds.26 Moreover, previous studies demonstrated that vancomycin-modified magnetic beads can effectively and electively capture not only Gram-positive bacteria but also Gram-negative bacteria.27,28 Thus, the vancomycin-modified SERS substrates can be used as biorecognition platform for bacteria capturing and sensing in complex environments, and some pioneering works have been reported.29–32 For example, Liu et al showed that vancomycin-coated Ag SERS substrates can be used to differentiate different bacterial strains in human blood.29 Wu et al reported a vancomycin-functionalized Ag nanorod array and used the substrate to study SERS signals of six foodborne pathogens in mung bean sprout samples.30 However, all these reported approaches used the sophisticated solid-phase SERS substrates as the platform for vancomycin modification, which led to their relatively low capture efficiency and rather high cost.
Herein, we report a convenient SERS biosensor for detection of different pathogens based on combined use of vancomycin-modified Fe3O4@Ag MNPs and plasmonic Au@Ag NPs as secondary enhanced particles. In this system, the Fe3O4@Ag-Van MNPs serve as both the bacteria capture tool and the SERS signal amplification platform. After bacteria capturing by the Fe3O4@Ag-Van MNPs, the formed complexes were magnetically separated and rinsed with deionized water to remove the interferent. When spreading the Au@Ag NPs on the complexes, the bacteria SERS signal is synergistically enhanced by using Fe3O4@Ag MNPs and Au@Ag NPs in conjunction, resulting in a large number of hot spots on the bacterial cells. As a result of the capture and enrichment ability of Fe3O4@Ag-Van MNPs and the enhancement ability of the two SERS agents, the dual enhanced strategy enables reproducible and sensitive bacterial detection (5×10² cells/mL) with a short testing time (within 30 min). The combined system further demonstrated that it is able to distinguish different bacteria (including drug-resistant pathogens) in solution. As far as we know, this study is the first to use vancomycin-modified magnetic particles as the bacteria enrichment platform and high-performance SERS substrate for label-free bacteria detection. Moreover, the two SERS agents of our system are homemade products. Especially, the high-performance Fe3O4@Ag MNPs with good dispersity in aqueous solution, excellent magnetic responsiveness, and effective SERS ability were synthesized following our previously established route,33,34 which ensures a low-cost, reliable, and powerful SERS biosensor for bacterial detection.
Experimental section
Materials and chemicals
Ferric chloride (FeCl3·6H2O), ethylene glycol, diethylene glycol, silver nitrate (AgNO3), and chloroauric acid tetrahydrate (HAuCl4·4H2O) were purchased from Sinopharm Chemical Reagent Co. Vancomycin, p-aminothiophenol (PATP), polyethyleneimine (PEI), polyvinylpyrrolidone (40K), N-(3-dimethylaminopropyl)-N′-ethylcarbodiimide hydrochloride, 11-mercaptoundecanoic acid (MUA), and 2-(N-morpholino)ethanesulfonic acid were obtained from Sigma-Aldrich Co. (St Louis, MO, USA). All aqueous solutions were purified with a Milli-Q system (18.2 MΩ/cm). Mice blood samples, which contained anticoagulants, were collected from healthy mice. Commercial Escherichia coli (E. coli BL21) and clinical isolation strains of Staphylococcus aureus (S. aureus 04018) and methicillin-resistant S. aureus (MRSA) were provided by Affiliated Hospital of Xuzhou Medical University.
Synthesis of high-performance Fe3O4@Ag MNPs
The core–shell structured Fe3O4@Ag MNPs were prepared via a four-step reaction as we previously reported.33,34 First, the superparamagnetic Fe3O4 particles (~200 nm) were synthesized through a modified solvothermal reaction. Then, the Fe3O4@PEI MNPs were prepared with the self-assembly of PEI to form a cationic layer on the surface of magnetic core by 30 min sonication.35 Subsequently, the as-prepared Fe3O4@PEI MNPs were mixed with 3–5 nm sized Au colloids and sonicated for another 30 min to build Fe3O4@PEI-Au seed MNPs. Finally, the Fe3O4@Ag MNPs were quickly obtained through a seed-mediated growth strategy in which polyvinylpyrrolidone provided effective protection for stability of MNPs and the Ag shell growth.
Synthesis of vancomycin-modified Fe3O4@Ag MNPs
Vancomycin molecules were conjugated to the surface of Fe3O4@Ag MNPs via a two-step coupling method, as illustrated in Scheme 1. The Fe3O4@Ag MNPs were carboxyl group functionalized first and then conjugated with vancomycin according to a previously reported method.27 In brief, Fe3O4@Ag MNPs (10 mg/mL) were sonicated in an MUA ethanol solution (20 μM) for 2 h to obtain surface-carboxylated MNPs. Then, the prepared Fe3O4@Ag-MUA MNPs in 10 mL of 2-(N-morpholino)ethanesulfonic acid buffer (0.1 M, pH 5.5) were mixed with 1 mL of N-(3-dimethylaminopropyl)-N′-ethylcarbodiimide hydrochloride (10 mg/mL) and 1 mL of vancomycin (5 mg/mL) and then sonicated for 2 h. The resulting Fe3O4@Ag-Van MNPs were washed with water and redispersed in PBS buffer (10 mM, pH 7.4).
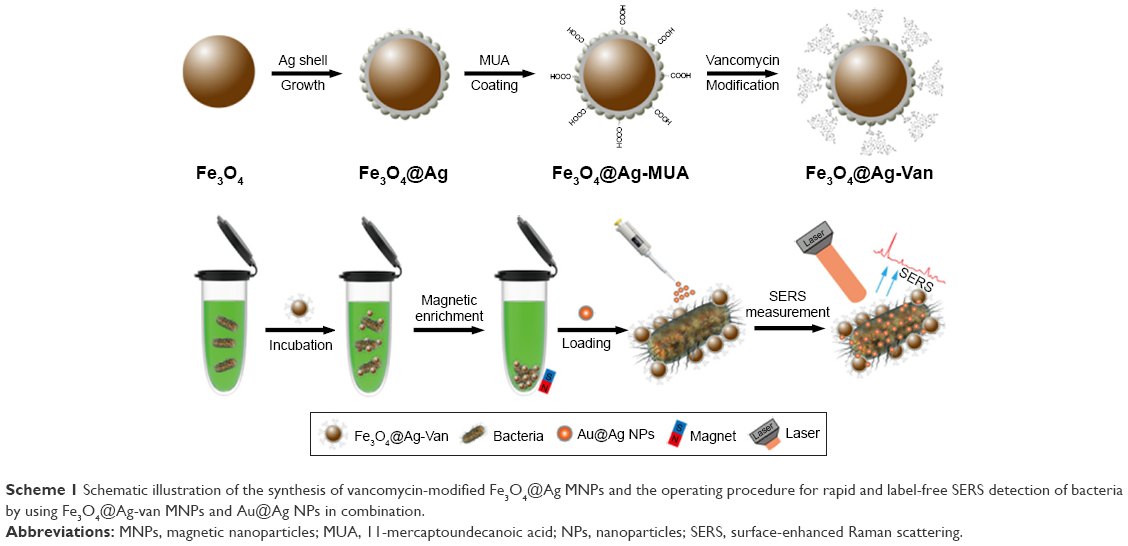 | Scheme 1 Schematic illustration of the synthesis of vancomycin-modified Fe3O4@Ag MNPs and the operating procedure for rapid and label-free SERS detection of bacteria by using Fe3O4@Ag-van MNPs and Au@Ag NPs in combination. |
Preparation of the secondary enhanced NPs
Au NPs (45 nm) were synthesized through a previously reported sodium citrate reduction method.36 The Au@Ag core–shell NPs were prepared by coating the Ag shell on the Au NPs.37,38 Briefly, 100 mL of as-prepared Au NPs solution was double diluted with deionized water, heated to boiling, and then vigorously stirred. Subsequently, 2 mL of trisodium citrate (1%, w/v) was added to the suspension and used as the reducing agent. Finally, 1 mL of silver nitrate (10 mM) was dropwise added to the above suspension and the mixture was then maintained at 100°C to keep boiling state for 45 min, yielding the 60 nm Au@Ag core–shell NPs.
Bacteria growth and sample preparation
The clinically isolated bacterial strains (S. aureus 04018 and MRSA) were grown in trypticase soy broth medium, and the common laboratory strain (E. coli BL21) was cultivated in Luria–Bertani medium at 37°C with continuous shaking (180 rpm) overnight. Then, the cultures were adjusted to an optical density at 600 nm (OD600) of 1.0 with broth medium and suspended in PBS buffer (pH 7.4). After that, 0.1 mL of the bacterial solution was diluted 1×10⁵ times with PBS buffer, coated on the agar plates, and incubated overnight at 37°C. Finally, the colonies on the agar plates were counted to determine the number of colony-forming units per milliliter. In this experiment, OD600 of S. aureus =1.0 is ~1.5×10⁸ cells/mL and OD600 of E. coli =1.0 is ~8×10⁸ cells/mL, which are consistent with previous reports.39–41 The obtained bacteria were washed thrice with PBS (pH 7.4) before the SERS measurement.
Magnetic capture of bacteria and SERS measurement
For the magnetic capture of bacteria, solutions from a concentration of 1×10⁸–1×10² cells/mL in PBS solution (pH 7.4) were prepared first. Then, we added 10 μL of Fe3O4@Ag-Van MNPs (10 mg/mL) to 10 mL of the as-prepared bacterial sample, followed by incubation for 15 min with gentle shaking. The Fe3O4@Ag-Van MNPs with the captured bacteria were then magnetically separated and washed twice with deionized water. Afterward, the collected complexes were redispersed in 5 μL of deionized water and transferred to a Si chip. A few minutes after complete evaporation of the solvent, concentrated Au@Ag NPs were spread on the complexes and the SERS signals were then recorded.
Instruments
Field-emission scanning electron microscopy (FE-SEM) measurements were made on a JSM-7001F microscope operating at an accelerating voltage of 10 kV (JEOL, Tokyo, Japan). Transmission electron microscopy (TEM) images were obtained from a Hitachi H-7650 microscope operating at an accelerating voltage of 80 kV. High-resolution TEM (HRTEM) images and energy dispersive X-ray spectra were obtained using a JEM-2010F microscope at an accelerating voltage of 200 kV (JEOL). The magnetic properties of the prepared MNPs were studied using a superconducting quantum interference device magnetometer (MPMSXL-7) at 300 K. Ultraviolet (UV)–vis spectra were recorded with a Shimadzu 2600 spectrometer. The powder X-ray diffraction (XRD) patterns of the Fe3O4@Ag MNPs were investigated by a Japan Rigaku D/max 2,550 VB/PC rotation anode X-ray diffractometer. Zeta potential of all samples was studied using dynamic light scattering with Zetasizer Nano ZS (NANO-ZS 90; Malvern Instruments, Malvern, UK). All Raman spectra were recorded with a portable Raman system (B&W Tek, i-Raman Plus BWS465–785H spectrometer) with a back-illuminated charge coupled device as the detector. SERS measurements were taken using a 785 nm excitation laser, 20× microscope objective, and spectral resolution of 1 cm−1. For each sample, five spectra from different sites were collected and averaged to ensure reproducibility.
Results and discussion
Operating principle illustration and high-performance Fe3O4@Ag MNP characterization
The fabrication processes for vancomycin-modified Fe3O4@Ag MNPs are illustrated in Scheme 1. The schematic procedure of the dual enhanced strategy for bacteria SERS detection is outlined in Scheme 1, which is based on the combination of vancomycin-modified Fe3O4@Ag MNPs and plasmonic Au@Ag NPs. The high-performance Fe3O4@Ag-Van MNPs acted as a multifunctional platform in this study; they were not only efficient in capturing and enriching bacteria from the sample solution but also served as effective SERS substrates to enhance signals of the captured bacteria. After bacteria capturing and interferent rinsing, the formed MNP–bacterium complexes can be readily transferred and immobilized on the silicon chips as SERS substrates by using a magnet. The condensed dot can provide a large area of closely packed Fe3O4@Ag MNPs with high-density hot spots that are expected to enhance Raman scattering. To further improve the detection sensitivity, the concentrated Au@Ag NPs were dropped into the condensed dot and could cover the blank surface of bacteria, producing more hot spots. Thereby, the strong and reproducible SERS spectra of bacteria could be quickly obtained in a short detecting period.
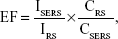
The high-performance Fe3O4@Ag MNPs were synthesized by our proposed PEI-mediated seed growth method and the detailed synthesis procedure is shown in Figure S1. First, superparamagnetic Fe3O4 MNPs with an average diameter of about 200 nm were synthesized. Then, positively charged PEI self-assembled quickly on the surface of Fe3O4 core to form a thin multifunction interlayer via sonication that could adsorb Au seed densely and uniformly and stabilize the entire structure. Finally, silver ions were reduced by CH2O and deposited directly on the Au seeds, thereby resulting in complete and rough Ag shells surrounding the Fe3O4 cores. TEM images of the as-obtained MNPs from each step are shown in Figure 1A–C. After the formation of Ag shell, the mean diameter of the Fe3O4@Ag MNPs increased from 200 to 290 nm (Figure 1C). Therefore, the thickness of Ag shell was ~45 nm.
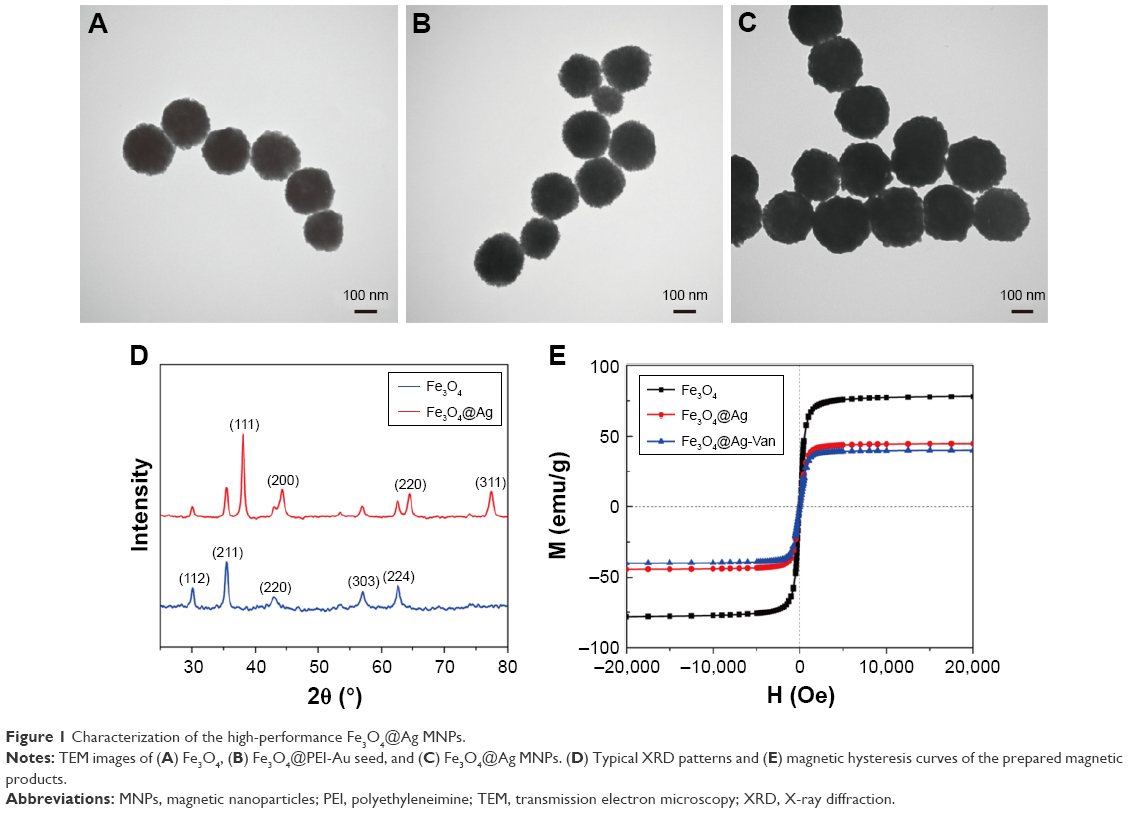 | Figure 1 Characterization of the high-performance Fe3O4@Ag MNPs. |
The crystal structure and purity of the main synthetic products were characterized by XRD. Figure 1D shows typical XRD patterns of Fe3O4 MNPs and Fe3O4@Ag MNPs.33 Obviously, five diffraction peaks of Fe3O4 can be clearly observed at 2θ values of 30, 35.4, 43, 56.9, and 62.5, which are assigned to crystalline planes (112), (211), (220), (303), and (224), respectively.42 With the formation of the continuous Ag shell on the Fe3O4 MNPs, four new intense peaks of Ag appeared at 2θ values of 38.3, 44.2, 64.5, and 77.4, which are ascribed to the (111), (200), (220), and (311) crystalline planes of the synthesized Ag shell (JCPDF no 04-0783).43
The magnetic property of Fe3O4@Ag MNPs was characterized with a superconducting quantum interference device magnetometer (MPMSXL-7) at room temperature (Figure 1E). The magnetic saturation (MS) value of Fe3O4 MNPs was ~77.8 emu/g. After the formation of Ag shells, the MS value decreased to 40.5 emu/g. The decrease in MS indicates that the Fe3O4 surface was covered with nonmagnetic materials, such as PEI Au seed, and Ag NPs-shell. Moreover, the Fe3O4@Ag MNPs could be completely separated from the solution by an external magnet within 30 s, indicating that these Fe3O4@Ag MNPs have strong magnetic responsivity and are very suitable for efficient separation and enrichment of target molecules in solution.
Synthetic strategy for vancomycin modification and characterization of Fe3O4@Ag-Van MNPs
The strategy for the conjunction of vancomycin molecules into the surface of Fe3O4@Ag MNPs is shown in Figure 2A. MUA was chosen as the bifunctional linker because it can easily bind covalently to the Ag surface through the thiol group and provides terminal carboxyl group for subsequent coupling reaction.44,45 Moreover, the carbon chains of MUA can act as a suitable arm for reducing the steric hindrance between vancomycin and bacteria. The covalent binding of vancomycin to MUA was performed via carbodiimide activation, which was very reliable and convenient. HRTEM analysis was performed to provide detailed insights into the surface structure of the Fe3O4@Ag-Van MNPs (Figure 2B and C). Magnified HRTEM image of the edge of Ag shells (Figure 2C) showed that, the Fe3O4@Ag MNPs were surrounded by a thin and transparent membrane consisting of MUA and vancomycin, with a thickness of ~1.3 nm. As shown in Figure 1E (blue line), such a thin membrane coating almost did not affect the magnetic property of Fe3O4@Ag MNPs.
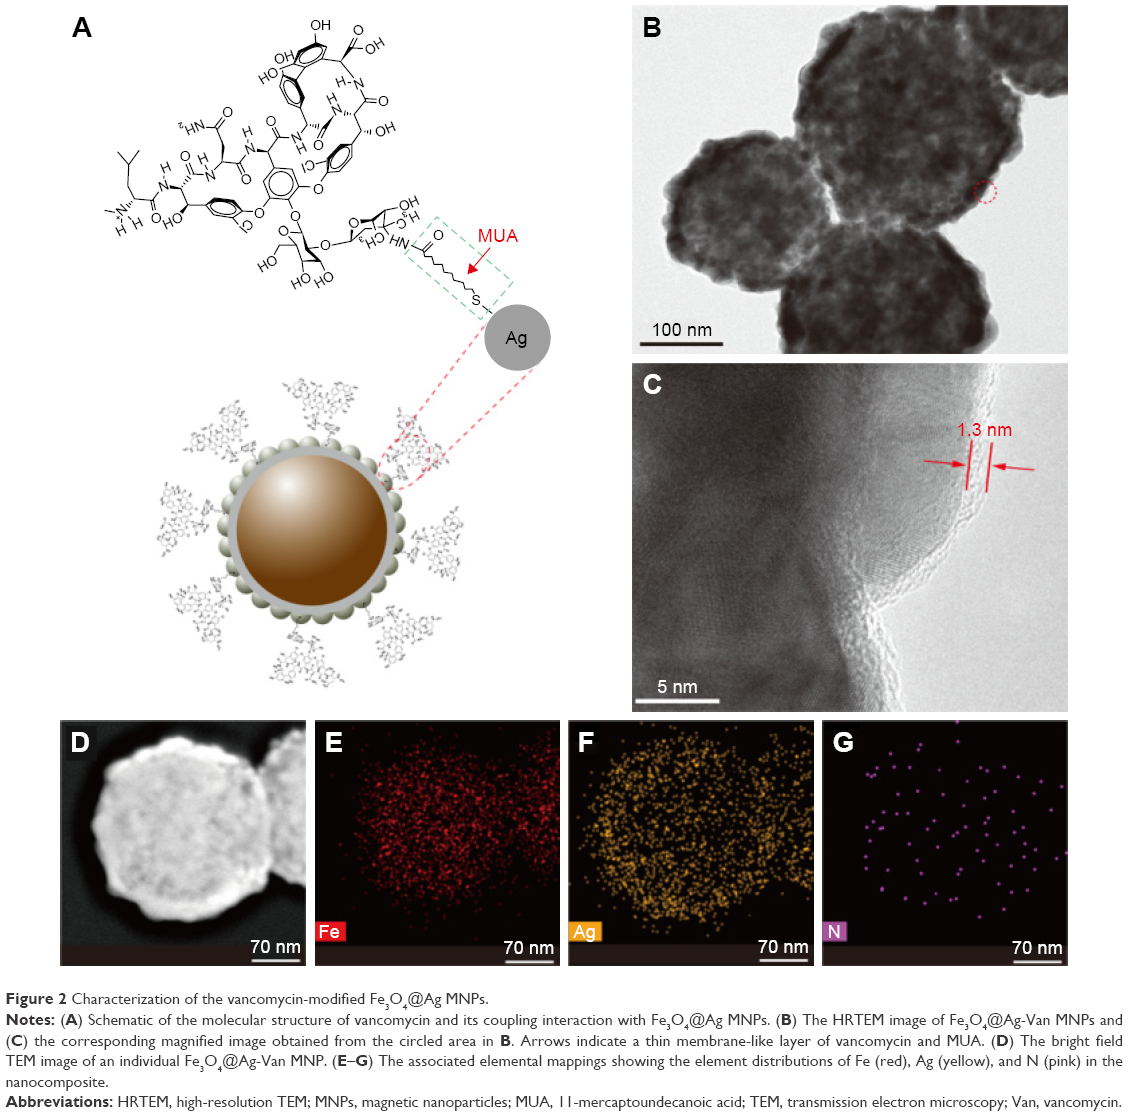 | Figure 2 Characterization of the vancomycin-modified Fe3O4@Ag MNPs. |
In general, the small molecules formed an amorphous and porous layer on the surface of NPs. PATP was chosen as a Raman probe to evaluate the SERS activity of the vancomycin-modified Fe3O4@Ag MNPs because of its thiol group, which can bind to the Ag surface by chemical bonding (Ag–S), as well as its well-characterized Raman bands.46 Figure S2 presents the typical SERS spectra of PATP molecules adsorbed on the Fe3O4@Ag and Fe3O4@Ag-Van MNPs. All the identified peaks of the spectra can be assigned to p, p′-dimercaptoazobenzene Raman modes.47 According to the theory proposed by Wu et al, PATP adsorbed on the Ag materials or nanostructures undergoes a catalytic coupling reaction to selectively produce a new aromatic azo compound DMBA. The two Raman peaks 1,077 and 1,590 cm−1 arise from the adsorbed PATP molecules, whereas the Raman peaks at 1,143, 1,391, and 1,436 cm−1 arise from the newly-produced p, p′-dimercaptoazobenzene molecules.48,49 Therefore, we can conclude that the vancomycin layer is porous. In addition, the SERS enhancement factor (EF) determined based on the peak intensity at 1,077 cm−1 was estimated to be 1.61×10⁵ (Supplementary materials). Though the SERS intensity of PATP decreased after the vancomycin-modified process, the EF of Fe3O4@Ag-Van MNPs was relatively high for the detection of trace chemicals.
The energy-dispersive X-ray elemental mapping images (Figure 2D–G) verify that Fe element is located in the magnetic core. Ag element is homogeneously distributed throughout the entire nanostructure, whereas N signal is located on the surface of the Fe3O4@Ag-Van MNPs. In the designed Fe3O4@Ag-Van nanocomposite, N element was only derived from the vancomycin molecules. Therefore, the intensive N signal confirms that Fe3O4@Ag MNPs was successfully conjugated with vancomycin. In addition, the surface modification were also confirmed by zeta potential measurement, in which the zeta potentials increased from −27.8 mV to eventually −8.96 mV, hinting that vancomycin molecules were tightly bound on the Ag surface and encapsulated the negatively charged Ag shell from the outside environment. The zeta potentials of products at different stages of modification are provided in detail in Figure S3. Moreover, the representative UV–vis absorption peak at 280 nm of vancomycin solution significantly decreased after vancomycin conjugation, further indicating that vancomycin molecules were effectively conjugated (Figure S4).
Enrichment performance and SERS ability of Fe3O4@Ag-van MNPs
Vancomycin is a glycopeptide antibiotic. It interacts with the terminal D-Ala-D-Ala peptide unit of the cell wall of the Gram-positive bacterium via strong hydrogen-bonding interactions (Figure 3A). Moreover, previous studies demonstrated that vancomycin-modified MNPs can effectively capture not only Gram-positive bacteria but also Gram-negative bacteria. To study the capture efficiency of vancomycin-modified Fe3O4@Ag MNPs, the OD measurement experiments were carried out. The bacterial stain S. aureus 04018 was used as a model pathogen, and the cell density was adjusted to an OD600 of 0.6. Up to 100 μL of Fe3O4@Ag-Van MNPs (10 mg/mL) was injected into the prepared S. aureus solution of neutral pH and incubated for 15 min. Tubes a–d in Figure 3B display the photographs obtained by mixing S. aureus solution alone, Fe3O4@Ag-Van MNPs with S. aureus solution, Fe3O4@Ag-Van MNPs with S. aureus solution shaken for 15 min, and the mixture solution after magnetic capturing by Fe3O4@Ag-Van MNPs, respectively. Precipitates were observed in the tube c containing the mixture with incubation, which indicated the binding affinity arising between the Fe3O4@Ag-Van MNPs and the bacteria. Aggregates of Fe3O4@Ag-Van MNPs were enriched in 60 s using a handheld magnet, and the aqueous solution became transparent (tube d, Figure 3B). This phenomenon suggested that large amounts of bacteria were captured by the Fe3O4@Ag-Van MNPs and the formed complexes could be magnetically enriched in a short time. The TEM picture (Figure 3C) was taken to show the Fe3O4@Ag-Van MNP-mediated bacterial aggregation on the microscopic scale. Vancomycin-modified MNPs were apparently well conjugated on the bacterial wall (inset of Figure 3C). However, a large naked area of bacteria surface is still observed because of the steric hindrance of the relatively large-sized particles.
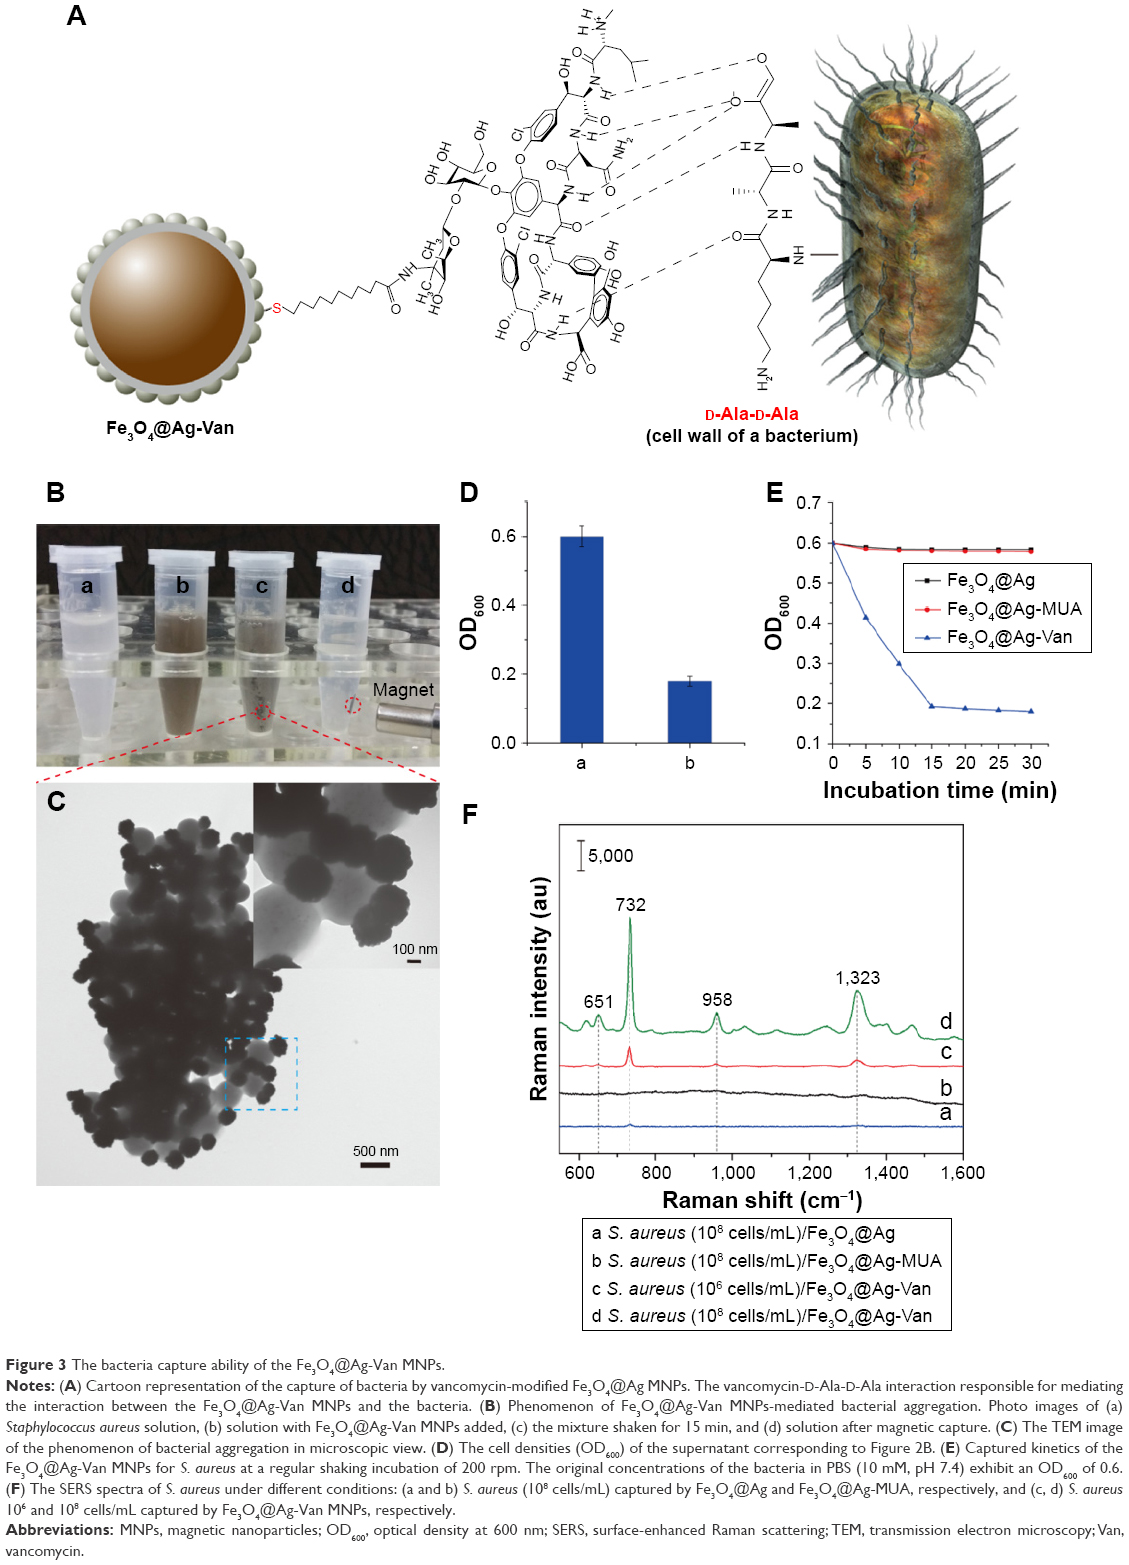 | Figure 3 The bacteria capture ability of the Fe3O4@Ag-Van MNPs. |
The cell capture efficiency (CCE) of the prepared Fe3O4@Ag-Van MNPs was investigated by comparing the difference in OD of bacteria solution before and after magnetic separation. The OD600 values of the supernatant of tubes a and b were 0.59 and 0.18, respectively, as shown in Figure 3D. The data values show the means, and the error bars show the standard deviations from three measures. Thereby, the CCE of Fe3O4@Ag-Van MNPs was calculated to be 69.4% (ie, CCE [%] =100[α−β]/α, where α and β represent the OD600 values before and after magnetic separation).50 Moreover, bacteria were captured by vancomycin-modified MNPs in a time-dependent manner (Figure 3E). The concentrations of S. aureus in the supernatant quickly decreased with the increase in reaction time, and the adsorption almost reached equilibrium in 15 min. By contrast, the unmodified Fe3O4@Ag and MUA-modified Fe3O4@Ag particles showed inability to effectively capture bacteria in solution because the OD600 values of their supernatant changed slightly. To study the influence of pH on the capture efficiency of bacteria by Fe3O4@Ag-Van MNPs, the tests were carried out in PBS solutions with pH values between pH 3.0 and 11.0. No effect of pH on the capture of S. aureus was observed in the studied pH range (Figure S5). The result indicates that Fe3O4@Ag-Van MNPs can be used as effective capturing tools for bacteria in a wide pH range.
The captured bacteria are in close contact with the rough Ag surface of the MNPs. Thus, their intrinsic Raman signal can be directly enhanced by using a Raman spectrometer. Figure 3F shows the SERS spectra of captured S. aureus on the Fe3O4@Ag-Van MNPs. The typical Raman peaks of S. aureus (108 cells/mL) at 624, 651, 732, 958, 1,323, and 1,465 cm−1 are seen clearly and in accordance with those in previous reports categorized in Table S1.51,52 The SERS signal becomes weak as the S. aureus concentration decreases. In addition, the major Raman peaks of S. aureus can be observed at the concentration of 106 cells/mL, as captured by the Fe3O4@Ag-Van MNPs. However, almost no characteristic vibrational bands were observed even at the bacterial concentration of 108 cells/mL mixed with Fe3O4@Ag and Fe3O4@Ag-MUA MNPs, which further indicated that these non-Van modified MNPs cannot effectively capture the bacteria. Moreover, by contrasting the intensities of the Raman signals observed in the control groups (a, b in Figure 3F) and the Fe3O4@Ag-Van MNPs with captured bacteria (d in Figure 3F), we can draw the conclusion that the modified vancomycin greatly facilitates enhancement of the Raman signals of bacteria.
The minimum limit of the Fe3O4@Ag-Van MNPs for S. aureus detection was also studied, and the results are shown in Figure S6. The SERS signal of S. aureus rapidly decreased as the concentration decreased and cannot be distinguished when the bacteria concentration is down to 105 cells/mL. Thus, the detection limit of the Fe3O4@Ag-Van MNPs for S. aureus was estimated to be 1×10⁵ cells/mL. Considering that large areas of bacteria surface do not contact with the Fe3O4@Ag-Van MNPs, the detection sensitivity can be greatly improved by using small enhanced NPs to further cover the naked surface of the bacteria to construct more hot spots.
Characterization of Au@Ag NPs
Previous studies showed that the plasmonic Au@Ag core–shell NPs perform better than common Au or Ag colloids in SERS characterization because of the electronic ligand effect and the localized electric field enhancement of the core–shell structures.53 Moreover, the Au@Ag NPs exhibit better uniformity to produce stable and producible SERS signals than Ag NPs.54 Considering these prominent advantages, we chose Au@Ag NPs as the secondary enhanced particles to further enhance the Raman signal of bacteria and improve the detection sensitivity in this work. The Au@Ag NPs were synthesized by in situ growth of Ag shells on the surface of Au cores (45 nm) as previously described.37 Figure 4A and B shows the TEM images of the Au cores and Au@Ag core–shell NPs, respectively. The sizes and shape of these NPs were relatively homogeneous, and their average particle size increased from 45 to ~60 nm. The HRTEM image of Au@Ag NPs (inset in Figure 4B) clearly shows that the Ag shell thickness was ~8 nm. In addition, the formation of Ag shell outside Au NPs was also confirmed by UV–vis spectroscopy (Figure 4C). For the 45 nm Au NP seed, the extinction peak occurs at the wavelength of 535 nm.55 After the Ag shell growth, this peak blue shifts at ~22 nm. Significantly, a new extinction peak of the Au@Ag NPs appears at 381 nm, indicating the formation of Ag shell on the Au cores.56 Figure 4D shows the SERS spectrum of the S. aureus solution (107 cells/mL) mixed with the two enhanced particles under the same conditions. Obviously, the Au@Ag NPs exhibit better enhancement ability than Au NPs.
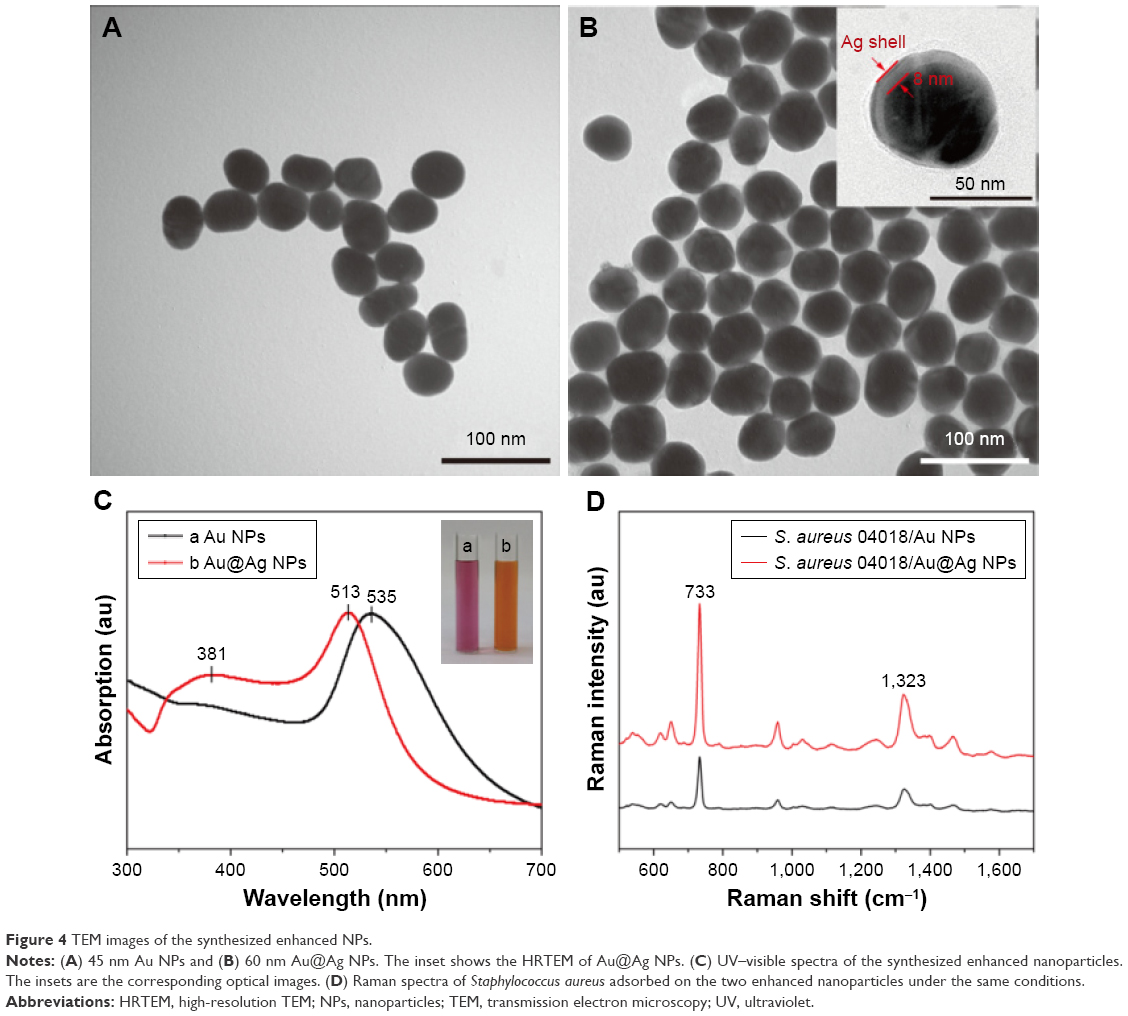 | Figure 4 TEM images of the synthesized enhanced NPs. |
SERS characterization of the combined system
As illustrated in Scheme 1, the combined system based on the combination of Fe3O4@Ag-Van MNPs and Au@Ag NPs included a simple two-step process performed in 1.5 mL plastic microtubes. First, the Fe3O4@Ag-Van MNPs were incubated with bacteria and shaken. During a 30 min incubation period, bacteria were bound to the vancomycin-modified Fe3O4@Ag MNPs. Then, the resulting Fe3O4@Ag-Van–bacteria complexes were magnetically separated and rinsed with PBS buffer to remove the impurity. Afterward, the Au@Ag NPs were spread as enhanced particles over the Fe3O4@Ag-Van–bacteria complexes and the measurement taken in situ. In this study, Au@Ag NPs were used as the secondary enhanced particles to further enhance the Raman signal of the bacteria. When spreading the Au@Ag NPs over the condensed Fe3O4@Ag-Van–bacteria complexes, these Au@Ag NPs could cover the unoccupied surfaces of bacteria and fill the gaps between the Fe3O4@Ag-Van MNPs and bacteria; moreover, lots of additional hot spots could be created under this operation. It is worth noting that nonuniform distribution of the colloids, after complete evaporation of the solvent, may seriously hurt the reproducibility and accuracy of the signal. To overcome this problem, concentrated Au@Ag NPs dissolved in ethanol were used. The particle concentration of the Au@Ag NPs has been optimized in our previous work, and 20-fold concentrated Au@Ag NPs have been proven to exhibit the best SERS activity.57 Figure 5A shows a typical SEM image of the concentrated Fe3O4@Ag-Van–S. aureus complexes on the Si substrate. Although many Fe3O4@Ag-Van MNPs tightly adhered to the bacterium, large cell surface areas were still exposed. After sprinkling the Au@Ag NPs into the concentrated complexes, most of the unoccupied surfaces of bacteria were covered with reinforced particles and the gaps between MNPs and bacteria were filled, thereby creating several additional hot spots for SERS sensing (Figure 5B). The SERS spectra for S. aureus label-free sensing conducted by combined use of the Fe3O4@Ag-Van MNPs and Au@Ag NPs are shown in Figure 5C. In addition, they display the typical SERS response of the combined system of different concentrations of bacteria. The SERS spectra of S. aureus agree well with those in previous reports.51,52 It is observed that the SERS signal becomes weak as the concentration of bacteria decreases. The strongest peak observed at 733 cm−1 can be distinguished even at a low concentration of 5×10² cells/mL. Moreover, the calibration curve was constructed by monitoring the SERS intensity of the main peak (733 cm−1) as a function of bacterial concentration. The logarithm of S. aureus bacteria concentrations (106–5×10² cells/mL) suggests that the low limit of detection of the combined system for S. aureus detection (5×10² cells/mL) lies within a large dynamic detection range (Figure S7). The homogeneity of SERS signals over Fe3O4@Ag-Van–S. aureus/Au@Ag complex substrate was also investigated (Figure 5D). Relatively uniform SERS spectra of S. aureus recorded from 20 randomly selected spots on the complexes were measurable with a relative standard deviation value of 10.3%, thus indicating the good reproducibility of the combined system. Notably, the reproducibility is better than that of conventional SERS strategies based on the simply mixing of Au or Ag NPs with bacteria.
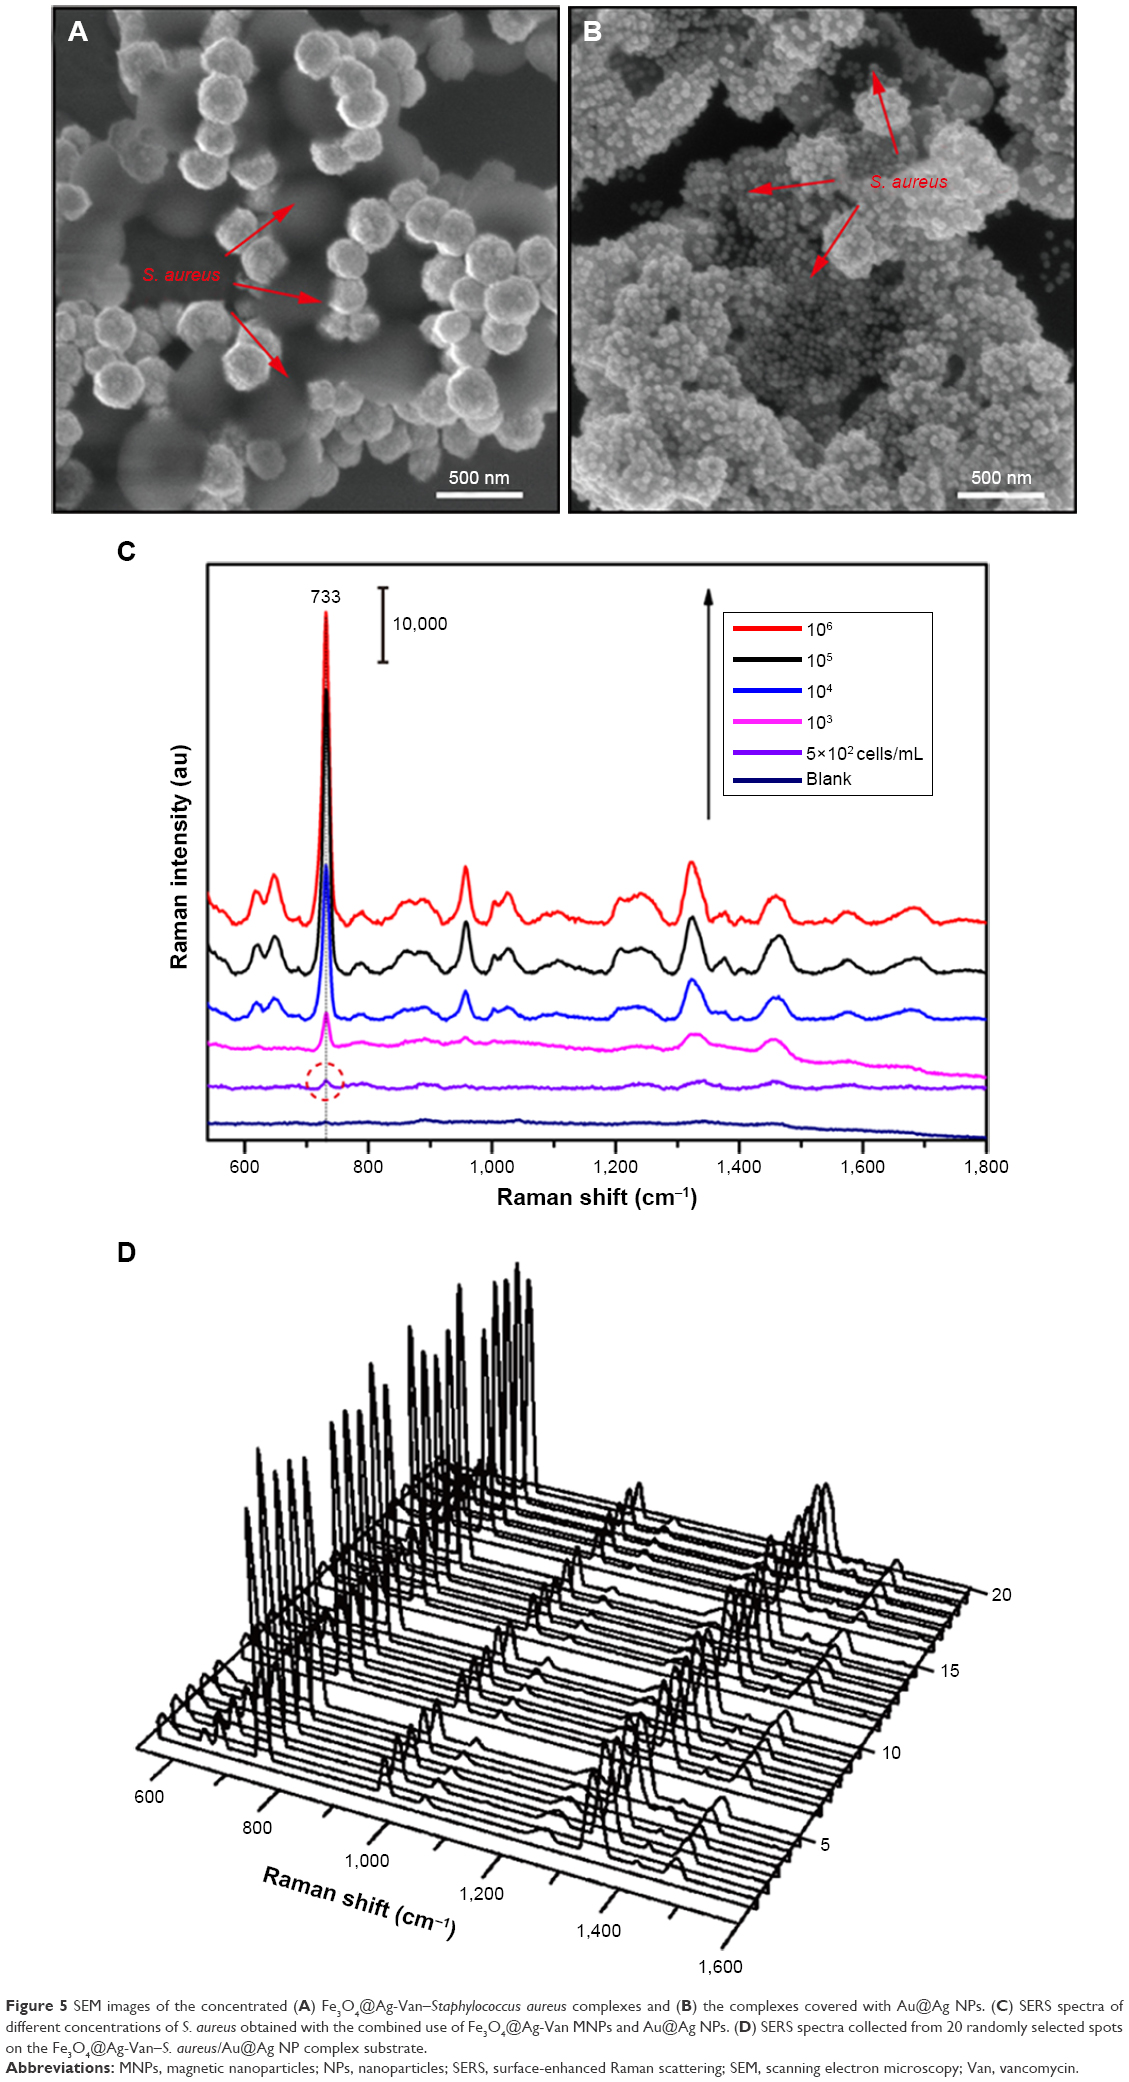 | Figure 5 SEM images of the concentrated (A) Fe3O4@Ag-Van–Staphylococcus aureus complexes and (B) the complexes covered with Au@Ag NPs. (C) SERS spectra of different concentrations of S. aureus obtained with the combined use of Fe3O4@Ag-Van MNPs and Au@Ag NPs. (D) SERS spectra collected from 20 randomly selected spots on the Fe3O4@Ag-Van–S. aureus/Au@Ag NP complex substrate. |
SERS detection and differentiation of bacteria by the combined system
Many studies have shown that vancomycin-modified NPs can interact strongly with a broad range of pathogenic bacteria (including both Gram-positive bacteria and -negative bacteria) and can be used as affinity probes to selectively trap these organisms.27,28,58 Therefore, the combined system, based on the vancomycin-modified Fe3O4@Ag MNPs, should be applied to detect various types of bacteria. We further evaluated the bacterial-sensing ability of our combined system on E. coli BL21 and MRSA as model Gram-negative and -positive bacteria, respectively. Both of these represent the leading multidrug-resistant bacterial pathogens. The SEM studies clearly show that the Fe3O4@Ag-Van MNPs can effectively capture both E. coli BL21 and MRSA from the solution (Figure 6A and C) and form stable complexes covered with Au@Ag NPs (Figure 6B and D). The SERS spectra of the E. coli BL21 and MRSA assays conducted using the combined system are shown in Figure S8, and the detection limits of these two pathogens are up to 5×10² cells/mL.
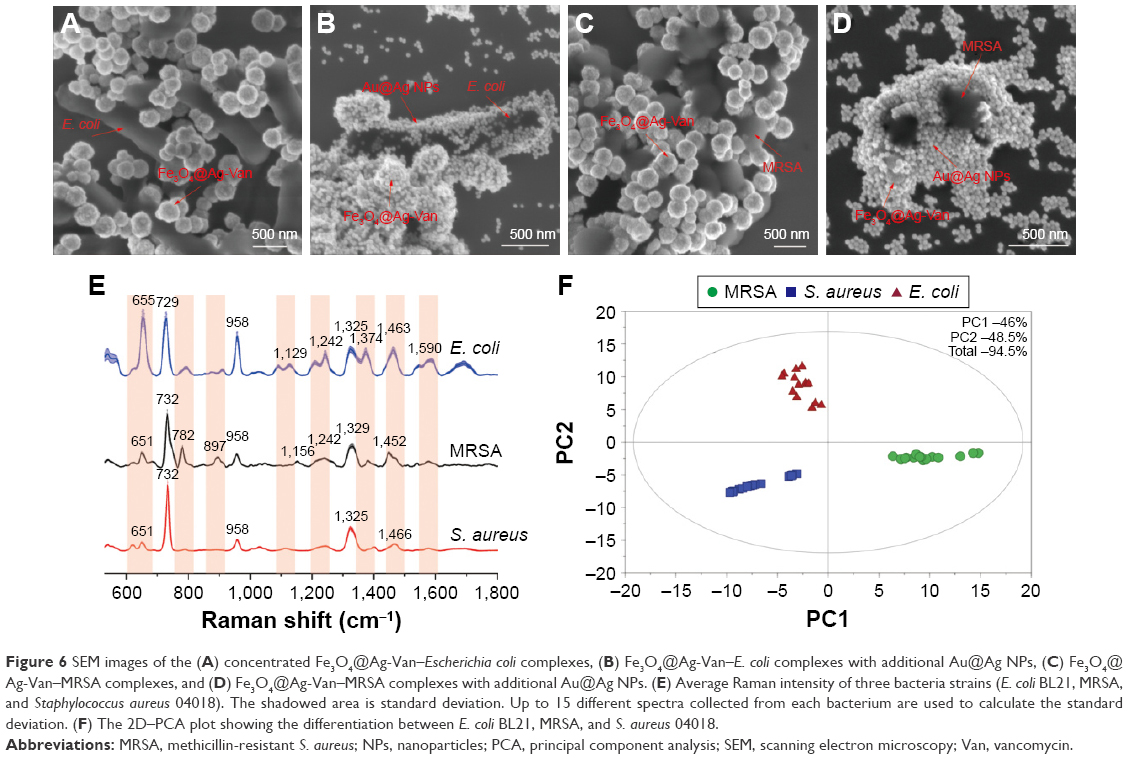 | Figure 6 SEM images of the (A) concentrated Fe3O4@Ag-Van–Escherichia coli complexes, (B) Fe3O4@Ag-Van–E. coli complexes with additional Au@Ag NPs, (C) Fe3O4@Ag-Van–MRSA complexes, and (D) Fe3O4@Ag-Van–MRSA complexes with additional Au@Ag NPs. (E) Average Raman intensity of three bacteria strains (E. coli BL21, MRSA, and Staphylococcus aureus 04018). The shadowed area is standard deviation. Up to 15 different spectra collected from each bacterium are used to calculate the standard deviation. (F) The 2D–PCA plot showing the differentiation between E. coli BL21, MRSA, and S. aureus 04018. |
A comparison between the spectra of three tested bacteria (S. aureus, E. coli, and MRSA) shows that they share some similar features. However, the relative intensities of the vibrational peaks significantly differ (Figure 6E). Each spectrum displayed in Figure 6E is an average of 15 spectra. Specifically, the differences in the bands near 651, 782, 1,242, 1,374, 1,452, and 1,590 cm−1 can be clearly distinguished. For example, one sharp Raman peak at ~1,374 cm−1 (υ[COO−] and δ[C−H] proteins) appears in the Raman spectrum of E. coli, but is not detectable in that of S. aureus and MRSA. Moreover, obvious Raman peaks at ~782 cm−1 (cytosine and thymine) and 1,156 cm−1 (ν[C−C] protein) can be observed only in the Raman spectrum of MRSA. These significant differences in the spectra indicate that our combined system features good capability for discriminating different types of pathogens, including drug-resistant bacteria. Previous works demonstrating the differences between Gram-negative and -positive bacterial pathogens that are reflected in their Raman spectra should be related back directly to their cell wall components.57 Thus, these differences make the overall vibrational signature of bacterial species unique that could be attributed to different biochemical compounds on the cell walls of different pathogens. This condition allows fingerprinting potential for bacterial strain identification purposes.
Principal component analysis (PCA) was performed to further differentiate the bacterial strains based on the SERS spectra, which can provide an accurate and intuitive view of the differences in fingerprint. The PCA was performed through Soft Independent Modeling of Class Analogy program on the developed PCA calibration model. The spectral data were preprocessed by removing the autofluorescence background and were smoothened and normalized by the integrated area under the curve. Figure 6F shows the PCA score plots of bacteria SERS spectra for E. coli BL21, S. aureus 04018, and MRSA samples. The model was generated using 45 spectra (15 each for different bacteria). The data points are clustered into three completely separated groups with no overlap, indicating that the SERS spectra of the three different types of bacteria samples can be clearly distinguished. These results proved that the proposed system combined with PCA analysis can be considered as a powerful tool to detect and classify different types of bacterial pathogens based on label-free SERS spectra.
As a real application of the combined system, we tested commercially obtained milk and blood samples spiked with bacteria. The bacterial strain E. coli BL21 was spiked into milk reaching a concentration of 105 cells/mL, and the same concentration of S. aureus 04018 was spiked in the mice blood. The vancomycin-modified Fe3O4@Ag MNPs were added in the prepared samples, allowed to react for 15 min, and then separated with a magnet (Figure 7A and C). The obtained precipitates were washed twice with deionized water to remove the impurities. The TEM images of Figure 7B and D clearly demonstrate that both E. coli and S. aureus can be effectively captured and are enriched by the Fe3O4@Ag-Van MNPs in the complex solutions (milk and blood). Then, the sensing procedure of bacteria detection is similar to the one described above. Distinct Raman spectra were observed for both E. coli and S. aureus with clear and specific fingerprint bands, which were almost the same as those of bacteria captured from water (Figure 7E and F). In contrast, the Raman spectra obtained from the Fe3O4@Ag-Van MNPs mixed with unspiked milk and blood (control group) exhibited no obviously vibrational signatures, thus suggesting that the impurities in complex solutions have little influence on the bacterial sensing results. These experimental results suggest the combined system can be extended to detection of a wide range of bacterial pathogens in real systems. Table 1 shows the characteristics of our combined SERS biosensor using vancomycin-modified Fe3O4@Ag MNPs and plasmonic Au@Ag NPs compared with other recently reported label-free SERS methods for bacteria detection. As can be seen from the table, our results are superior or equivalent to the results of other researchers.
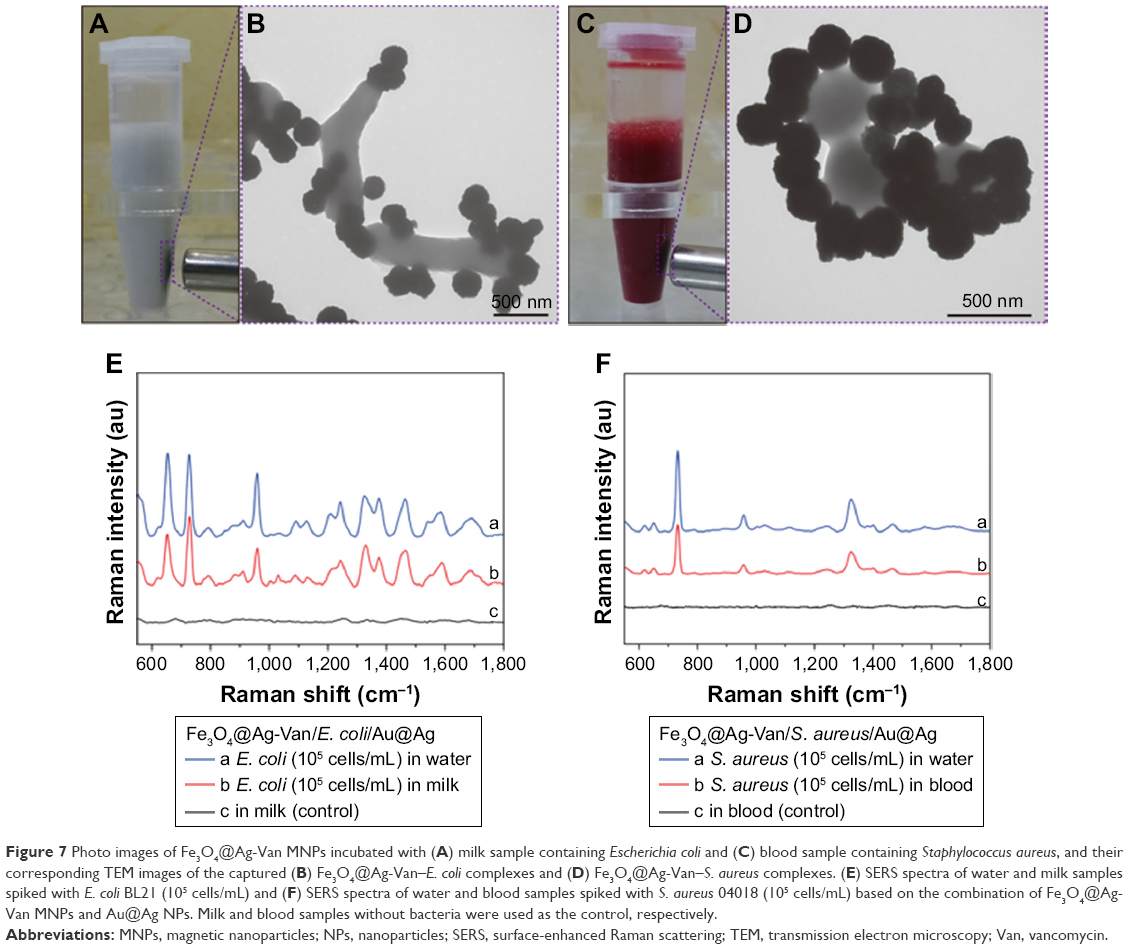 | Figure 7 Photo images of Fe3O4@Ag-Van MNPs incubated with (A) milk sample containing Escherichia coli and (C) blood sample containing Staphylococcus aureus, and their corresponding TEM images of the captured (B) Fe3O4@Ag-Van–E. coli complexes and (D) Fe3O4@Ag-Van–S. aureus complexes. (E) SERS spectra of water and milk samples spiked with E. coli BL21 (105 cells/mL) and (F) SERS spectra of water and blood samples spiked with S. aureus 04018 (105 cells/mL) based on the combination of Fe3O4@Ag-Van MNPs and Au@Ag NPs. Milk and blood samples without bacteria were used as the control, respectively. |
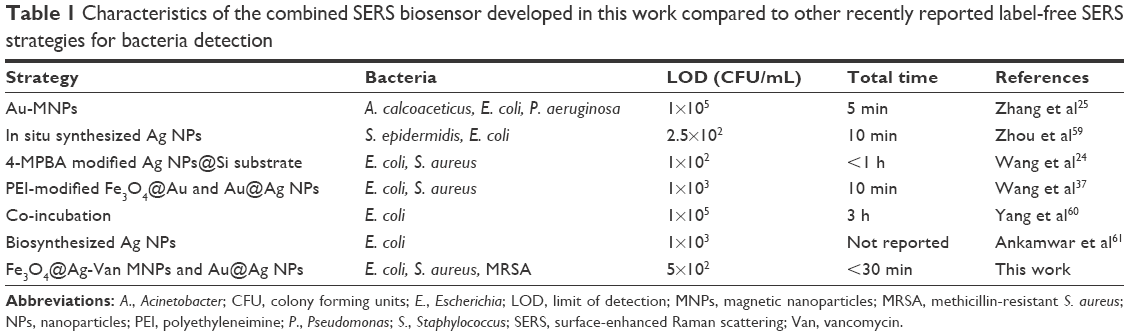 | Table 1 Characteristics of the combined SERS biosensor developed in this work compared to other recently reported label-free SERS strategies for bacteria detection |
Conclusion
In this work, we presented a type of efficient SERS biosensor based on the combination of vancomycin-modified Fe3O4@Ag MNPs and Au@Ag NPs for rapid enrichment, sensitive detection, and accurate differentiation of bacteria. Vancomycin, which exhibits strong affinity with a broad range of Gram-positive and Gram-negative bacteria, was adopted as the biorecognition molecule for bacterial detection. High-performance Fe3O4@Ag MNPs were functionalized with vancomycin to effectively capture and enrich bacteria in solution samples. In addition, the plasmonic Au@Ag NPs were used as the secondary enhanced particles to improve the detection sensitivity, resulting in high-density hot spots on the bacteria cell, formed by the closely packed SERS particles. Given these outstanding features, the combined system is expected to be a sensitive SERS biosensor in detecting a wide range of pathogenic bacteria, as verified by its detection of the Gram-positive bacterium E. coli, Gram-positive bacterium S. aureus, and drug-resistant bacteria MRSA at a detection limit as low as 5×10² cells/mL. Moreover, the strong and reproducible SERS spectra of bacteria allow accurate differentiation of different bacteria using PCA method. Further considering the ease of preparation and low cost, we expect that the combined system has great potential as a potent tool in detection of pathogens in environmental and clinical samples.
Acknowledgments
This work was supported by grants from the National Natural Science Foundation of China (numbers 81230089 and 51605486) and the Beijing Municipal Science & and Technology Commission (number Z161100000116040).
Disclosure
The authors report no conflicts of interest in this work.
References
Berendonk TU, Manaia CM, Merlin C, et al. Tackling antibiotic resistance: the environmental framework. Nat Rev Microbiol. 2015;13(5):310–317. | ||
Madiyar FR, Bhana S, Swisher LZ, Culbertson CT, Huang X, Li J. Integration of a nanostructured dielectrophoretic device and a surface-enhanced Raman probe for highly sensitive rapid bacteria detection. Nanoscale. 2015;7(8):3726–3736. | ||
Khan AA, Khan A, Rahman MM, Asiri AM, Oves M. Sensor development of 1,2 Dichlorobenzene based on polypyrole/Cu-doped ZnO (PPY/CZO) nanocomposite embedded silver electrode and their antimicrobial studies. Int J Biol Macromol. 2017;98:256–267. | ||
Sun W, Weingarten RA, Xu M, et al. Rapid antimicrobial susceptibility test for identification of new therapeutics and drug combinations against multidrug-resistant bacteria. Emerg Microbes Infect. 2016;5(11):e116. | ||
Liu F, Liu H, Liao Y, Wei J, Zhou X, Xing D. Multiplex detection and genotyping of pathogenic bacteria on paper-based biosensor with a novel universal primer mediated asymmetric PCR. Biosens Bioelectron. 2015;74:778–785. | ||
Kunze A, Dilcher M, Abd El Wahed A, Hufert F, Niessner R, Seidel M. On-chip isothermal nucleic acid amplification on flow-based chemiluminescence microarray analysis platform for the detection of viruses and bacteria. Anal Chem. 2016;88(1):898–905. | ||
Loman NJ, Pallen MJ. Twenty years of bacterial genome sequencing. Nat Rev Microbiol. 2015;13(12):787–794. | ||
Chen R, Huang X, Xu H, Xiong Y, Li Y. Plasmonic enzyme-linked immunosorbent assay using nanospherical brushes as a catalase container for colorimetric detection of ultralow concentrations of listeria monocytogenes. ACS Appl Mater Interfaces. 2015;7(51):28632–28639. | ||
Sheikhzadeh E, Chamsaz M, Turner AP, Jager EW, Beni V. Label-free impedimetric biosensor for Salmonella Typhimurium detection based on poly [pyrrole-co-3-carboxyl-pyrrole] copolymer supported aptamer. Biosen Bioelectron. 2016;80:194–200. | ||
Kim YT, Chen Y, Choi JY, et al. Integrated microdevice of reverse transcription-polymerase chain reaction with colorimetric immunochromatographic detection for rapid gene expression analysis of influenza A H1N1 virus. Biosens Bioelectron. 2012;33(1):88–94. | ||
Pahlow S, Meisel S, Cialla-May D, Weber K, Rosch P, Popp J. Isolation and identification of bacteria by means of Raman spectroscopy. Adv Drug Deliv Rev. 2015;89:105–120. | ||
Wang H, Jiang X, He Y. Highly sensitive and reproducible silicon-based surface-enhanced Raman scattering sensors for real applications. Analyst. 2016;141(17):5010–5019. | ||
Liu Y, Zhou H, Hu Z, Yu G, Yang D, Zhao J. Label and label-free based surface-enhanced Raman scattering for pathogen bacteria detection: a review. Biosens Bioelectron. 2017;94:131–140. | ||
Yan Y, Su S, He S, et al. Nano rolling-circle amplification for enhanced SERS hot spots in protein microarray analysis. Anal Chem. 2012;84(21):9139–9145. | ||
Li CY, Yang ZW, Dong JC, Ganguly T, Li JF. Plasmon-enhanced spectroscopies with shell-isolated nanoparticles. Small. 2017;13(8):1601598. | ||
Chen N, Rong M, Shao X, et al. Surface-enhanced Raman spectroscopy of serum accurately detects prostate cancer in patients with prostate-specific antigen levels of 4–10 ng/mL. Int J Nanomed. 2017;12:5399–5407. | ||
D’Hollander A, Mathieu E, Jans H, et al. Development of nanostars as a biocompatible tumor contrast agent: toward in vivo SERS imaging. Int J Nanomed. 2016;11:3703–3714. | ||
Li JF, Huang YF, Ding Y, et al. Shell-isolated nanoparticle-enhanced Raman spectroscopy. Nature. 2010;464(7287):392–395. | ||
Li CY, Meng M, Huang SC, et al. “Smart” Ag nanostructures for plasmon-enhanced spectroscopies. J Am Chem Soc. 2015;137(43):13784–13787. | ||
Xu JJ, Zhao WW, Song S, Fan C, Chen HY. Functional nanoprobes for ultrasensitive detection of biomolecules: an update. Chem Soc Rev. 2014;43(5):1601–1611. | ||
Qiu X, You X, Chen X, et al. Development of graphene oxide-wrapped gold nanorods as robust nanoplatform for ultrafast near-infrared SERS bioimaging. Int J Nanomed. 2017;12:4349–4360. | ||
Zhou H, Yang D, Ivleva NP, et al. Label-free in situ discrimination of live and dead bacteria by surface-enhanced Raman scattering. Anal Chem. 2015;87(13):6553–6561. | ||
Han X, Wang H, Ou X, Zhang X. Highly sensitive, reproducible, and stable SERS sensors based on well-controlled silver nanoparticle-decorated silicon nanowire building blocks. J Mater Chem. 2012;22:14127–14132. | ||
Wang H, Zhou Y, Jiang X, et al. Simultaneous capture, detection, and inactivation of bacteria as enabled by a surface-enhanced Raman scattering multifunctional chip. Angew Chemie Int Ed Engl. 2015;54(17):5132–5136. | ||
Zhang L, Xu J, Mi L, Gong H, Jiang S, Yu Q. Multifunctional magnetic-plasmonic nanoparticles for fast concentration and sensitive detection of bacteria using SERS. Biosens Bioelectron. 2012;31(1):130–136. | ||
Yang S, Ouyang H, Su X, et al. Dual-recognition detection of Staphylococcus aureus using vancomycin-functionalized magnetic beads as concentration carriers. Biosens Bioelectron. 2016;78:174–180. | ||
Lai BH, Chen DH. Vancomycin-modified LaB6@SiO2/Fe3O4 composite nanoparticles for near-infrared photothermal ablation of bacteria. Acta Biomater. 2013;9(7):7573–7579. | ||
Kell AJ, Stewart G, Ryan S, et al. Vancomycin-modified nanoparticles for efficient targeting and preconcentration of gram-positive and gram-negative bacteria. ACS Nano. 2008;2(9):1777–1788. | ||
Liu TY, Tsai KT, Wang HH, et al. Functionalized arrays of Raman-enhancing nanoparticles for capture and culture-free analysis of bacteria in human blood. Nat Commun. 2011;2:538. | ||
Wu X, Xu C, Tripp RA, Huang YW, Zhao Y. Detection and differentiation of foodborne pathogenic bacteria in mung bean sprouts using field deployable label-free SERS devices. Analyst. 2013;138(10):3005–3012. | ||
Sivanesan A, Witkowska E, Adamkiewicz W, Dziewit Ł, Kamińska A, Waluk J. Nanostructured silver-gold bimetallic SERS substrates for selective identification of bacteria in human blood. Analyst. 2014;139(5):1037–1043. | ||
Wu X, Huang YW, Park B, Tripp RA, Zhao Y. Differentiation and classification of bacteria using vancomycin functionalized silver nanorods array based surface-enhanced Raman spectroscopy and chemometric analysis. Talanta. 2015;139:96–103. | ||
Wang C, Xu J, Wang J, et al. Polyethylenimine-interlayered silver-shell magnetic-core microspheres as multifunctional SERS substrates. J Mater Chem C. 2015;3:8684–8693. | ||
Wang C, Li P, Wang J, et al. Polyethylenimine-interlayered core-shell-satellite 3D magnetic microspheres as versatile SERS substrates. Nanoscale. 2015;7(44):18694–18707. | ||
Wang C, Xu S, Zhang K, et al. Streptomycin-modified Fe3O4–Au@Ag core–satellite magnetic nanoparticles as an effective antibacterial agent. J Materi Sci. 2017;52(3):1357–1368. | ||
Li JF, Tian XD, Li SB, et al. Surface analysis using shell-isolated nanoparticle-enhanced Raman spectroscopy. Nature protocols. 2013;8(1):52–65. | ||
Wang C, Wang J, Li M, et al. A rapid SERS method for label-free bacteria detection using polyethylenimine-modified Au-coated magnetic microspheres and Au@Ag nanoparticles. Analyst. 2016;141(22):6226–6238. | ||
Wang H, Guo X, Fu S, Yang T, Wen Y, Yang H. Optimized core-shell Au@Ag nanoparticles for label-free Raman determination of trace Rhodamine B with cancer risk in food product. Food Chem. 2015;188:137–142. | ||
Wang J, Wu X, Wang C, et al. Magnetically assisted surface-enhanced Raman spectroscopy for the detection of staphylococcus aureus based on Aptamer Recognition. ACS Appl Mater Interfaces. 2015;7(37):20919–20929. | ||
Yoo JH, Woo DH, Chang MS, Chun MS. Microfluidic based biosensing for Escherichia coli detection by embedding antimicrobial peptide-labeled beads. Sensors Actuators B Chem. 2014;191:211–218. | ||
Wang J, Wu X, Wang C, et al. Facile Synthesis of Au-Coated Magnetic Nanoparticles and Their Application in Bacteria Detection via a SERS Method. ACS Appl Mater Interfaces. 2016;8(31):19958–19967. | ||
Sun W, Yang W, Xu Z, Li Q, Shang JK. Synthesis of Superparamagnetic Core-Shell Structure Supported Pd Nanocatalysts for Catalytic Nitrite Reduction with Enhanced Activity, No Detection of Undesirable Product of Ammonium, and Easy Magnetic Separation Capability. ACS Appl Mater Interfaces. 2016;8(3):2035–2047. | ||
Xie Y, Yan B, Xu H, et al. Highly regenerable mussel-inspired Fe(3)O(4)@polydopamine-Ag core-shell microspheres as catalyst and adsorbent for methylene blue removal. ACS Appl Mater Interfaces. 2014;6(11):8845–8852. | ||
Mir-Simon B, Reche-Perez I, Guerrini L, Pazos-Perez N, Alvarez-Puebla RA. Universal one-pot and scalable synthesis of SERS encoded nanoparticles. Chem Mater. 2015;27(3):950–958. | ||
Wang C, Wang J, Li P, et al. Sonochemical synthesis of highly branched flower-like Fe3O4@SiO2@Ag microcomposites and their application as versatile SERS substrates. Nanoscale. 2016;8:19816–19828. | ||
Liu H, Yang Z, Meng L, et al. Three-dimensional and time-ordered surface-enhanced Raman scattering hotspot matrix. J Am Chem Soc. 2014;136(14):5332–5341. | ||
Su J, Wang D, Norbel L, et al. Multicolor Gold-Silver Nano-Mushrooms as Ready-to-Use SERS Probes for Ultrasensitive and Multiplex DNA/miRNA Detection. Anal Chem. 2017;89(4):2531–2538. | ||
Wu DY, Zhao LB, Liu XM, et al. Photon-driven charge transfer and photocatalysis of p-aminothiophenol in metal nanogaps: a DFT study of SERS. Chem Commun (Camb). 2011;47(9):2520–2522. | ||
Wu DY, Liu XM, Huang YF, Ren B, Xu X, Tian ZQ. Surface Catalytic Coupling Reaction of p-Mercaptoaniline Linking to Silver Nanostructures Responsible for Abnormal SERS Enhancement: a DFT Study. J Phys Chem C. 2009;113(42):18212–18222. | ||
Huang YF, Wang YF, Yan XP. Amine-Functionalized magnetic nanoparticles for rapid capture and removal of bacterial pathogens. Environ Sci Technol. 2010;44(20):7908–7913. | ||
Chu H, Huang Y, Zhao Y. Silver nanorod arrays as a surface-enhanced Raman scattering substrate for foodborne pathogenic bacteria detection. Appl Spectrosc. 2008;62(8):922–931. | ||
Kahraman M, Keseroglu K, Culha M. On sample preparation for surface-enhanced raman scattering (SERS) of bacteria and the source of spectral features of the spectra. Appl Spectrosc. 2011;65(5):500–506. | ||
Liu B, Han G, Zhang Z, et al. Shell thickness-dependent Raman enhancement for rapid identification and detection of pesticide residues at fruit peels. Anal Chem. 2012;84(1):255–261. | ||
Wang C, Wu X, Dong P, Chen J, Xiao R. Hotspots engineering by grafting Au@Ag core-shell nanoparticles on the Au film over slightly etched nanoparticles substrate for on-site paraquat sensing. Biosens Bioelectron. 2016;86:944–950. | ||
Zhao B, Shen J, Chen S, et al. Gold nanostructures encoded by non-fluorescent small molecules in polyA-mediated nanogaps as universal SERS nanotags for recognizing various bioactive molecules. Chem Sci. 2014;5:4460–4466. | ||
Olson TY, Schwartzberg AM, Orme CA, Talley CE, O’Connell B, Zhang JZ. Hollow Gold-Silver Double-Shell Nanospheres: structure, Optical Absorption, and Surface-Enhanced Raman Scattering. J Phys Chem. 2008;112(16):6319–6329. | ||
Lin CC, Lin CY, Kao CJ, Hung CH. High efficiency SERS detection of clinical microorganism by AgNPs-decorated filter membrane and pattern recognition techniques. Sensors Actuators B Chem. 2017;241:513–521. | ||
Zhu M, Liu W, Liu H, et al. Construction of Fe3O4/Vancomycin/PEG Magnetic Nanocarrier for Highly Efficient Pathogen Enrichment and Gene Sensing. ACS Appl Mater Interfaces. 2015;7(23):12873–12881. | ||
Zhou H, Yang D, Ivleva NP, Mircescu NE, Niessner R, Haisch C. SERS detection of bacteria in water by in situ coating with Ag nanoparticles. Anal Chem. 2014;86(3):1525–1533. | ||
Yang D, Zhou H, Haisch C, Niessner R, Ying Y. Reproducible E. coli detection based on label-free SERS and mapping. Talanta. 2016;146:457–463. | ||
Ankamwar B, Sur UK, Das P. SERS study of bacteria using biosynthesized silver nanoparticles as the SERS substrate. Anal Methods. 2016;8:2335–2340. |
Supplementary materials
Enhancement factor (EF) calculation
To quantify the enhancement ability of the vancomycin-modified Fe3O4@Ag magnetic nanoparticles (MNPs), the EF was calculated as the ratio of photons scattered by the surface-enhanced Raman scattering (SERS) substrate and the normal substrate. EF was estimated according to the reliable calculation through the general formula:
|
|
where NSurf is the average number of p-aminothiophenol (PATP) molecules contributing to the SERS signal, NVol is the average number of PATP molecules contributing to the normal Raman signal, and ISERS and IRS are the intensities of the scattering band of interest in the SERS and normal Raman spectra, respectively. However, intrinsic EF is difficult to estimate because several variables, such as adsorbed molecules and laser scattering volume, are difficult to obtain. In our experiment, all the other parameters, including the laser diameter, laser power, exposure time, and microscopic magnification, were identical. The chemical droplets were of the same volume, and the number of detected PATP molecules was proportional to its concentration. Therefore, the EF was roughly estimated by comparing the intensity of the Raman peak in the SERS spectrum with that in the normal Raman spectrum according to the equation
|
|
where ISERS and IRS are the vibration intensities in the SERS and normal Raman spectra of PATP molecules, respectively, and CRS and CSERS are the concentrations of the PATP molecules in the SERS and reference samples, respectively. The main peak at 1,077 cm−1 from the PATP Raman spectrum (Figure S2) was chosen for analysis, and the intensities for peaks (blue line and red line) were 1,306 and 20,996 au, respectively. The PATP concentrations for peaks (blue line and red line) were 10−1 M and 10−5 M, respectively. Therefore, the EF of the Fe3O4@Ag-Van MNPs was roughly estimated to be 1.61×10⁵.
 | Figure S1 The detailed Fe3O4@Ag MNPs synthesis procedure. |
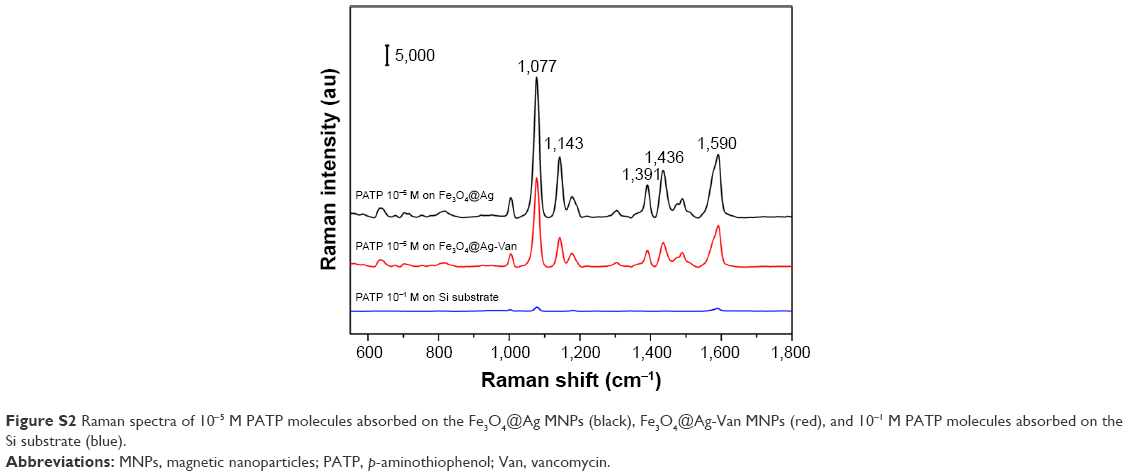 | Figure S2 Raman spectra of 10−5 M PATP molecules absorbed on the Fe3O4@Ag MNPs (black), Fe3O4@Ag-Van MNPs (red), and 10−1 M PATP molecules absorbed on the Si substrate (blue). |
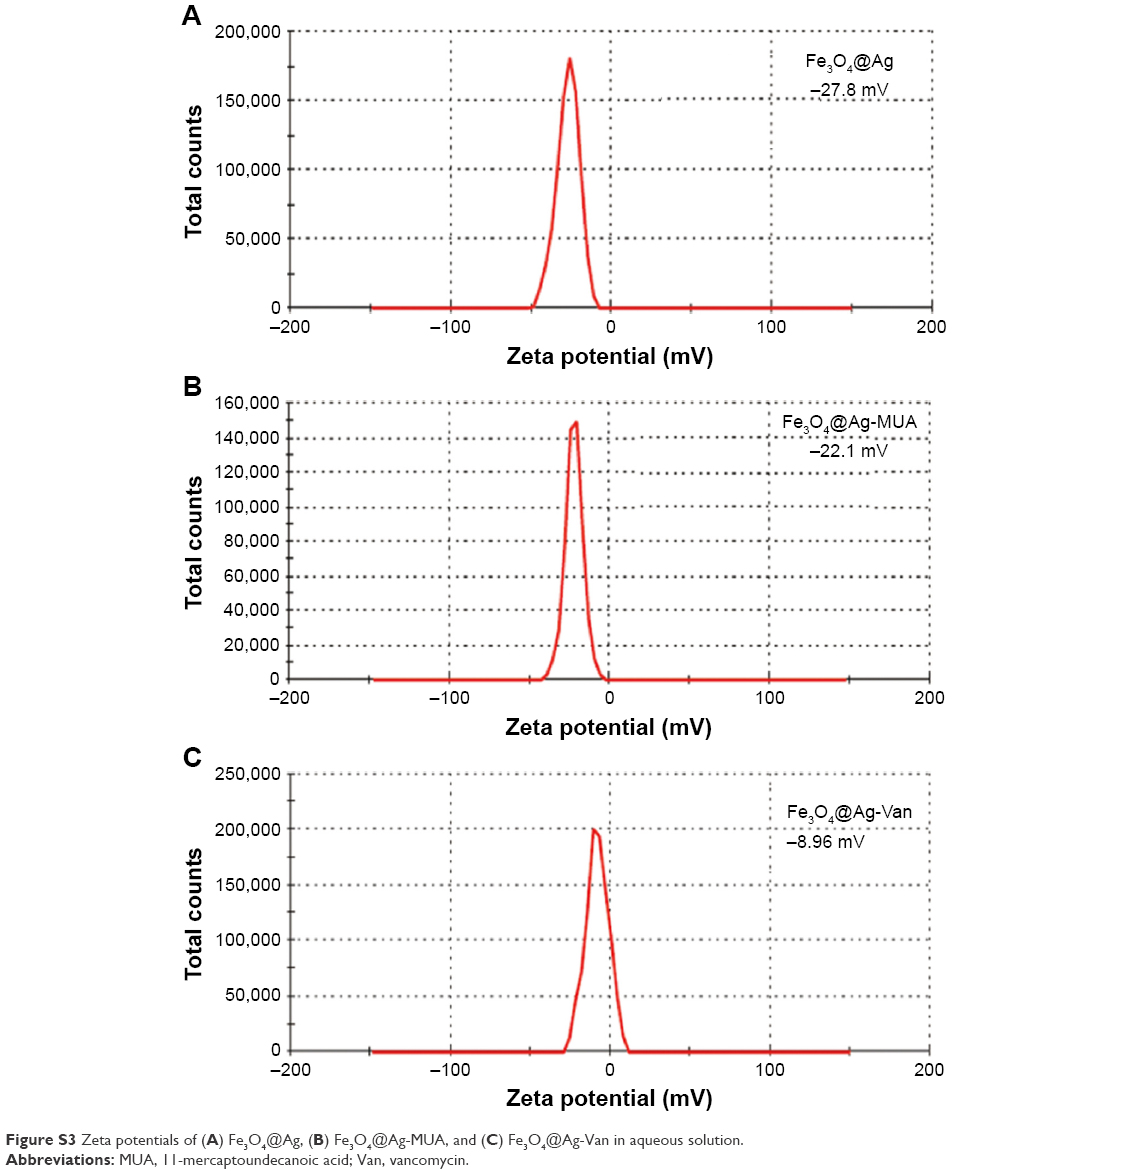 | Figure S3 Zeta potentials of (A) Fe3O4@Ag, (B) Fe3O4@Ag-MUA, and (C) Fe3O4@Ag-Van in aqueous solution. |
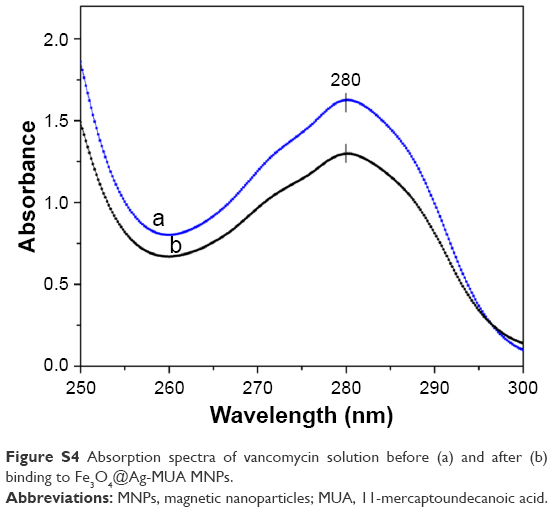 | Figure S4 Absorption spectra of vancomycin solution before (a) and after (b) binding to Fe3O4@Ag-MUA MNPs. |
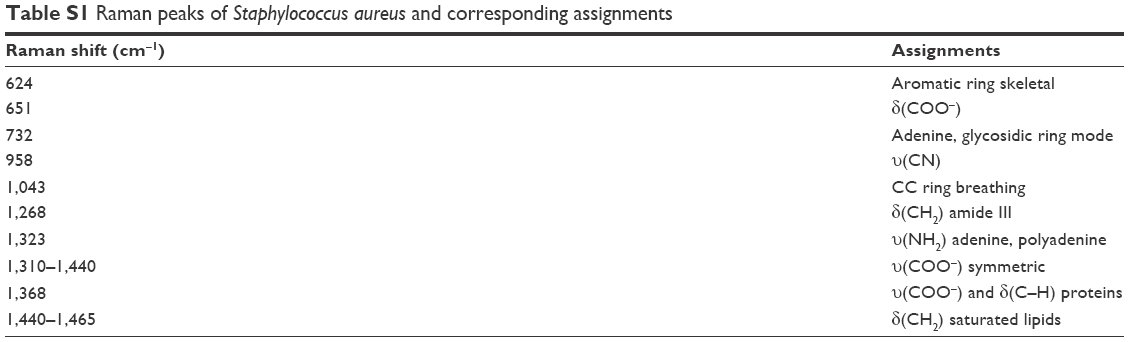 | Table S1 Raman peaks of Staphylococcus aureus and corresponding assignments |
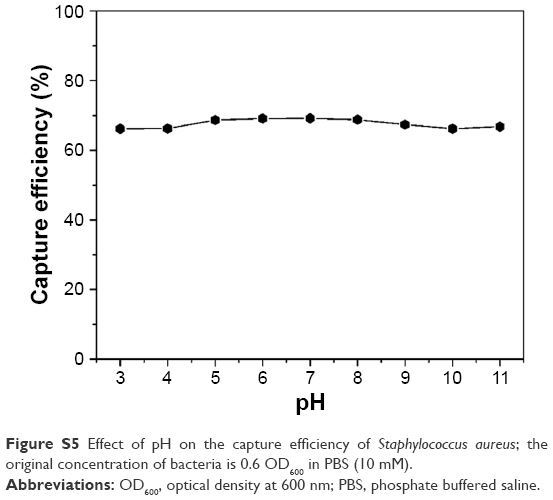 | Figure S5 Effect of pH on the capture efficiency of Staphylococcus aureus; the original concentration of bacteria is 0.6 OD600 in PBS (10 mM). |
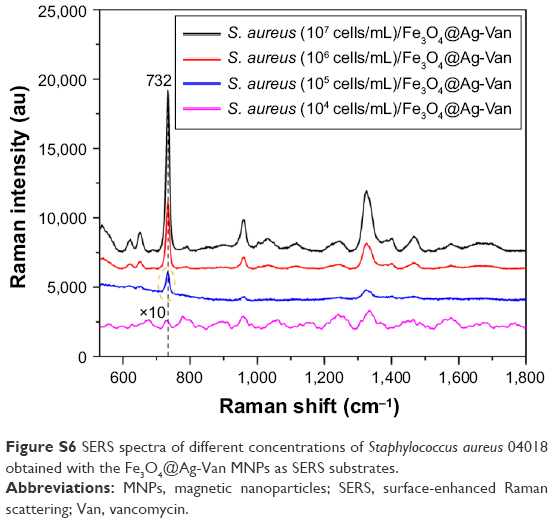 | Figure S6 SERS spectra of different concentrations of Staphylococcus aureus 04018 obtained with the Fe3O4@Ag-Van MNPs as SERS substrates. |
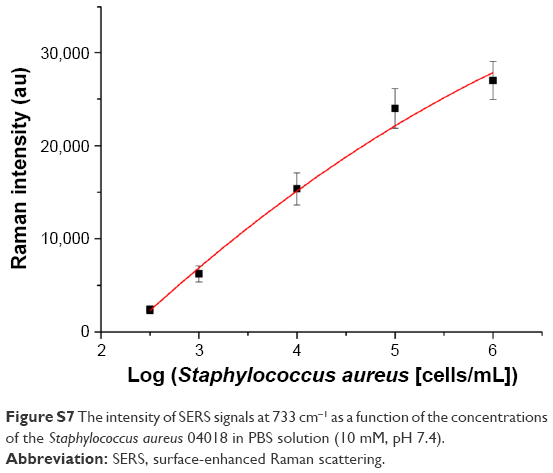 | Figure S7 The intensity of SERS signals at 733 cm−1 as a function of the concentrations of the Staphylococcus aureus 04018 in PBS solution (10 mM, pH 7.4). |
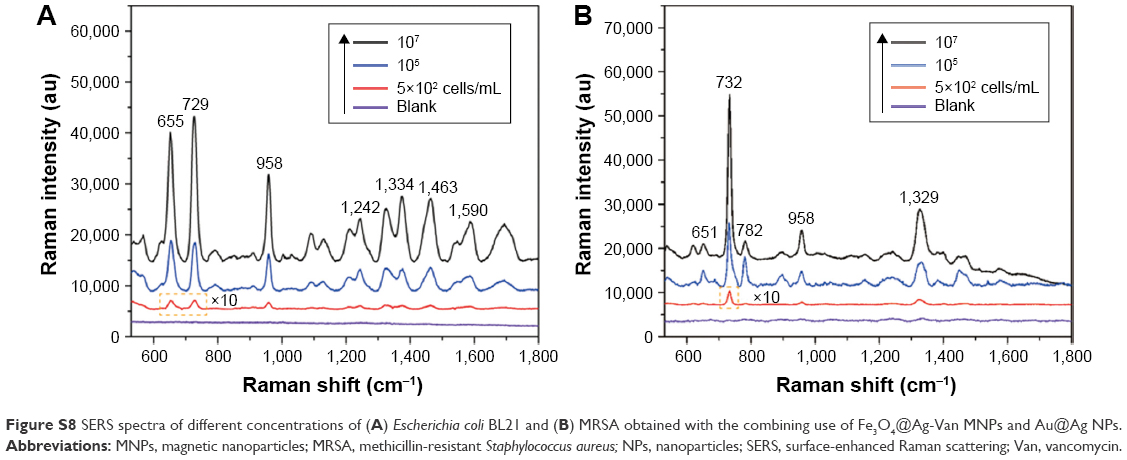 | Figure S8 SERS spectra of different concentrations of (A) Escherichia coli BL21 and (B) MRSA obtained with the combining use of Fe3O4@Ag-Van MNPs and Au@Ag NPs. |
 © 2018 The Author(s). This work is published and licensed by Dove Medical Press Limited. The
full terms of this license are available at https://www.dovepress.com/terms
and incorporate the Creative Commons Attribution
- Non Commercial (unported, 3.0) License.
By accessing the work you hereby accept the Terms. Non-commercial uses of the work are permitted
without any further permission from Dove Medical Press Limited, provided the work is properly
attributed. For permission for commercial use of this work, please see paragraphs 4.2 and 5 of our Terms.
© 2018 The Author(s). This work is published and licensed by Dove Medical Press Limited. The
full terms of this license are available at https://www.dovepress.com/terms
and incorporate the Creative Commons Attribution
- Non Commercial (unported, 3.0) License.
By accessing the work you hereby accept the Terms. Non-commercial uses of the work are permitted
without any further permission from Dove Medical Press Limited, provided the work is properly
attributed. For permission for commercial use of this work, please see paragraphs 4.2 and 5 of our Terms.