Back to Journals » Medical Devices: Evidence and Research » Volume 10
Can machine learning complement traditional medical device surveillance? A case-study of dual-chamber implantable cardioverter–defibrillators
Authors Ross JS ![]() , Bates J, Parzynski CS, Akar JG, Curtis JP, Desai NR, Freeman JV, Gamble GM, Kuntz R, Li SX, Marinac-Dabic D, Masoudi FA, Normand SLT, Ranasinghe I, Shaw RE, Krumholz HM
, Bates J, Parzynski CS, Akar JG, Curtis JP, Desai NR, Freeman JV, Gamble GM, Kuntz R, Li SX, Marinac-Dabic D, Masoudi FA, Normand SLT, Ranasinghe I, Shaw RE, Krumholz HM
Received 28 March 2017
Accepted for publication 25 May 2017
Published 16 August 2017 Volume 2017:10 Pages 165—188
DOI https://doi.org/10.2147/MDER.S138158
Checked for plagiarism Yes
Review by Single anonymous peer review
Peer reviewer comments 2
Editor who approved publication: Dr Scott Fraser
Joseph S Ross,1–4 Jonathan Bates,4 Craig S Parzynski,4 Joseph G Akar,4,5 Jeptha P Curtis,4,5 Nihar R Desai,4,5 James V Freeman,4,5 Ginger M Gamble,4 Richard Kuntz,6 Shu-Xia Li,4 Danica Marinac-Dabic,7 Frederick A Masoudi,8 Sharon-Lise T Normand,9,10 Isuru Ranasinghe,11 Richard E Shaw,12 Harlan M Krumholz2–5
1Section of General Medicine, Department of Medicine, 2Robert Wood Johnson Foundation Clinical Scholars Program, Yale School of Medicine, 3Department of Health Policy and Management, Yale School of Public Health, 4Center for Outcomes Research and Evaluation, Yale–New Haven Hospital, 5Section of Cardiovascular Medicine, Department of Medicine, Yale School of Medicine, New Haven, CT, 6Medtronic Inc, Minneapolis, MN, 7Division of Epidemiology, Center for Devices and Radiological Health, US Food and Drug Administration, Silver Spring, MD, 8Division of Cardiology, Department of Medicine, University of Colorado, Aurora, CO, 9Department of Health Care Policy, Harvard Medical School, 10Department of Biostatistics, Harvard TH Chan School of Public Health, Boston, MA, USA; 11Discipline of Medicine, University of Adelaide, Adelaide, SA, Australia; 12Department of Clinical Informatics, California Pacific Medical Center, San Francisco, CA, USA
Background: Machine learning methods may complement traditional analytic methods for medical device surveillance.
Methods and results: Using data from the National Cardiovascular Data Registry for implantable cardioverter–defibrillators (ICDs) linked to Medicare administrative claims for longitudinal follow-up, we applied three statistical approaches to safety-signal detection for commonly used dual-chamber ICDs that used two propensity score (PS) models: one specified by subject-matter experts (PS-SME), and the other one by machine learning-based selection (PS-ML). The first approach used PS-SME and cumulative incidence (time-to-event), the second approach used PS-SME and cumulative risk (Data Extraction and Longitudinal Trend Analysis [DELTA]), and the third approach used PS-ML and cumulative risk (embedded feature selection). Safety-signal surveillance was conducted for eleven dual-chamber ICD models implanted at least 2,000 times over 3 years. Between 2006 and 2010, there were 71,948 Medicare fee-for-service beneficiaries who received dual-chamber ICDs. Cumulative device-specific unadjusted 3-year event rates varied for three surveyed safety signals: death from any cause, 12.8%–20.9%; nonfatal ICD-related adverse events, 19.3%–26.3%; and death from any cause or nonfatal ICD-related adverse event, 27.1%–37.6%. Agreement among safety signals detected/not detected between the time-to-event and DELTA approaches was 90.9% (360 of 396, k=0.068), between the time-to-event and embedded feature-selection approaches was 91.7% (363 of 396, k=–0.028), and between the DELTA and embedded feature selection approaches was 88.1% (349 of 396, k=–0.042).
Conclusion: Three statistical approaches, including one machine learning method, identified important safety signals, but without exact agreement. Ensemble methods may be needed to detect all safety signals for further evaluation during medical device surveillance.
Keywords: implanted cardioverter–defibrillator, methodology, surveillance
Introduction
Implantable cardioverter–defibrillators (ICDs) may be indicated for survivors of cardiac arrest or those who have experienced prior sustained ventricular arrhythmias, and as primary prophylaxis for patients with heart failure and other conditions according to current guidelines.1–4 While ICD therapy has been associated with lower all-cause mortality,5 implantation also involves risk. Approximately 1% of ICD implantation procedures are associated with in-hospital death, and at least 5% of patients experience other complications, including device malfunctions, lead problems, and infections.5–7 Data from the American College of Cardiology’s National Cardiovascular Data Registry (NCDR) demonstrated that 1% of patients experience pneumothorax or hematoma formation within 30 days, and 3% have a site infection or require ICD revision because of a mechanical complication within 90 days.6
However, for nearly all high-risk medical devices, including ICDs, long-term device safety, product performance, and effectiveness in improving patient outcomes are not well defined.8 Current medical device surveillance efforts to address these issues include mandatory reporting of certain device-related adverse events and miscellaneous product problems to the US Food and Drug Administration (FDA) Manufacturer and User Facility Device Experience program, the hospital-based Medical Product Safety Network, and required postmarket surveillance studies. Although each has well-described limitations,9–12 data from these sources have contributed unique insights that have helped to inform patient and physician decision-making and improve quality of care. In particular, required studies and registries offer an opportunity to collect detailed information about patients, procedures, and devices not routinely collected by electronic health records or administrative claims data.
Importantly, the methods used to analyze data collected as part of medical device surveillance efforts have implications for the success of these efforts, and there are limitations to the traditional approaches used to analyze registry data. First, evaluations usually focus on overall product-class safety and effectiveness, rather than examining differences across manufacturers. Second, many analyses are cross-sectional and do not take time into account. However, device performance and safety are likely influenced by operator performance, which may improve with experience over time.13,14 Finally, risk-standardization methods used to examine and compare device performance tend to focus on patient characteristics that are prespecified to be “clinically important”, such as through propensity-matched time-to-event analyses to compare device safety and performance. However, the characteristics that most affect device use and performance are often not well understood,15,16 and these methods take advantage of neither the additional detailed patient information collected within registry data nor the detailed operator and hospital information that might be associated with device use and account for differences in performance, and they do not account for the clustering of patients among physicians and hospitals.
Among the best available methods for medical device surveillance is the Data Extraction and Longitudinal Trend Analysis (DELTA) system, an automated safety-surveillance tool developed and validated using medical device registries and clinical trial databases. The DELTA system has successfully identified even very low-frequency events.12,17–20 However, this method also relies on clinical experts to prespecify “clinically important” patient characteristics for risk standardization, raising the question of whether novel machine learning (ML) analytic methods might complement current medical device surveillance efforts by more fully leveraging additional detailed patient, operator, and hospital information collected within registry data and employing data-driven, rather than expert-based, approaches to variable selection for risk standardization.21 While ML algorithms are typically applied to curated data sets where ground truth is known, in the context of real-world surveillance, the “truth” of medical device safety must be empirically investigated.
To understand potential advantages and disadvantages of applying such methods to medical device surveillance better, we used data from the NCDR-ICD registry in conjunction with Medicare administrative claims to conduct quarterly analyses of commonly used dual-chamber ICDs, surveying over 3 years of follow-up for important safety signals: death from any cause, nonfatal ICD-related adverse events, and a composite of the two. We applied three statistical approaches to safety-signal detection: time-to-event, DELTA, and embedded feature selection, each of which can be applied to registry data to evaluate multiple device types, outcomes, and evaluation periods, and compared when the three approaches identified safety signals.
Materials and methods
Data source
We used January 1, 2006, through March 31, 2010, data from the NCDR-ICD registry that collected information on ~ 90% of ICD implantations among hospitals that perform the procedure.22 These data include patient demographics and clinical comorbidities, the episode of care, and procedure information, as well as postprocedure events and complications prior to discharge.23 The registry employs a multifaceted program to enhance data quality.24 The NCDR-ICD registry data were linked using deterministic matching, as previously described,25 to 2006–2011 Medicare inpatient, outpatient, and carrier standard analytic files for longitudinal follow-up information, providing a minimum of 1 year and 9 months of follow-up for ICDs implanted in March 2010. The Medicare data sets contain claims for inpatient admissions and outpatient procedures for Medicare fee-for-service patients. Additionally, we used the 2006–2011 Medicare denominator files to obtain fee-for-service enrollment and postdischarge vital status of each beneficiary. For data access, the study was approved by but did not receive financial support from the NCDR. The NCDR research and publications committee reviewed the final manuscript prior to submission, but otherwise had no role in the design, conduct, or reporting of the study. The Yale University Human Investigation Committee approved the study (protocol MODCR00000080).
Study sample
All patients aged ≥65 years who had undergone dual-chamber ICD implantation and were able to be matched to Medicare fee-for-service claims data for long-term follow-up were included. We excluded patients if they were not discharged alive after ICD implantation, if they were discharged after March 31, 2010, or if data on patient age and sex or hospital-provider number were missing. Patients without both Part A and Part B Medicare fee-for-service coverage at the time of ICD implantation were also excluded. If a patient received multiple ICD implantations during the study period, they were eligible for inclusion as multiple unique observations, but follow-up for the first implantation was censored at the time of the second implantation.
Dual-chamber ICDs
For each dual-chamber ICD implanted during the study period, the device type (single chamber, dual chamber, cardiac resynchronization-therapy defibrillator) and listed manufacturer and model name and number within the NCDR-ICD registry were reviewed to ensure accuracy. Once accuracy was confirmed, a study ID was used to ensure the study team was blinded to the device manufacturer and model in accordance with the data-use agreement.
Main outcome measure
We surveyed outcomes after ICD implantation for three safety signals: death from any cause, nonfatal ICD-related adverse events, and a composite of the two. Deaths were ascertained at any time within the follow-up period after implantation, unless the patient underwent a generator reoperation, in which case death was ascertained before or up to 7 days after reoperation. A list of potential nonfatal ICD-related adverse events was developed using prior literature, using stakeholder input from regulators and manufacturers, and based on clinical expertise. Nonfatal ICD-related adverse events included ED visits and hospitalizations for complications resulting from the implantation, presence, performance, or failure of ICD therapy that did not involve reoperation, as well as any visit for ICD-site device revision or replacement (reoperation), whether inpatient or outpatient.
ED visits and hospitalizations for adverse events were identified using ICD9-CM primary discharge-diagnosis codes. A complete list of specific coding definitions is provided in Table 1 and includes the following categories of events: device failure, infection, mental health sequelae, and other device malfunction not requiring reoperation at any time after implantation, as well as procedural complications, such as aneurysms, aortic dissections, cardioembolic events, and pneumothorax within 90 days after implantation. Inpatient and outpatient visits for ICD-site reoperation were identified using ICD9-CM procedure codes and Common Procedural Terminology codes. A complete list of specific coding definitions is provided in Table 2 and includes the following categories of events: pocket reoperation, generator reoperation (with or without lead reoperation), and lead-only reoperation at any time after implantation.
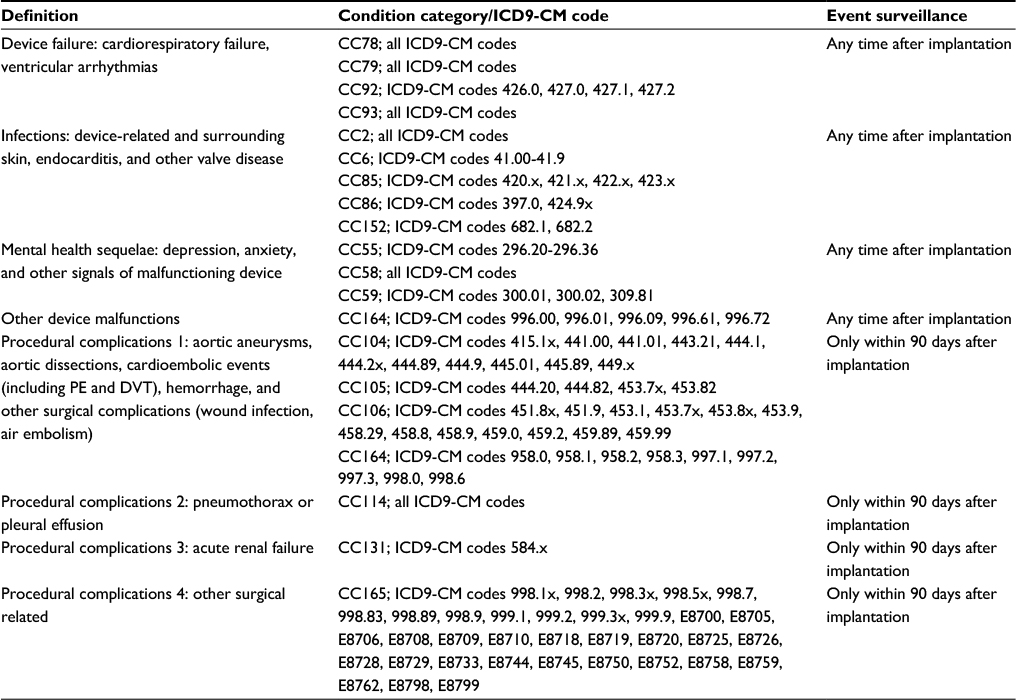 | Table 1 Implantable cardioverter–defibrillator-related nonreoperation adverse events (identified from ED visits or hospitalizations) Abbreviations: ED, emergency department; ICD9-CM, International Classification of Diseases, ninth revision, clinical modification; CC, condition category; PE, pulmonary embolism; DVT, deep vein thrombosis. |
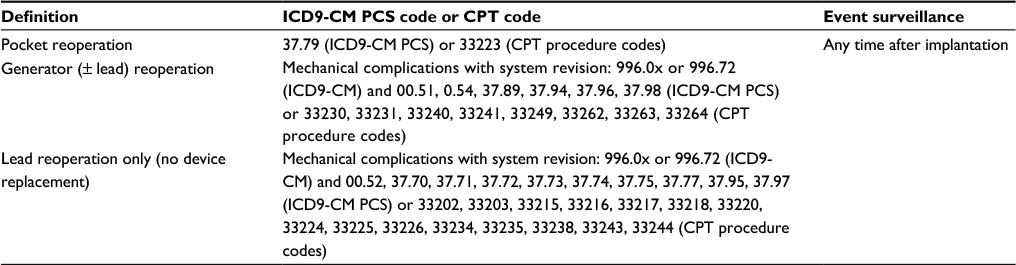 | Table 2 Implantable cardioverter–defibrillator site reoperation, including partial or complete replacement (identified from inpatient or outpatient visits) Abbreviations: ICD9-CM, International Classification of Diseases, ninth revision, clinical modification; PCS, procedure code set; CPT, current procedural terminology. |
Safety-signal detection analyses
Three statistical approaches were applied to safety-signal detection for commonly used dual-chamber ICDs: time-to-event, DELTA, and embedded feature selection (ie, continuous variable selection). The objective of each approach was to determine whether any differences in dual-chamber ICD safety profiles could be identified in “real time” by comparing the most commonly used dual-chamber ICDs to the overall sample of dual-chamber ICDs. Prior to initiation of analyses, the decision was made to focus signal-detection efforts on the most commonly used devices, as we hypothesized that we would likely only be able to discriminate signals among devices with the largest number of observations. Upon inspection of the patterns of use over the overall sample period to identify a threshold of utilization, we focused on commonly used dual-chamber ICD models that had been implanted 2,000 times or more. Following accepted practice that at least 10 observations be required per propensity score (PS) model covariate, no analyses were initiated until the dual-chamber ICD of interest had been implanted 180 times. Once this threshold was reached, the three safety-signal detection approaches were independently applied to 12 consecutive quarters (ie, device performance in a prior quarter did not impact evaluation in a subsequent quarter), for a total of 3 years of safety surveillance for each device.
For all statistical analyses, significance tests were two-sided with a significance level of 0.05 and adjusted for multiple comparisons using the Sidák correction.26 Time-to-event and DELTA analyses were conducted using SAS 9.4 (SAS Institute, Cary, NC, USA); the embedded feature selection approach was implemented in Python 3.4.3 (Python Software Foundation, Wilmington, DE, USA).
Time-to-event
The Kaplan–Meier method was used to calculate cumulative actuarial event-free incidence rates. Differences in survival curves among devices were compared using the log-rank test. For this method, we matched patients who received any of the most commonly used dual-chamber ICDs to a patient receiving any alternative dual-chamber ICD. Patients were matched 1:1 within a fixed PS caliper of 0.05 using a “greedy” matching algorithm27 that accounted for the date of implantation (within 30 days) and 13 patient characteristics (total of 18 covariates), all of which were identified prior to analyses based on clinical judgment and known associations with worse outcomes after ICD implantation.6 The following characteristics ascertained at the time of implantation were used: age, sex, race, clinical comorbidities, New York Heart Association class, reason for admission (admitted for ICD implantation or admitted for clinical management and ICD implanted during course of hospitalization), indication for ICD therapy (primary versus secondary prevention, depending upon patients’ prior history of cardiac arrest), and receipt of optimal medical therapy at discharge (when there was no contraindication),28 including aspirin, statin, β-blocker, and angiotensin-converting-enzyme inhibitor or angiotensin II-receptor blocker. Single imputation was used for missing data; missing binary variables were imputed with 0, continuous variables were mean imputed, and categorical variables were imputed with the most frequent value.
The PS was calculated using nonparsimonious logistic regression, with the device of interest as the dependent variable. Separate models were fitted for each of the most commonly used dual-chamber ICDs, and analyses were conducted independently for each of the surveyed three safety signals. Because patients could have died prior to experiencing an ICD-related adverse event, we accounted for the competing risk of death by calculating cumulative incidence functions for these subanalyses and applied Fine and Gray testing for the equality of these curves.29 A safety signal was triggered if the cumulative incidence function in a quarter differed significantly between the exposed and comparator groups, using a significance level of 0.05 adjusted for the aforementioned multiple comparisons. For each quarter, a report of percentage matches and covariate balance (standardized differences in means) was generated; balance among matched cohorts was evaluated using standardized differences of the selected covariates, and any difference >10% indicated imbalance.
DELTA
The DELTA system was developed and validated using medical device registries and clinical trial databases and shown to identify very low-frequency events, using an array of Bayesian and frequentist-inference methods.12,17–20 The system supports multiple, simultaneous device-specific analyses, tracking the accumulating experience of multiple devices while simultaneously monitoring multiple independent data sets. We replicated this approach,17 matching patients using the same method as discussed in the previous section for the time-to-event approach, with the exception that the date of implantation was matched within 180 days; single imputation was similarly used for missing data. Analyses were conducted quarterly for the PS-matched cohorts for each of the most commonly used dual-chamber ICDs. At least 75% of patients were required to be matched to a control patient to proceed with analysis. We used the Wilson-score method with continuity correction to calculate a confidence interval for the cumulative risk difference. As per the DELTA system, a safety signal was triggered if the confidence interval did not cross zero, which indicates a statistically significant difference between patients receiving the ICD of interest and the PS-matched control cohorts using a significance level of 0.05. However, several modifications were made for expedience: sensitivity analyses were not performed when a safety signal was triggered, a power calculation was not performed pre hoc to determine sample size, the O’Brien–Fleming α-spending method was not employed,30 and a fixed 3-year surveillance period was examined. Analyses were conducted independently for each of the surveyed three safety signals. As in the time-to-event approach, for each quarter a report of percentage matches and covariate balance (standardized differences in means) was generated; balance among matched cohorts was evaluated using standardized differences of the selected covariates and any difference >10% indicated imbalance.
Embedded feature selection
The time-to-event and DELTA approaches rely on a PS model specified by subject-matter experts (PS-SME). If the experts correctly specify the model, including the correct outcome and exposure covariates and their interactions, then we expect the PS-SME to generate reliable inferences. However, the absence of an unrecognized confounder from the PS-SME, eg, medical history of cardiac arrest or time of implant, may lead to erroneous conclusions about device safety and effectiveness. Moreover, manual specification may limit scalability of any medical device-surveillance system wherein safety signals for multiple treatment-outcome pairs are to be monitored. Therefore, some automated assistance in model specification could be desirable. Here, we considered the potential of an ML method known as embedded feature selection to create a complementary PS model (PS-ML), allowing the data to drive model specification.
Our principal aim is to periodically estimate the risk difference per device relative to a control group of individuals with a different device but of the same device class. To be precise, let I index the individuals who receive an implanted medical device of a given type in a given study period [tbegin, tend]. We represent this cohort by {(xi, yi, zi)}iŒI, where xi denotes preimplant covariates, yi indicates whether a given outcome occurs in the study period, and zi denotes the device implanted in i. We fix the device to be evaluated, and write zi=1 if individual i has this device and zi=0 if individual i has another device. Let I1 index the individuals who received the device, ie, I1={i |zi = 1}, and put I0 :=I \I1.
In what follows, we make the stable-unit treatment-value assumption: 1) there is no interference between treatments and 2) treatment is fixed. Moreover, we assume that treatment assignment is individualistic, probabilistic, and unconfounded.
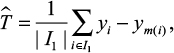
Given the PS π(x) := P(z = 1| x), the matching estimator for the risk difference is given by
|
where the 1–1 matching function  is constructed through PS matching without replacement. Here,
  denotes all exposed individuals who can be matched, as we place two restrictions on m, given an estimate
  of the logit of the PS: first, letting σ() denote the sample standard deviation of over I, we fix a caliper c > 0 and require
 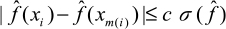 ; second, i and m(i) must have implant dates within 180 days of each other. In practice, we put c=0.05.
In the embedded feature-selection approach, we use a 1-norm support vector machine to estimate the PS, denoted PS-ML. In particular, we use the hinge loss, l1 -regularized objective function:
|
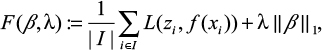
where  and
and  . To be exact,
  ; we augment the covariates as x0 = 1 so that β0 is the bias term, and
  does not include the intercept β0. Given λ, the regularization parameter, we solve
  to get
  , a 1-norm support vector machine, which estimates the logit of the PS π. Larger values of λ yield sparser models, ie, models with fewer selected covariates. We estimate the β-coefficients using a first-order stochastic gradient-descent learning routine, ie, Scikit-Learn’s SGDClassifier. Hyperparameters of the learning algorithm include the number of epochs (n=10), initialization (warm start = True), regularization penalty (as determined by the PS-ML algorithm), and shuffle (True).
The regularization parameter λ is determined according to the PS-ML algorithm (Figure 1). In this algorithm, one prespecifies a range for the number of selected covariates: 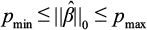 . Given an initial regularization penalty λ, the PS-ML algorithm adjusts the regularization penalty with an annealing rate δ > 1 until the final number of selected covariates lies within the desired range and the selected covariates are balanced. The matching m is considered to be balanced if the standardized mean difference of each selected covariate (ie, covariates such that
  ) between exposed and matched is ≤0.1.
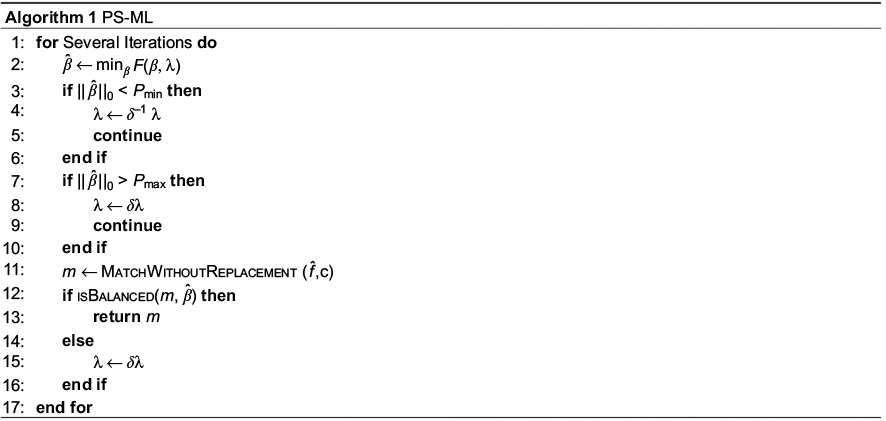 | Figure 1 PS-ML algorithm to determine the regularization parameter. Abbreviations: PS, propensity score; ML, machine learning. |
For surveillance, preimplant covariates were extracted from the NCDR data set. These included 59 binary, 17 continuous, and 25 categorical covariates. Missing binary covariates were imputed with 0, as most corresponded to entries like “history of X: No=0, Yes=1”, and we assumed a missing value to imply nonpresence of the condition, procedure, etc. Continuous covariates were mean imputed. Levels of the categorical variables (including “missing” as a level) were dummy-coded, resulting in 188 main effects. These main effects and their first-order interactions were included to yield p=17,766 potential covariates. Each of the p=17,766 dimensions was standardized, ie, scaled to have mean 0 and unit standard deviation.
In running PS-ML, we set the minimum number of selected covariates to be pmin =10 and the maximum number of selected covariates to be pmax =30. The lower bound was chosen to prevent the model from being too lenient, and the upper bound was an heuristic chosen to limit the number of covariates that must be balanced. We chose the caliper to be c=0.05, which resulted in a high percentage of matches. The initial regularization penalty was set to λ=0.05, which we found to lead to quick convergence. We set the regularization annealing rate to be δ=1.1, with which the algorithm consistently terminated with a number of selected features within the desired range.
In summary, the embedded feature-selection approach fits a PS model using a kind of continuous covariate selection, where the number of selected covariates is determined by a single parameter known as the regularization parameter.31,32 For each exposure, we searched for a regularization parameter that resulted in a PS model without limiting covariates. Next, balance between the exposed and PS-matched groups was assessed. If there was imbalance, the regularization parameter was changed to yield a model with fewer covariates. This iterative procedure was repeated until balanced, matched groups were established. Once specified according to this algorithm, the PS-ML model is used for surveillance in a manner analogous to the DELTA approach.
In the embedded feature-selection approach, most data elements collected within the NCDR-ICD registry were considered potential main-effect covariates in the PS-ML, including two-way interactions. We modeled PS-ML using a 1-norm support vector machine, with a regularization parameter chosen as described in the preceding paragraph.33 We matched patients who had received any of the most commonly used dual-chamber ICDs to a patient receiving any alternative dual-chamber ICD. Patients were matched 1:1 within a fixed PS caliper of 0.05 using a “greedy” matching algorithm that accounted for the date of implantation (within 180 days) and the PS-ML model. Single imputation was used for missing entries, missing binary variables were imputed with 0, continuous variables were mean imputed, and categorical variables (including missing as a level) were dummy coded. Analyses were conducted quarterly for the matched cohorts for each of the most commonly used dual-chamber ICDs. As per the DELTA approach, a safety signal was triggered if the Wilson-score confidence interval for the cumulative risk difference did not cross zero. Again, for each device and quarter, a report of percentage matches and covariate balance (standardized differences in means) was generated; balance among matched cohorts was evaluated using standardized differences of the selected covariates, and any difference >10% indicated imbalance.
Results
Between 2006 and 2010, there were 71,948 dual-chamber ICDs identified from the NCDR-ICD registry implanted among Medicare fee-for-service beneficiaries with linked administrative claims data to ascertain long-term follow-up (Figure 2). The mean patient age was 75.2 years (SD 6.4), 24% were female, and 89% were white (Table 3). Among these patients, 77% had prior ischemic heart disease, 52% had prior sustained or unsustained ventricular tachycardia, 31% had New York Heart Association class III or IV heart failure, and 71% of ICDs were implanted for primary prevention. The median duration of follow-up (ie, time from hospital discharge after implantation until death, end of study period, or lost to follow-up due to disenrollment in Medicare fee-for-service plan) was 2.7 years (interquartile range 1.9–3.8 years). There were few differences in the characteristics of patients, all of which were minimal, among the dual-chamber ICD patient populations (Table 4).
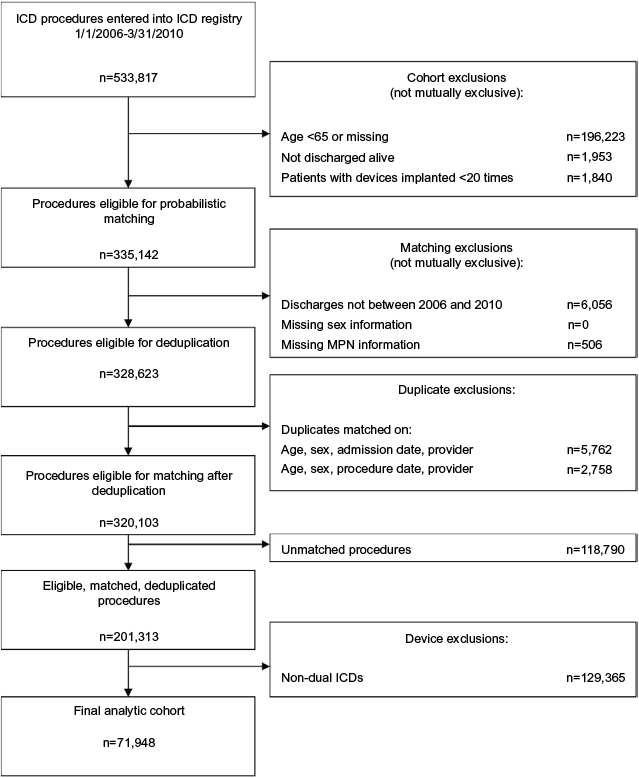 | Figure 2 Cohort-derivation flowchart. Abbreviations: ICD, implantable cardioverter-defibrillator; MPN, Medicare provider number. |
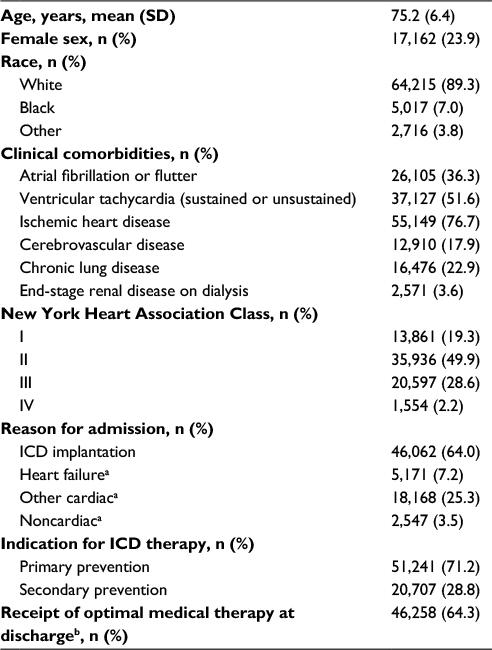 | Table 3 Key characteristics of patients receiving dual-chamber ICDs, 2006–2010 (n=71,948) Notes: aAdmitted for clinical management and ICD implanted during course of hospitalization; breceipt of optimal medical therapy at discharge, when there was no contraindication, included aspirin, statin, β-blocker, and angiotensin-converting-enzyme inhibitor or angiotensin II-receptor blocker. Abbreviation: ICDs, implantable cardioverter–defibrillators. |
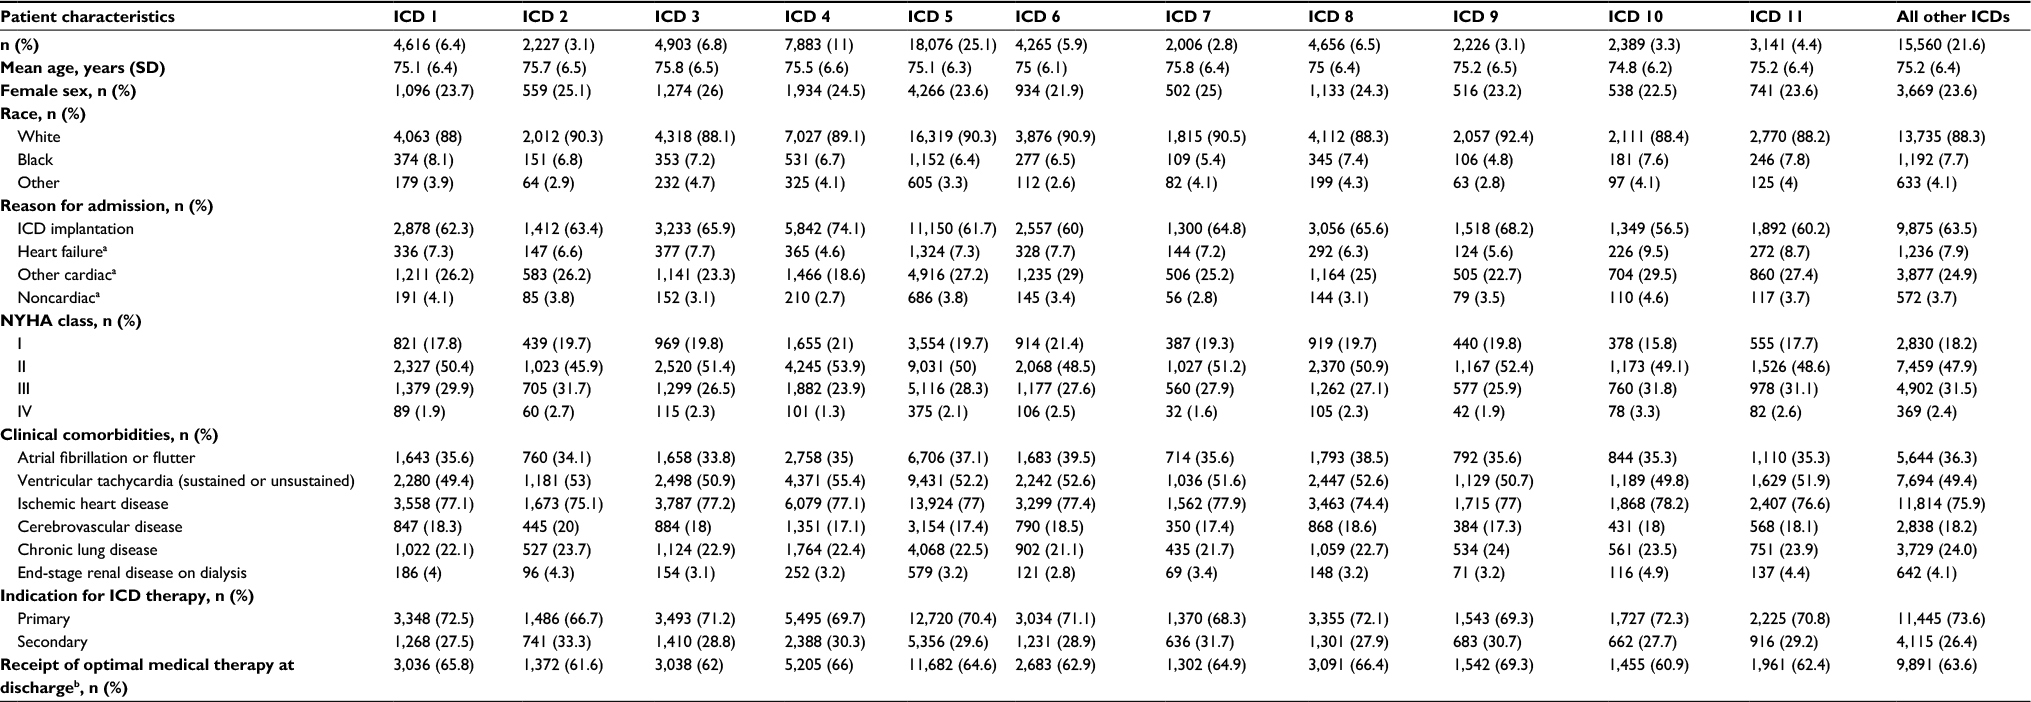 | Table 4 Key characteristics of patients receiving dual-chamber ICDs, 2006–2010 by device Notes: aAdmitted for clinical management and ICD implanted during course of hospitalization; breceipt of optimal medical therapy at discharge, when there was no contraindication, included aspirin, statin, β-blocker, and angiotensin-converting-enzyme inhibitor or angiotensin II-receptor blocker. Abbreviations: ICDs, implantable cardioverter–defibrillators; NYHA, New York Heart Association. |
Dual-chamber ICD volume and safety signals
In total, there were 16,397 deaths within 3 years after implantation, 20,556 ED visits and hospitalizations for ICD-related adverse events within 3 years after implantation, 1,275 for procedural complications within 90 days after implantation, and 8,026 inpatient and outpatient visits for ICD-site reoperations. Figure 3 displays a Kaplan–Meier survival curve illustrating freedom from death or nonfatal ICD-related adverse events among the full sample of Medicare fee-for-service beneficiaries.
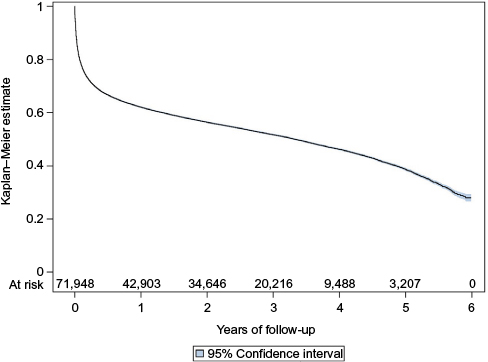 | Figure 3 Kaplan–Meier survival curve. Note: Freedom from death or nonfatal ICD-related adverse events among Medicare fee-for-service beneficiaries undergoing dual-chamber ICD implantation, 2006–2010. Abbreviation: ICD, implantable cardioverter–defibrillator. |
Cumulative implantation volumes for eleven dual-chamber ICDs implanted 2,000 times or more among Medicare fee-for-service beneficiaries during this period are displayed in Figure 4. While cumulative volume did not exceed 2,400 implantations for four devices, the two most commonly implanted dual-chamber ICDs had cumulative volumes of 7,891 and 18,093.
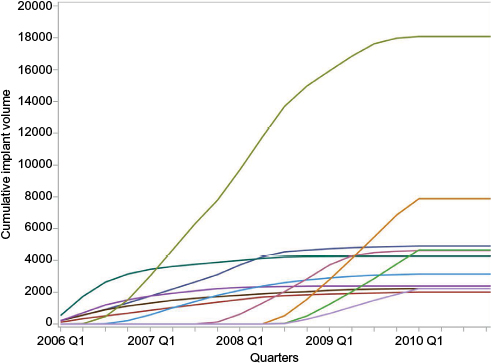 | Figure 4 Cumulative implantation volume for the eleven dual-chamber ICDs. Note: ICDs implanted 2,000 times or more among Medicare fee-for-service beneficiaries, 2006–2010. Abbreviation: ICDs, implantable cardioverter–defibrillators. |
Signal-detection analyses focused on the eleven dual-chamber ICDs implanted 2,000 times or more, among which cumulative unadjusted event rates following 3 years of surveillance varied. Cumulative death rates ranged from 12.8% (95% CI 12.3%–13.3%) to 20.9% (95% CI 19.3%–22.7%). Cumulative nonfatal ICD-related adverse-event rates ranged from 19.3% (95% CI 18.2%–20.5%) to 26.3% (95% CI 24.5%–28.1%). Finally, cumulative rates of death or nonfatal ICD-related adverse events ranged from 27.1% (95% CI 26.5%–27.8%) to 37.6% (95% CI 35.5%–39.8%). Among nonfatal ICD-related adverse events, the most common were ED visits or hospitalizations for device failure, infection, or device malfunction, and inpatient or outpatient visits for ICD-site generator reoperation (with or without lead reoperation) or lead reoperation only (Table 5).
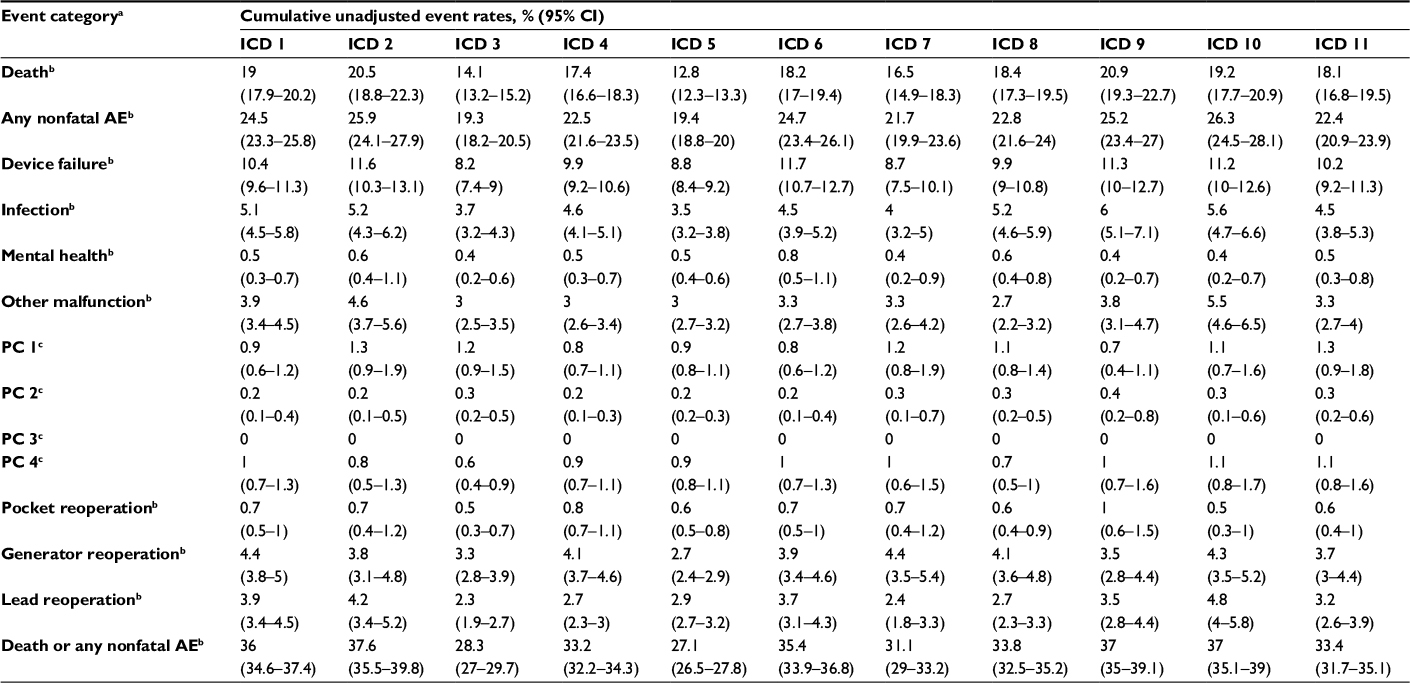 | Table 5 Cumulative unadjusted rates of death, nonfatal AEs, and death or nonfatal AEs for eleven commonly used dual-chamber ICDs, 2006–2010 Notes: aAll event categories defined in Tables 1 and 2; bevent surveillance for 3 years postimplantation; cevent surveillance for 90 days postimplantation. Abbreviations: ICDs, implantable cardioverter–defibrillators; AEs, adverse events; PC, procedural complication. |
Three approaches to safety-signal detection
Each of the three approaches to signal detection was applied to the eleven commonly used dual-chamber ICDs over 12 periods of analysis and for all three surveyed safety signals (396 distinct surveillance analyses). For the time-to-event approach, all patients receiving each of the eleven devices were successfully matched to controls who had received an alternative device within 30 days of the date of implant. In addition, among the 14 characteristics (18 covariates) used for the PS-SME, there were 111 instances of covariate imbalance across the 396 distinct analyses (3.6% of the 7,128 opportunities for covariate imbalance among the eleven devices evaluated over 12 quarters; Table 6). For the DELTA approach, all patients receiving each of the eleven devices were successfully matched to controls who had received an alternative device within 180 days of the date of implant. In addition, among the 14 characteristics (18 covariates) used for the PS-SME, there were 93 instances of covariate imbalance across the 396 distinct analyses (2.4% of the 7,128 opportunities for covariate imbalance). Last, for the embedded feature-selection approach, all patients receiving each of the eleven devices were successfully matched to controls who had received an alternative device within 180 days of the date of implant. A total of 3,087 unique covariates (including interactions) were selected by the PS-ML for at least one device and quarter (Table 7), none of which was used more than five times, and there were no instances of covariate imbalance across the 396 distinct analyses.
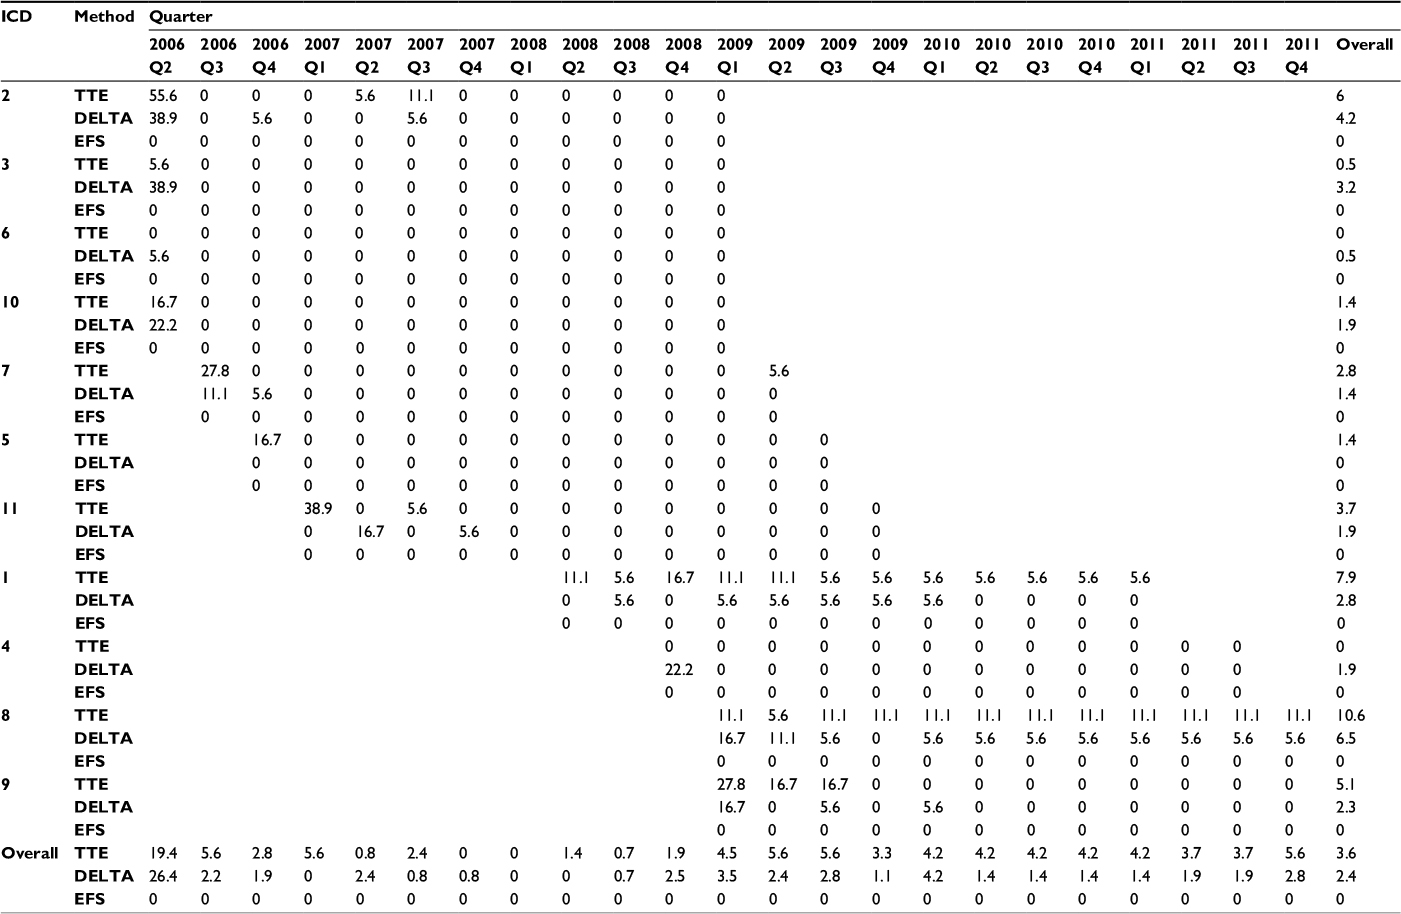 | Table 6 Percentage of parameters imbalanced Abbreviations: ICD, implantable cardioverter–defibrillator; TTE, time-to-event (modeling); DELTA, Data Extraction and Longitudinal Trend Analysis; EFS, embedded feature selection. |
 | Table 7 Most frequent covariates used in embedded feature selection Abbreviations: EPS, electrophysiology study; VT, ventricular tachycardia; NYHA, New York Heart Association; LV, left ventricular; PICD, previous implantable cardioverter-defibrillator; SCD, sudden cardiac death; CBSA, core-based statistical area; CHF, congestive heart failure; HTS, hospital teaching status; MI, myocardial infarction; HMO, health-maintenance organization; ICD, implantable cardioverter-defibrillator; HTYPE, hospital type (cardiac facility capability); CATH, catheterization (procedures performed at facility); HCO, health care organization. |
Comparing three approaches to safety-signal detection
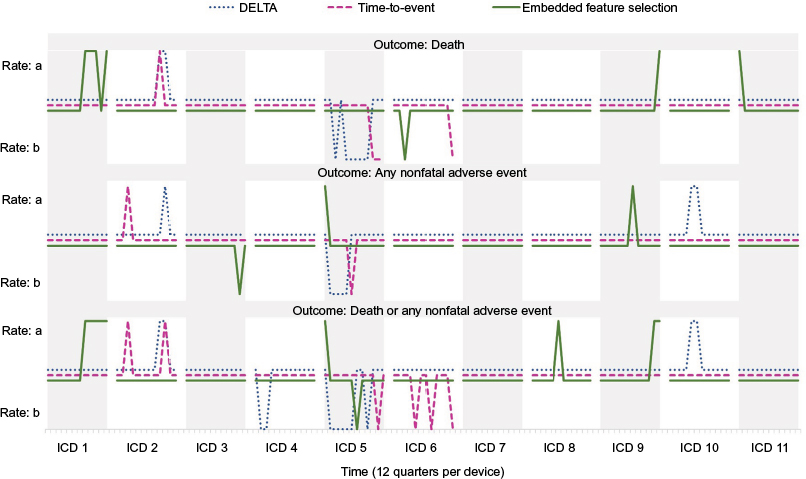
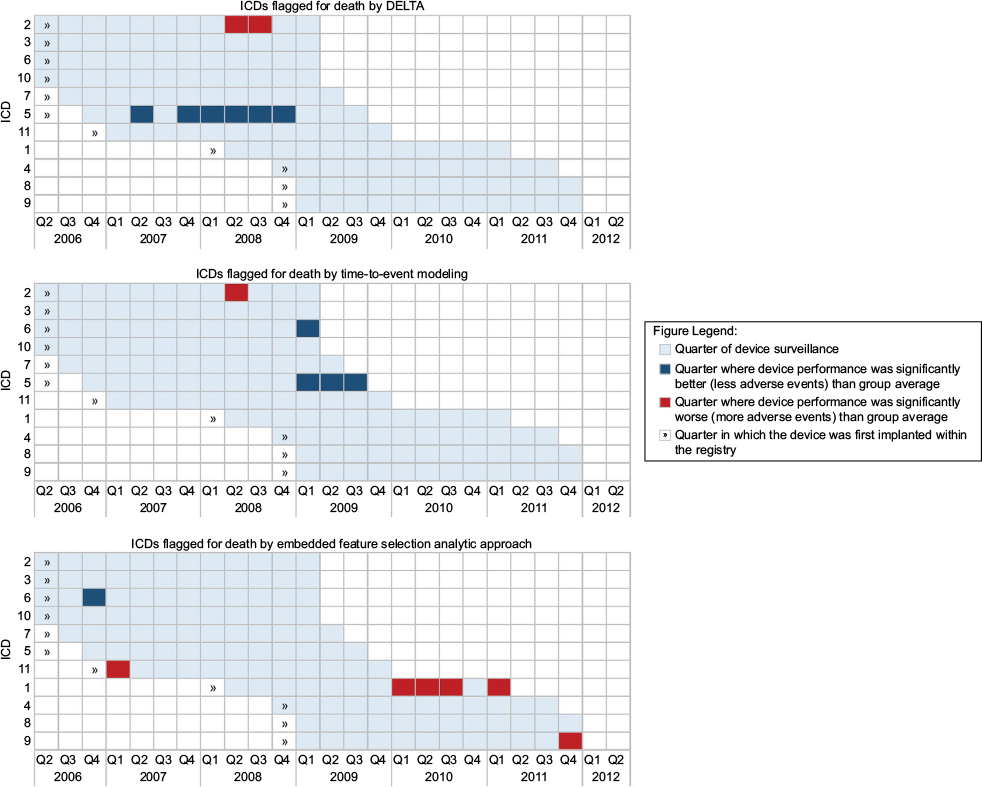
For the eleven commonly used dual-chamber ICDs, the application of time-to-event, DELTA, and embedded feature-selection approaches for safety-signal detection resulted in frequent agreements on the absence of safety signals, but rare agreements on their presence for individual devices and across periods of surveillance (Figure 5). A total of 60 safety signals were identified where an ICD was determined to be significantly better or worse than the group average for at least a quarter of observations for one of the three surveyed safety signals (death, nonfatal ICD-related adverse events, or a composite of the two): 13 signals were identified by the time-to-event approach, 27 by the DELTA approach, and 20 by the embedded feature-selection approach (Figures 6–8). No signal was identified by all three statistical approaches, whereas a signal for ICD 2 was twice identified by both the time-to-event and DELTA approaches; the remaining signals were identified by only one statistical approach. Among the 396 distinct analyses, the agreement in signals detected (or lack thereof) between the time-to-event and DELTA approaches was 90.9% (360 of 396, k=0.068, 95% CI –0.064 to 0.199), that between time-to-event and embedded feature-selection approaches was 91.7% (363 of 396, k=–0.028, 95% CI –0.039 to –0.017), and that between the DELTA and embedded feature selection approaches was 88.1% (349 of 396, k=–0.042, 95% CI –0.055 to –0.029).
 | Figure 5 Time-to-event, DELTA, and embedded feature selection approaches for safety-signal detection among eleven commonly used dual-chamber ICDs, 2006–2010. Note: a, Rate higher than control; b, rate lower than control. Abbreviations: DELTA, Data Extraction and Longitudinal Trend Analysis; ICDs, implantable cardioverter–defibrillators. |
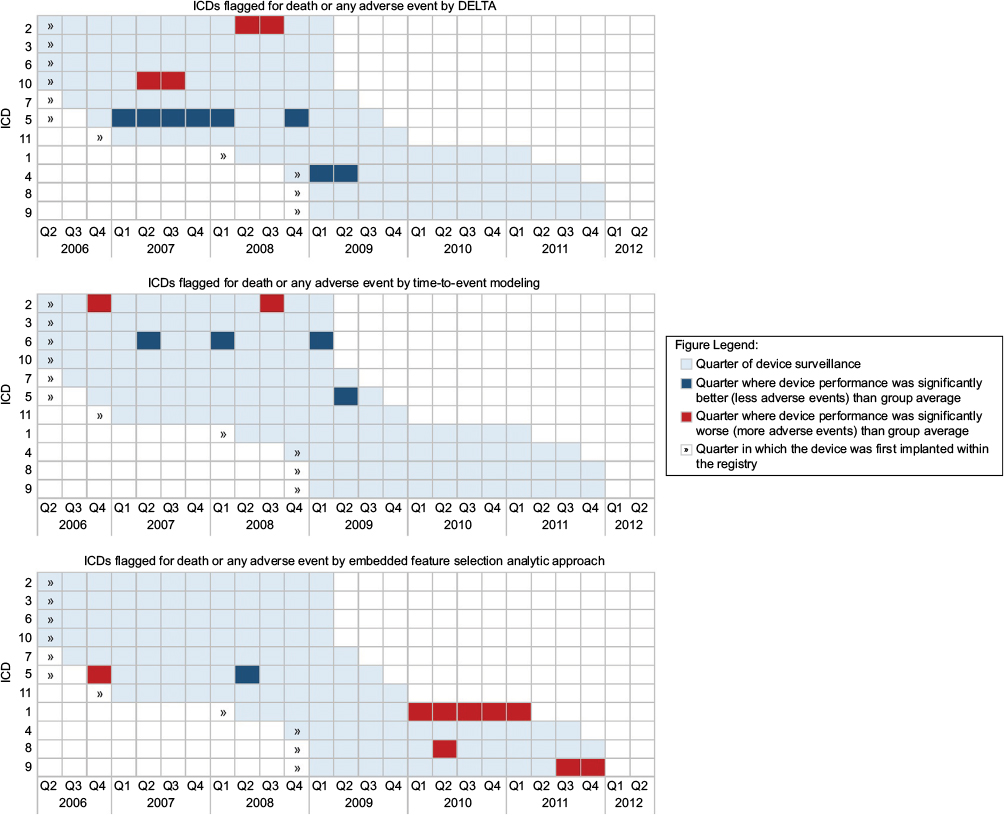
 | Figure 6 Time-to-event, DELTA, and embedded feature selection methods for safety-signal detection for death among eleven commonly used dual-chamber ICDs, 2006–2010. Abbreviations: DELTA, Data Extraction and Longitudinal Trend Analysis; ICDs, implantable cardioverter–defibrillators. |
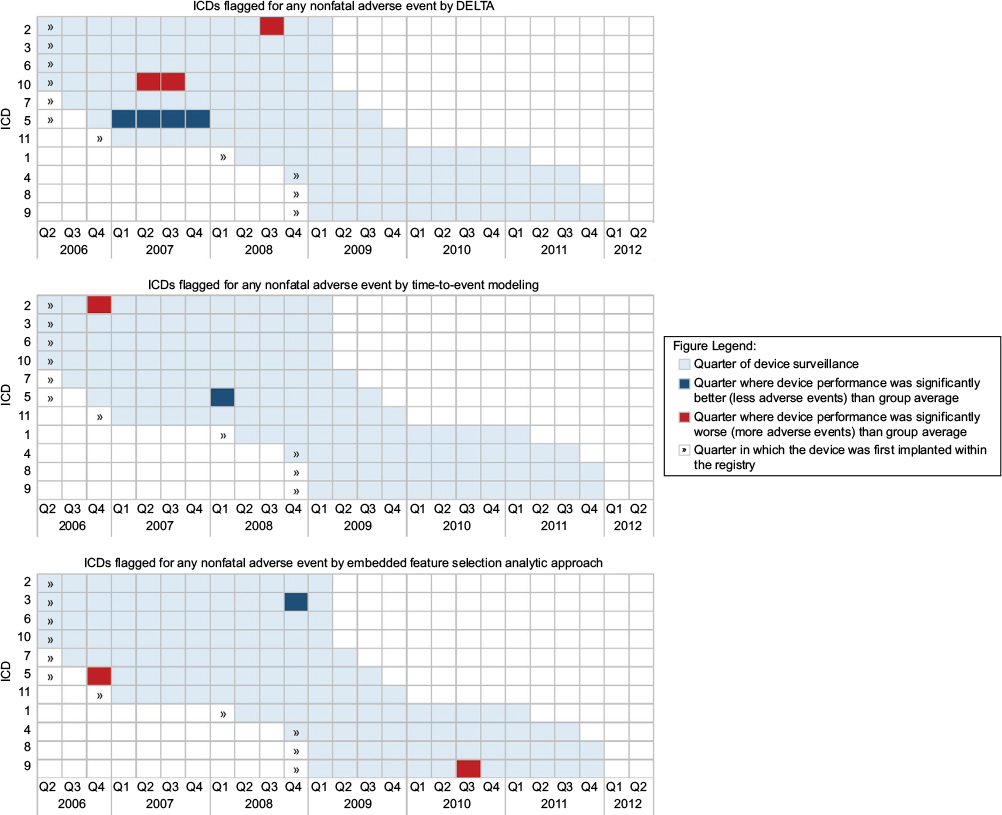 | Figure 7 Time-to-event, DELTA, and embedded feature selection methods for safety-signal detection for any nonfatal adverse event among eleven commonly used dualchamber ICDs, 2006–2010. Abbreviations: DELTA, Data Extraction and Longitudinal Trend Analysis; ICDs, implantable cardioverter–defibrillators. |
 | Figure 8 Time-to-event, DELTA, and embedded feature selection methods for safety-signal detection for death or any adverse event among eleven commonly used dualchamber ICDs, 2006–2010. Abbreviations: DELTA, Data Extraction and Longitudinal Trend Analysis; ICDs, implantable cardioverter–defibrillators. |
With the exception of ICD 7, each dual-chamber ICD was identified by at least one statistical approach as being significantly better or worse than the group average for at least one quarter of observation; the most commonly identified devices were ICDs 5, 1, and 2. For instance, there were 22 quarters of observation where ICD 5 was determined to be significantly better than the group average (and two quarters where it was worse) by any of the three statistical approaches, each of which was surveying for all three safety signals. For ICD 1, there were nine quarters where it was determined to be significantly worse than the group average, always by the embedded feature-selection approach, whereas for ICD 2 there were seven quarters where it was determined to be significantly worse than the group average, but only by the time-to-event approach or DELTA.
ICDs 1 and 5 provide illustrative examples of the use of both DELTA and the embedded feature-selection approach for safety-signal detection. Figure 9 displays river plots visualizing medical device performance for ICD 1 relative to propensity-matched control devices, for the composite end point of death or nonfatal ICD-related adverse events. For this device, DELTA identified neither better nor worse than average safety performance, but for six quarters there was at least one covariate imbalanced among the propensity-matched groups. In contrast, the embedded feature-selection approach identified five consecutive quarters at the end of the observation period in which the device was identified as having worse than average safety performance, without covariate imbalance among the propensity-matched groups. Similarly, Figure 10 displays river plots for ICD 5, the most commonly implanted device in the sample. For this device, DELTA identified six quarters, many of which were consecutive, in which the device was identified as having better than average safety performance, without covariate imbalance among the propensity-matched groups. In contrast, the embedded feature-selection approach identified one quarter early in the observation period in which the device was identified as having worse than average safety performance, and another quarter later in the observation period in which the device was identified as having better than average safety performance, without covariate imbalance among propensity-matched groups.
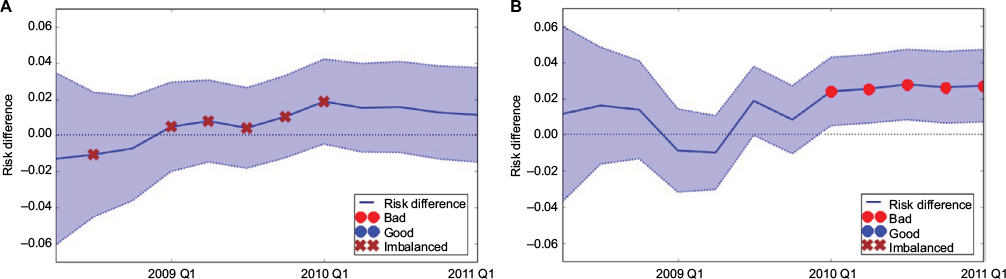 | Figure 9 Medical device performance for ICD 1 relative to propensity-matched control devices. Notes: Measured by composite end point of death or nonfatal ICD-related adverse events, assessed using (A) DELTA and (B) embedded feature selection. “Bad” indicates quarters where device performance was significantly worse (more adverse events) relative to propensity-matched control devices; “Good” indicates quarters where device performance was significantly better (less adverse events) relative to propensity-matched control devices; “Imbalanced” indicates quarters where at least one covariate was imbalanced among the propensity-matched groups. Abbreviations: DELTA, Data Extraction and Longitudinal Trend Analysis; ICD, implantable cardioverter–defibrillator. |
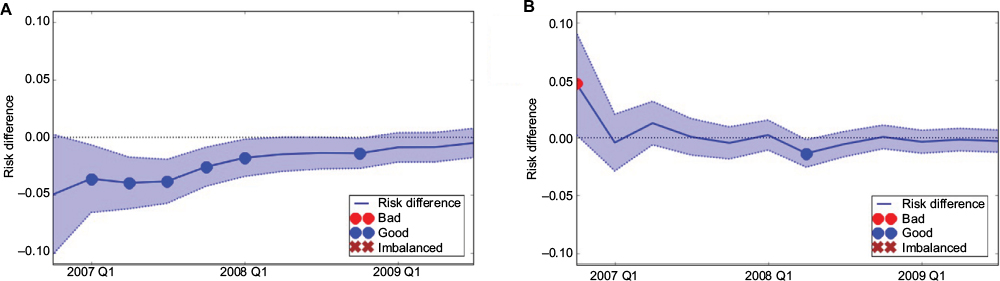 | Figure 10 Medical device performance for ICD 5 relative to propensity-matched control devices. Notes: Measured by composite end point of death or nonfatal ICD-related adverse events, assessed using (A) DELTA and (B) embedded feature selection. “Bad” indicates quarters where device performance was significantly worse (more adverse events) relative to propensity-matched control devices; “Good” indicates quarters where device performance was significantly better (less adverse events) relative to propensity-matched control devices; “Imbalanced” indicates quarters where at least one covariate was imbalanced among the propensity-matched groups. Abbreviations: DELTA, Data Extraction and Longitudinal Trend Analysis; ICD, implantable cardioverter–defibrillator. |
Discussion
Using data from the NCDR-ICD registry in conjunction with longitudinal follow-up information obtained from Medicare administrative claims, we found that three statistical approaches to safety-signal detection, including one ML method, identified important safety signals for eleven commonly used dual-chamber ICDs. However, while these three approaches resulted in frequent agreements on the absence of signals, there were rare agreements on the quarterly presence of signals. These findings provide early insights into whether multiple methods used as an ensemble may be necessary to detect all safety signals for further evaluation during medical device surveillance, as well as for how ML analytic methods might complement current surveillance efforts that are using traditional analytic methods.
For effective postmarket medical device-safety surveillance, three components must be in place: effective and reliable data collection, analysis, and interpretation. High-quality registry data, such as those from NCDR-ICD, offer detailed information about patients, procedures, and devices that can be used for surveillance. However, registries are costly, are not necessarily scalable across all medical devices types, and currently lack coordination.34 The FDA is actively engaged in and working to enhance surveillance and life cycle medical device evaluation to monitor medical device safety and effectiveness.9,10,35 Ensuring effective and reliable data collection for surveillance will likely require leveraging information from that routinely collected by electronic health records or administrative claims data, once there is widespread adoption of the unique-device-identifier system.36
Our analyses were focused on understanding the effectiveness and reliability of data analysis for medical device surveillance, examining whether different statistical approaches to analysis agree in the identification of safety issues that deserve further scrutiny and evaluation. Across three approaches, we found frequent agreements on the absences of signals, but rare agreements on their presence. There are three potential reasons for our findings. First, perhaps the eleven commonly used dual-chamber ICDs we examined all have approximately the same safety profile, resulting in the same risk-standardized rates of death and adverse events. In other words, there may have been no underlying safety issue to detect. Second, perhaps there were underlying safety issues to detect, but none of the methods was sufficiently robust to discriminate differences accurately and consistently among ICD models. Finally, perhaps each statistical approach has inherent advantages and disadvantages for safety-signal detection accuracy, leading to differences in performance across methods. Because there is currently no “gold standard” method for safety-signal detection in surveillance, we cannot determine which method is most effective and reliable. Further work testing different methods in different data sources will be needed to understand better whether an ensemble methodological approach to medical device surveillance would best identify those important safety issues that deserve further scrutiny and evaluation, or whether multiple methods contribute to false-positive errors in signal detection.
Our findings provide important insights into statistical approaches used for medical device surveillance. First, while we observed rare agreement on the quarterly identification of safety signals for the ICD models, we did observe that those models with the lowest and highest cumulative observed death and adverse-event rates, prior to risk standardization, were identified in at least one quarterly period of surveillance as being significantly better or worse than the group by at least one statistical approach, just not consistently by all three. Despite each approach having been applied to the same quarterly cohort of devices and restricting analyses to dual-chamber ICDs implanted at least 2,000 times overall, perhaps quarterly implantation volumes may have been insufficient, resulting in false-negative errors. Safety-signal surveillance might be enhanced by using time intervals with greater volumes of utilization, such as every 6 months instead of quarterly, or by taking into account total cumulative performance, as opposed to analyzing each quarter of data independently. Second, we used a broad definition of safety events determined to be of high clinical importance, including death from any cause and a wide range of adverse events. Perhaps a narrower approach would lead to more specific, device-related safety insights. Finally, we found that patient characteristics were not strong predictors of which dual-chamber ICD model was implanted. Safety-signal surveillance might be enhanced by selecting as many controls as possible, as opposed to one-to-one matching.
Still to be determined is how best to interpret any safety signal identified during medical device surveillance. In our analyses, few recurrent signals were identified. As part of the DELTA system, a safety signal requires confirmation in subsequent time periods prior to regulatory action. Our analyses raise the possibility of whether one statistical approach should be used to confirm another in the same time period or in subsequent time periods. Might application of multiple statistical approaches in parallel increase sensitivity, although potentially at the expense of specificity? As our understanding of how ensemble methods, including both ML and traditional analytic methods, might be used for surveillance deepens, future work can be focused on effective interpretation.
Our study has important limitations to consider. First, our analyses were limited to dual-chamber ICDs. Further work should consider other high-risk medical devices for which safety signals may be more common. Second, we used 2006–2010 NCDR-ICD registry data, which do not contain information on dual-chamber ICD leads, a potentially important cause of postmarket safety problems,37 nor on how the ICDs were programmed, meaning we were unable to evaluate whether a safety event was a consequence of the ICD generator, lead, or programming. Third, the use of single rather than multiple imputation is a limitation. However, as the focus of this paper is on the comparative use of different approaches, the conclusions should remain the same. Finally, our analyses were limited to Medicare beneficiaries aged ≥65 years, and younger patients may experience different rates of adverse outcomes.
Conclusion
Three statistical approaches, including one ML method, successfully identified important safety signals as part of medical device surveillance. However, while there were frequent agreements on the absence of signals, there were rare agreements on their presence for dual-chamber ICDs across periods of surveillance. Further work is needed to understand better whether ensemble methods may be necessary to detect all safety signals and how ML may complement traditional analytic approaches to medical device surveillance.
Author contributions
JSR, JB, and CSP had full access to all of the data in the study and take responsibility for the integrity of the data and the accuracy of the data analysis. All authors contributed toward data analysis, drafting and revising the paper and agree to be accountable for all aspects of the work.
Acknowledgments
The authors acknowledge Ms Erin Singleton, MPH, who assisted in project management as an employee of the Yale–New Haven Hospital Center for Outcomes Research and Evaluation; Ms Julia Eichenfield, MPH, who provided background research during the course of her summer student employment at the Yale–New Haven Hospital Center for Outcomes Research and Evaluation; and Dr Jerome Kassirer, who provided comments on an earlier draft of this manuscript without compensation for his effort. The National Cardiovascular Data Registry (NCDR) ICD Registry is an initiative of the American College of Cardiology Foundation, with partnering support from the Heart Rhythm Society. The views expressed in this manuscript represent those of the authors and do not necessarily represent the official views of the NCDR or its associated professional societies identified at cvquality.acc.org/ncdr. This project was jointly funded by the US Food and Drug Administration (FDA) and Medtronic Inc to develop methods for postmarket surveillance of medical devices. Members of the sponsoring organizations contributed directly to the project, participating in study conception and design, analysis and interpretation of data, and critical revision of the manuscript; the authors made the final decision to submit the manuscript for publication. In addition, the project was approved by but did not receive financial support from the American College of Cardiology’s NCDR. The NCDR research committee reviewed the final manuscript prior to submission, but otherwise had no role in the design, conduct, or reporting of the study. JPC, FAM, and RES receive support from the American College of Cardiology for roles within the NCDR. NRD is supported by grant K12 HS023000-03 from the Agency for Healthcare Research and Quality. JVF is supported by grant K23 HL118147-01 from the National Heart, Lung, and Blood Institute. SLTM is supported by grant U01FD004493 (Medical Device Epidemiology Network Methodology Center) from the FDA. IR is supported by an Early Career Fellowship cofunded by the National Health and Medical Research Council and the National Heart Foundation of Australia.
Disclosure
JSR receives support from the US FDA as part of the Centers for Excellence in Regulatory Science and Innovation program and from the Laura and John Arnold Foundation to support the Collaboration on Research Integrity and Transparency at Yale. JSR, NRD, HMK, and GMG receive research support through Yale University from Johnson and Johnson to develop methods of clinical trial data sharing. JSR and GMG receive research support from the Blue Cross Blue Shield Association to better understand medical technology evidence generation. JSR, JPC, NRD, SXL, SLTM, IR, HMK, and CSP work under contract to the Centers for Medicare and Medicaid Services to develop and maintain performance measures that are used for public reporting. JVF receives salary support from the American College of Cardiology NCDR, and modest consulting fees from Janssen Pharmaceuticals. RK is an employee of Medtronic Inc. DMD is an employee of the FDA. HMK chairs a cardiac scientific advisory board for United Health, is a participant/participant representative of the IBM Watson Health Life Sciences Board, is a member of the Advisory Board for Element Science and the Physician Advisory Board for Aetna, and is the founder of Hugo, a personal health-information platform. The authors report no other conflicts of interest in this work.
References
Kusumoto FM, Calkins H, Boehmer J, et al. HRS/ACC/AHA expert consensus statement on the use of implantable cardioverter-defibrillator therapy in patients who are not included or not well represented in clinical trials. Circulation. 2014;130:94–125. | ||
Tracy CM, Epstein AE, Darbar D, et al. 2012 ACCF/AHA/HRS focused update of the 2008 guidelines for device-based therapy of cardiac rhythm abnormalities: a report of the American College of Cardiology Foundation/American Heart Association Task Force on Practice Guidelines and the Heart Rhythm Society. [corrected]. Circulation. 2012;126:1784–1800. | ||
Yancy CW, Jessup M, Bozkurt B, et al. 2013 ACCF/AHA guideline for the management of heart failure: executive summary: a report of the American College of Cardiology Foundation/American Heart Association Task Force on Practice Guidelines. Circulation. 2013;128:1810–1852. | ||
Priori SG, Blomström-Lundqvist C, Mazzanti A, et al. 2015 ESC guidelines for the management of patients with ventricular arrhythmias and the prevention of sudden cardiac death. Eur Heart J. 2015;36:2793–2867. | ||
Ezekowitz JA, Rowe BH, Dryden DM, et al. Systematic review: implantable cardioverter defibrillators for adults with left ventricular systolic dysfunction. Ann Intern Med. 2007;147:251–262. | ||
Peterson PN, Varosy PD, Heidenreich PA, et al. Association of single- vs dual-chamber ICDs with mortality, readmissions, and complications among patients receiving an ICD for primary prevention. JAMA. 2013;309:2025–2034. | ||
Ranasinghe I, Parzynski CS, Freeman JV, et al. Long-term risk for device-related complications and reoperations after implantable cardioverter-defibrillator implantation: an observational cohort study. Ann Intern Med. 2016;165:20–29. | ||
Rathi VK, Krumholz HM, Masoudi FA, Ross JS. Characteristics of clinical studies conducted over the total product life cycle of high-risk therapeutic medical devices receiving FDA premarket approval in 2010 and 2011. JAMA. 2015;314:604–612. | ||
US Food and Drug Administration. Strengthening Our National System for Medical Device Postmarket Surveillance: Update and Next Steps. Silver Spring (MD): FDA; 2013. | ||
US Food and Drug Administration. Strengthening Our National System for Medical Device Postmarket Surveillance. Silver Spring (MD): FDA; 2012. | ||
Resnic FS, Normand SL. Postmarketing surveillance of medical devices: filling in the gaps. N Engl J Med. 2012;366:875–877. | ||
Resnic FS, Majithia A, Marinac-Dabic D, et al. Registry-based prospective, active surveillance of medical-device safety. N Engl J Med. 2017;376:526–535. | ||
Hlatky MA, Saynina O, McDonald KM, Garber AM, McClellan MB. Utilization and outcomes of the implantable cardioverter defibrillator, 1987 to 1995. Am Heart J. 2002;144:397–403. | ||
Al-Khatib SM, Lucas FL, Jollis JG, Malenka DJ, Wennberg DE. The relation between patients’ outcomes and the volume of cardioverter-defibrillator implantation procedures performed by physicians treating Medicare beneficiaries. J Am Coll Cardiol. 2005;46:1536–1540. | ||
Lampert R, Wang Y, Curtis JP. Variation among hospitals in selection of higher-cost, “higher-tech,” implantable cardioverter-defibrillators: data from the National Cardiovascular Data Registry (NCDR) Implantable Cardioverter/Defibrillator (ICD) Registry. Am Heart J. 2013;165:1015–1023.e2. | ||
Amin AP, Spertus JA, Cohen DJ, et al. Use of drug-eluting stents as a function of predicted benefit: clinical and economic implications of current practice. Arch Intern Med. 2012;172:1145–1152. | ||
Resnic FS, Gross TP, Marinac-Dabic D, et al. Automated surveillance to detect postprocedure safety signals of approved cardiovascular devices. JAMA. 2010;304:2019–2027. | ||
Kumar A, Matheny ME, Ho KK, et al. The data extraction and longitudinal trend analysis network study of distributed automated postmarket cardiovascular device safety surveillance. Circ Cardiovasc Qual Outcomes. 2015;8:38–46. | ||
Matheny ME, Normand SL, Gross TP, et al. Evaluation of an automated safety surveillance system using risk adjusted sequential probability ratio testing. BMC Med Inform Decis Mak. 2011;11:75. | ||
Vidi VD, Matheny ME, Donnelly S, Resnic FS. An evaluation of a distributed medical device safety surveillance system: the DELTA network study. Contemp Clin Trials. 2011;32:309–317. | ||
Krumholz HM. Big data and new knowledge in medicine: the thinking, training, and tools needed for a learning health system. Health Aff (Millwood). 2014;33:1163–1170. | ||
Hammill SC, Kremers MS, Stevenson LW, et al. Review of the registry’s fourth year, incorporating lead data and pediatric ICD procedures, and use as a national performance measure. Heart Rhythm. 2010;7:1340–1345. | ||
Masoudi FA, Ponirakis A, Yeh RW, et al. Cardiovascular care facts: a report from the National Cardiovascular Data Registry: 2011. J Am Coll Cardiol. 2013;62:1931–1947. | ||
Messenger JC, Ho KK, Young CH, et al. The National Cardiovascular Data Registry (NCDR) data quality brief: the NCDR data quality program in 2012. J Am Coll Cardiol. 2012;60:1484–1488. | ||
Brennan JM, Peterson ED, Messenger JC, et al. Linking the National Cardiovascular Data Registry CathPCI registry with Medicare claims data: validation of a longitudinal cohort of elderly patients undergoing cardiac catheterization. Circ Cardiovasc Qual Outcomes. 2012;5:134–140. | ||
Sidak Z. Rectangular confidence regions for the means of multivariate normal distributions. J Am Stat Assoc. 1967;62:626–633. | ||
Austin PC. Some methods of propensity-score matching had superior performance to others: results of an empirical investigation and Monte Carlo simulations. Biom J. 2009;51:171–184. | ||
Miller AL, Wang Y, Curtis J, Masoudi FA, Buxton AE, Wang TY. Optimal medical therapy use among patients receiving implantable cardioverter/defibrillators: insights from the National Cardiovascular Data Registry. Arch Intern Med. 2012;172:64–67. | ||
Gray R. A class of k-sample tests for comparing the cumulative incidence of a competing risk. Ann Stat. 1988;16:1141–1154. | ||
Matheny ME, Arora N, Ohno-Machado L, Resnic FS. Rare adverse event monitoring of medical devices with the use of an automated surveillance tool. AMIA Annu Symp Proc. 2007:518–522. | ||
Guyon I, Elisseeff A. An introduction to variable and feature selection. J Mach Learn Res. 2003;3:1157–1182. | ||
Hastie T, Tibshirani R, Friedman J. The Elements of Statistical Learning. New York: Springer; 2009. | ||
Zhu J, Rosset S, Hastie T, Tibshirani R. 1-Norm support vector machines. Adv Neural Inf Process Syst. 2004;16:49–56. | ||
Krucoff MW, Sedrakyan A, Normand SL. Bridging unmet medical device ecosystem needs with strategically coordinated registries networks. JAMA. 2015;314:1691–1692. | ||
Duke–Margolis Center for Health Policy. Better evidence on medical devices: a coordinating center for a 21st century national medical device evaluation system. 2016. Available from: https://healthpolicy.duke.edu/files/2016/03/med-device-report-web.pdf. Accessed April 10, 2016. | ||
Rising J, Moscovitch B. The Food and Drug Administration’s unique device identification system: better postmarket data on the safety and effectiveness of medical devices. JAMA Intern Med. 2014;174:1719–1720. | ||
Hauser RG. Here we go again: failure of postmarketing device surveillance. N Engl J Med. 2012;366:873–875. |
 © 2017 The Author(s). This work is published and licensed by Dove Medical Press Limited. The
full terms of this license are available at https://www.dovepress.com/terms
and incorporate the Creative Commons Attribution
- Non Commercial (unported, 3.0) License.
By accessing the work you hereby accept the Terms. Non-commercial uses of the work are permitted
without any further permission from Dove Medical Press Limited, provided the work is properly
attributed. For permission for commercial use of this work, please see paragraphs 4.2 and 5 of our Terms.
© 2017 The Author(s). This work is published and licensed by Dove Medical Press Limited. The
full terms of this license are available at https://www.dovepress.com/terms
and incorporate the Creative Commons Attribution
- Non Commercial (unported, 3.0) License.
By accessing the work you hereby accept the Terms. Non-commercial uses of the work are permitted
without any further permission from Dove Medical Press Limited, provided the work is properly
attributed. For permission for commercial use of this work, please see paragraphs 4.2 and 5 of our Terms.