Back to Journals » International Journal of Nanomedicine » Volume 10 » Issue 1
Blood group antigen studies using CdTe quantum dots and flow cytometry
Authors Cabral Filho P ![]() , Pereira M, Fernandes H, de Thomaz A, Lenz Cesar C, Santos B, Barjas-Castro M, Fontes A
, Pereira M, Fernandes H, de Thomaz A, Lenz Cesar C, Santos B, Barjas-Castro M, Fontes A ![]()
Received 13 March 2015
Accepted for publication 7 May 2015
Published 8 July 2015 Volume 2015:10(1) Pages 4393—4404
DOI https://doi.org/10.2147/IJN.S84551
Checked for plagiarism Yes
Review by Single anonymous peer review
Peer reviewer comments 5
Editor who approved publication: Dr Thomas Webster
Paulo E Cabral Filho,1 Maria IA Pereira,1 Heloise P Fernandes,2 Andre A de Thomaz,3 Carlos L Cesar,3 Beate S Santos,4 Maria L Barjas-Castro,2 Adriana Fontes1
1Departamento de Biofísica e Radiobiologia, Universidade Federal de Pernambuco, Recife, Pernambuco, 2Centro de Hematologia e Hemoterapia, Universidade Estadual de Campinas, Instituto Nacional de Ciência e Tecnologia do Sangue, Campinas, São Paulo, 3Departamento de Eletrônica Quântica, Instituto de Física Gleb Wataghin, Universidade Estadual de Campinas, Campinas, São Paulo, 4Departamento de Ciências Farmacêuticas, Universidade Federal de Pernambuco, Recife, PE, Brazil
Abstract: New methods of analysis involving semiconductor nanocrystals (quantum dots [QDs]) as fluorescent probes have been highlighted in life science. QDs present some advantages when compared to organic dyes, such as size-tunable emission spectra, broad absorption bands, and principally exceptional resistance to photobleaching. Methods applying QDs can be simple, not laborious, and can present high sensibility, allowing biomolecule identification and quantification with high specificity. In this context, the aim of this work was to apply dual-color CdTe QDs to quantify red blood cell (RBC) antigen expression on cell surface by flow cytometric analysis. QDs were conjugated to anti-A or anti-B monoclonal antibodies, as well as to the anti-H (Ulex europaeus I) lectin, to investigate RBCs of A1, B, A1B, O, A2, and Aweak donors. Bioconjugates were capable of distinguishing the different expressions of RBC antigens, both by labeling efficiency and by flow cytometry histogram profile. Furthermore, results showed that RBCs from Aweak donors present fewer amounts of A antigens and higher amounts of H, when compared to A1 RBCs. In the A group, the amount of A antigens decreased as A1 > A3 > AX = Ael, while H antigens were AX = Ael > A1. Bioconjugates presented stability and remained active for at least 6 months. In conclusion, this methodology with high sensibility and specificity can be applied to study a variety of RBC antigens, and, as a quantitative tool, can help in achieving a better comprehension of the antigen expression patterns on RBC membranes.
Keywords: erythrocytes, nanoparticles, ABO antigens, carbohydrates, covalent binding
Introduction
In recent years, several studies in the immunohematology field have been performed, mainly to investigate blood group genes.1 These immunohematological molecular analyses have been contributing to the study of genes related to antigens and also to the understanding of a great number of polymorphisms;2,3 nevertheless, they do not provide information regarding quantitative analyses, nor distribution, of the antigens on red blood cell (RBC) membrane surfaces.4 Analyses of antigen expressions are to this day performed by using methods based on hemagglutination, which can be performed in tube, microplate, and gel, with different potentiating reaction solutions.5 These nonquantitative methods with some improvements, though not new, have advantages such as low cost, simplicity, and enough sensibility and specificity to be used in the transfusional routine. Recently, cytometric assays have been used to quantify antigens and to investigate more complex cases.6 Thus, we herein propose to apply dual-color fluorescent CdTe quantum dots (QDs) as a complementary and alternative method for immunohematological investigation by flow cytometry, using the ABO blood group as a model. The application of the QDs can contribute not only to the quantification, but also to the understanding of expression patterns of antigens on the RBC surface.
Fluorescence-based assays present high sensitivity, which can provide the identification and quantification of biomolecules with high specificity. Moreover, new fluorescent probes, such as QDs, allow researchers to take advantage of the full potential of fluorescence.7 QDs present exceptional resistance to photobleaching and a high reactive surface, which enables conjugations with a variety of biomolecules.8–12 We show here that QDs are capable of recognizing and evaluating A, B, and H RBC antigens quantitatively; in addition, QDs can be applied in a direct fluoroimmunoassay in living cells, with no fixation agents, features related to immunohematology.
To evaluate A, B, and H antigen expression, we applied CdTe QDs covalently bound to the antibodies anti-A and anti-B, as well as to the lectin Ulex europaeus I (UEA I), also called anti-H. UEA I lectin can recognize the H antigen by L-fucose detection. CdTe QDs exhibit not only a narrow emission and a size-tunable fluorescence in a broad wavelength range (from green to infrared),13 but also a higher specificity and reproducibility for biological applications after bioconjugation assays, when compared to CdS/Cd(OH)2 QDs already used by some of us in previous work.14 The passivation of CdS/Cd(OH)2 QDs is labile and can be removed by bioconjugation procedures decreasing emission quality due to the exposure of surface defects. Moreover, to bioconjugate CdS/Cd(OH)2 QDs, stabilized with polyphosphate ions, is also necessary for growing a polymeric shell and promoting covalent couplings with biomolecules is also necessary, turning this process more laborious. Effective bioconjugations are still considered a challenge as they have to preserve the characteristics of the complete set: the QDs’ fluorescence and biomolecule biochemical functions.9 In this work, we also associated electrophoresis, fluorescence microplate assay, fluorescence correlation spectroscopy (FCS), and inhibition assay experiments to assure effective QDs bioconjugations.
There are only a few previous reports that have investigated some blood antigens by flow cytometry using standard organic dyes.15,16 However, these studies were usually performed in fixed cells and by indirect fluoroimmunoassays, using secondary antibodies, which can make the experiments more laborious and less specific. Our methodology with CdTe QDs enabled us to quantitatively evaluate antigens on RBC membranes in A1, A2, B, A1B, O, and in some Aweak groups both by profile and by labeling efficiency. Furthermore, we have also been able to correlate A and H antigen expression in A RBCs. We believe we show a simple method, not laborious and with high sensitivity, which allows antigen identification and quantification with high specificity and reproducibility. This approach can be used as a complementary tool for improving the comprehension of RBC biology in blood systems.
Experimental procedures
Synthesis and characterization of CdTe QDs
Aqueous colloidal dispersions of orange and green CdTe QDs were synthesized by adapting a previously established method reported by some of us.17–19 Briefly, QDs were prepared by addition of Te2- (obtained from metallic tellurium at 10−4 mol) (Sigma Aldrich Co., St Louis, MO, USA) in a 0.01 M CdCl2 or Cd(ClO4)2 (Sigma Aldrich Co.) solution with pH >10 in the presence of 3-mercaptossuccinic acid (MSA) (Sigma Aldrich Co.) as stabilizing agent. We used a 2:1:2.4 molar ratio of Cd/Te/MSA for orange-emission QDs and 5:1:6.0 for green-emission QDs. The Te2- aqueous solution was prepared by reducing metallic tellurium with NaBH4 (Sigma Aldrich Co.) in a 1:30 molar ratio of Te/NaBH4, respectively, at a high pH using NaOH and under nitrogen-saturated atmosphere. The growth of the QDs proceeded, in inert atmosphere, with stirring at 90°C for 2 hours or 8 hours for green or orange emission QDs, respectively. After being synthesized, QDs were characterized by absorption (Evolution 600 UV-Vis; Thermo Fisher Scientific, Waltham, MA, USA) and emission spectroscopy (LS 55 spectrometer; PerkinElmer Inc., Waltham, MA, USA). The fluorescence spectra were obtained at 365 nm excitation. Structural characterizations of QDs obtained from a very similar procedure have been previously described by some of us.19
Blood samples
RBCs from A1, A2, B, A1B, Aweak (A3, Ax, and Ael), as well as O blood donors were obtained at the Hematology and Transfusion Center of UNICAMP (Campinas, São Paulo, Brazil). RBC samples (A1, n=18; A2, n=10; A3, n=1; Ax, n=2; Ael, n=1; B, n=10; A1B, n=6; and O, n=10) were collected in a 4 mL ethylenediaminetetraacetic acid (EDTA) anticoagulant tube from healthy donors who had had their blood previously serologically typed. RBC phenotyping was performed using monoclonal anti-A (clone: 9113D10, lot: 71EF01EA; Fresenius Kabi [Barueri, São Paulo, Brazil]) and anti-B antibodies (clone: 9621A8, lot: 08D01A21; Fresenius Kabi), as well as anti-A1 (reference: 116005, lot: 11691-B3; Lorne Laboratories) and anti-H or UEA I lectin (reference 115002, lot: 11568-A1; Lorne Laboratories). A2 phenotype was differentiated from A1 group by using both anti-A antibody and anti-A1 lectin (Dolichos biflorus), as A2 presents agglutination for the anti-A antibody, though not for anti-A1 lectin.20
QD bioconjugation
Orange QDs were conjugated to anti-A (clone: 9113D10, lot: 71EF01EA; Fresenius Kabi) or anti-B (clone: 9621A8, lot: 08D01A21; Fresenius Kabi) by using N-ethyl-3-(3-dimethylaminopropyl)carbodiimide hydrochloride (EDC) (Fluka) and N-hydroxysulfosuccinimide sodium salt (Sulfo-NHS) (Sigma Aldrich Co.) as coupling reagents. We first adjusted the pH of 2 mL of CdTe QDs (3 μM) to 5.5 by using MSA at 4.9% (w/v). We then added 1 mL of EDC (at 0.4 mg·mL−1) and, after 5 minutes, 1 mL of Sulfo-NHS at 1.1 mg·mL−1 to the QDs sample.7,21 Fifteen minutes later, we added 40 μL of anti-A antibody or anti-B antibody to the system (the same antibodies described in the section “Blood samples”).
Green QDs were also covalently bonded to the UEA I lectin, also known as anti-H, obtained from Sigma Aldrich Co. (reference L5505) by using EDC and Sulfo-NHS. To this end, we used 1 mL of green QDs (4.5 μM), 1 mL of EDC (at 4.0 mg·mL−1), and 1 mL of Sulfo-NHS (at 10 mg·mL−1). At the end of the process, we inserted 200 μL of UEA I (at 0.5 mg·mL−1) into the system.
Prior to RBC labeling, systems were incubated with 50 μL of Tris base (at 1 mM) for 2 hours under slow agitation. This procedure was used to quench the free carboxyl groups of nonconjugated QDs to minimize unspecific targets.
QD bioconjugation characterization
FCS analysis
FCS analysis was performed in a confocal microscopy (LSM 780 equipped with the software ZEN; Carl Zeiss Meditec AG, Jena, Germany) by using 40× water immersion objective (NA =1.0, WD =2.5 mm).22 To obtain the correlation curves, bare orange QDs and their bioconjugates with anti-A (or anti-B) as well as bare green QDs and their bioconjugates with anti-H were, respectively, excited by a green (λ=514 nm) and a blue (λ=488 nm) laser, both with 1 μW. The pinhole aperture, in both cases, was set as 35 μm. Ten correlation curves were obtained for each sample. From the correlation curves, we obtained the hydrodynamic radius (R) for each system using Equation 1:
| (1) |

where kB is a Boltzmann constant, η is the medium viscosity, and T is the temperature. We adopted T≈303 K as the temperature of the sample under laser irradiation and η as the water viscosity at this temperature (η=7.98×10⁻⁴ Pa·s). Diffusion time τD was extracted from the correlation curves and the lateral radius wx of the focal volume (300 nm for 514 nm excitation and 260 nm for 488 nm excitation), which was obtained by calibrating the system with a solution of rhodamine B (at 10 nM).23 As conjugated QDs show higher diffusion times when compared to bare QDs,22 it is possible to use the R measurements to confirm the bioconjugation. The concentrations of QDs and conjugates used for FCS experiments were of the order of 10–200 nM.
Electrophoresis
QD conjugations to anti-A and anti-B were further confirmed by polyacrylamide gel electrophoresis (PAGE) technique. For this, we used a native and discontinuous PAGE with stacking gel of 6% and main gel of 9%. After polymerization, aliquots of each anti-A, QD, and QDs-anti-A sample were mixed with glycerol at ratio 5:1 (v/v) and then loaded into the gel wells. The systems were immersed in electrophoresis running buffer and PAGE proceeded at constant voltage (100 V) for 90 minutes. We evaluated the conjugation by comparing the running profiles of the samples by observing fluorescence signals in an L-Pix EX transilluminator (Loccus Biotecnologia), and, afterward, by using the Coomassie blue dye (R 250) (Sigma Aldrich Co.) that binds to proteins. The same procedure was performed for anti-B and their conjugates.24
Fluorescence microplate assay
This method, developed by our group, is based on the presence or absence of fluorescence signals from samples placed in a fluorescence plate reader.25 For this, QDs with coupling agents (EDC and Sulfo-NHS), the proteins (anti-A and anti-B antibodies), as well as the bioconjugates (QDs-anti-A and QDs-anti-B) were placed in a polystyrene microplate (black 96-well Optiplate F HB microplates; PerkinElmer Inc.). All systems were added in triplicate and the plate was incubated for 2 hours in an incubator (water bath, humid chamber) at 37°C. After incubation, the plate was washed three times with phosphate-buffered saline (1×).
Fluorescence measurements were performed using a WALLAC 1420 plate reader with the Victor2 (PerkinElmer Inc.) software. The excitation band pass filter used was F405 (405 nm/5 nm) and the emission band pass filter was F595 (595 nm/30 nm). The acquisition time was 1 second. The lamp was set to 20,000 and normal slits were used for excitation of samples and for collecting the emission.
In this method, as the nonconjugated QDs do not have affinity for polystyrene, they are removed after washing. The nonremoval of the proteins presented no interference as these have no significative fluorescence under the conditions used in the experiment; only bioconjugates are capable of showing a significantly detectable signal. For this reason, QDs with coupling agents and bare proteins were used as our controls and the QD–protein conjugates were the systems tested. The intensity of the detected signal is proportional to bioconjugation efficiency: the higher the signal, the more efficient the bioconjugation.
The relative fluorescence intensity (RF) of bioconjugates was calculated by using the following Equation:
| (2) |
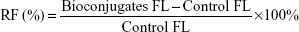
where Bioconjugates FL is the average fluorescence intensity of the QD–biomolecule conjugates and Control FL is the average controls signal. According to Carvalho et al25 the bioconjugation was considered efficient when the systems showed an RF higher than 100% compared to their controls.
Inhibition of lectin assay
In order to prove that labeling results were due to lectin carbohydrate specificity, lectin binding inhibition assays26 were accomplished by incubating QDs-anti-H with 0.3 M L-fucose for 1 hour at 25°C prior to their incubation with O RBCs.
Flow cytometric analysis of RBC samples
To obtain RBCs, the blood collected in EDTA tubes was centrifuged at 1,700× g for 5 minutes. The pellet was then further washed three times in saline at 450× g for 2 minutes. A sample containing RBCs in saline at 1% (v/v) was then prepared. This procedure was used for all analyses. RBCs were incubated at 37°C for 1 hour for all bioconjugates.
Type A1 and B RBCs were incubated with QDs-anti-A and QDs-anti-B, respectively, using a proportion of 3:1 v/v (conjugated QDs:cells). Type O RBCs were incubated with both bioconjugates and used as the negative control, as they do not present A or B antigens in their membranes.
Type O, A1, and B RBCs were also incubated with QDs-anti-H using a proportion of 1:1 v/v (conjugated QDs:cells). In this case, types A1 and B were used as controls as they show a very low H antigen expression.
Following ABO experiments, types A2 and Aweak were incubated with QDs-anti-A and QDs-anti-H, using the same procedure as aforementioned, to identify the N-acetylgalactosamine and L-fucose carbohydrates present on RBC membranes.
RBCs were analyzed by flow cytometry (FACSCalibur or Accuri C6; Becton Dickinson). The software programs used for data processing were CellQuest™ or BD Accuri C6 Software (Becton Dickinson) and FlowJo vX. Twenty thousand events (gated) were acquired. The fluorescence was excited at λ=488 nm and measured with an FL1 filter (530 nm/15 nm) or FL2 filter (585 nm/21 nm) for green and orange QDs, respectively.
Results and discussion
QD optical characterization
All QDs employed in the experiments were characterized by absorption and emission spectra, shown in Figure 1. Green (Figure 1A) and orange (Figure 1B) QDs presented a maximum emission peak at 548 nm (full width at half maximum =53 nm) and 610 nm (full width at half maximum =48 nm), respectively. By using the first maxima of the absorption spectra, at 496 nm and 559 nm approximately, the average diameters were estimated at 2.6 nm and 3.1 nm for green and orange QDs, respectively.13,27 We estimated the concentration of nanoparticles as 4.5 μM for green QDs and 3 μM for orange QDs using the average sizes, Beer–Lambert law, the absorption values at the first maxima, and the extinction coefficient obtained by Yu et al.28 Details of this type of calculation can be found in previous study reported by some of us.19
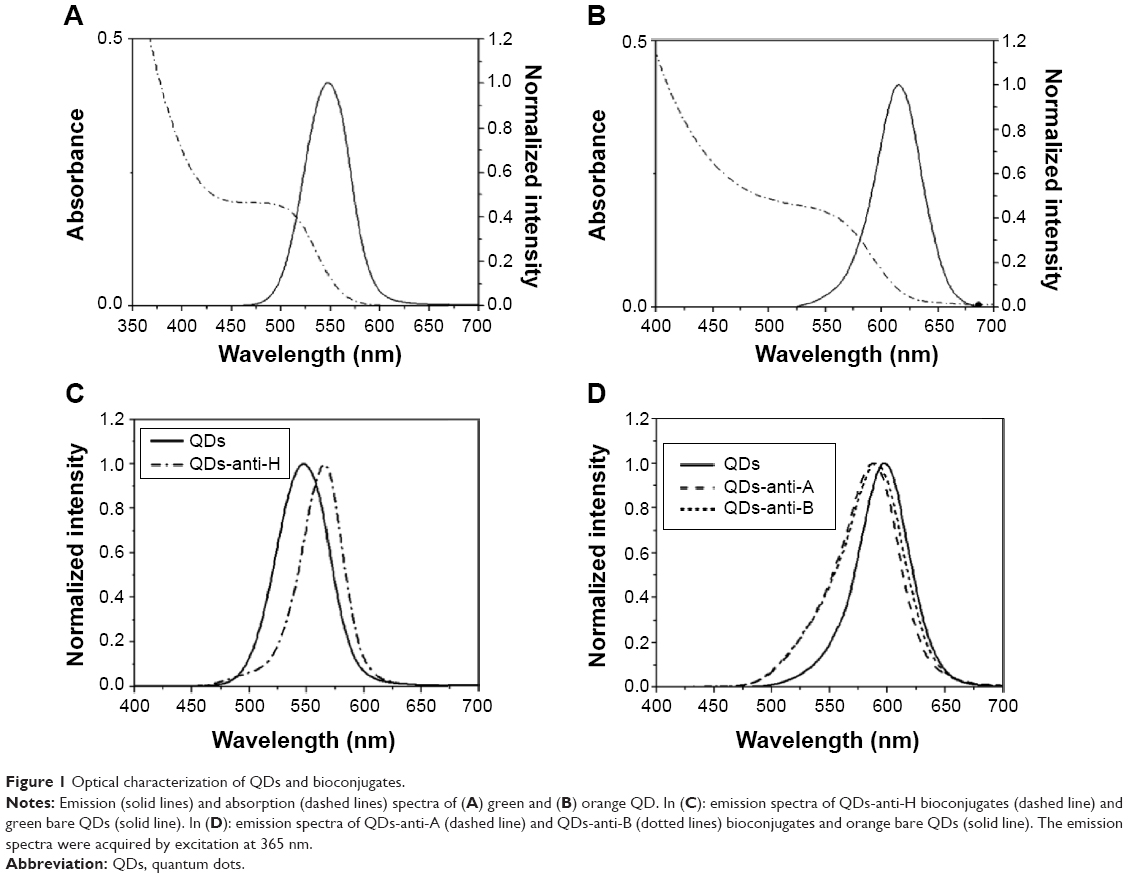 | Figure 1 Optical characterization of QDs and bioconjugates. |
Figure 1 shows that neither orange QDs-anti-A nor QDs-anti-B presented considerable changes in the optical properties when compared to bare QDs (Figure 1D). The emission profile was similar for both conjugates after the bioconjugation process. Green QDs-anti-H (Figure 1C) presented a red shift of approximately 20 nm and orange QDs with anti-A and anti-B showed a small blue shift of approximately 5 nm. This is probably due to some modifications on the QDs’ surfaces caused by the binding of these biomolecules. In addition, the higher shift present for QDs-anti-H can be justified by the excess of EDC used, more than 20×, when compared to the anti-A or anti-B antibodies’ conjugation.
Bioconjugation analysis
A thorough characterization of the bioconjugation is required to avoid artifacts and nonspecific results. For this reason, this section is devoted to the characterization of our bioconjugation procedure.
A previous analysis of the bioconjugates, performed by us in the beginning of this study, demonstrated that the labeling of A RBCs presented more specificity when 15-day unblocked QDs-anti-A were used, indicating that bioconjugation was more efficient for this period of time. Therefore, we decided to use all conjugates at least after 15 days of preparation and also blocked by Tris.
QDs bioconjugated to monoclonal antibodies
In fluorescence microplate assay, control A: bare QDs (with coupling agents) and anti-A antibodies, showed an average signal of 296 arbitrary units and control B: bare QDs (with coupling agents) and anti-B antibodies presented an average signal of 311 arbitrary units. As QDs are removed after washing and antibodies do not present considerable autofluorescence at excitation and emission wavelengths used for fluorescence microplate assays (λexc=405 nm and λem=595 nm), we can consider this signal as practically being background detection. On the other hand, QDs-anti-A and QDs-anti-B showed an average signal of 9,261 and 7,836 arbitrary units, respectively. These results correspond to an RF of 3,028% for QDs-anti-A and 2,420% for QDs-anti-B, indicating efficient bioconjugation as shown in Table 1.
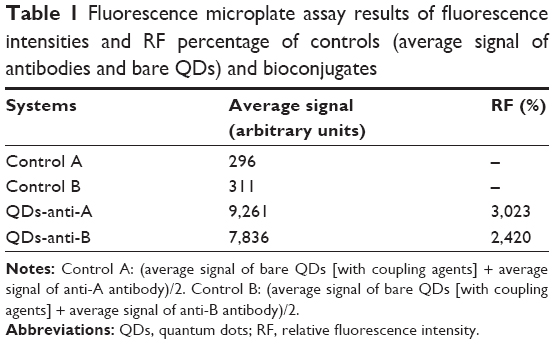 | Table 1 Fluorescence microplate assay results of fluorescence intensities and RF percentage of controls (average signal of antibodies and bare QDs) and bioconjugates |
After the analysis by fluorescence microplate assay, we further confirmed bioconjugation by electrophoresis experiments (Figure 2). The proteins (Figure 2A) exhibited differential migration from nonconjugated (bare) QDs (Figure 2B). Furthermore, QDs conjugated with anti-A antibody (Figure 2C) presented a slow migration when compared with nonconjugated QDs. The electrophoresis gel also demonstrated that QDs were successfully conjugated to anti-A antibody. The same profile was observed when orange QDs were conjugated to anti-B (data not shown).
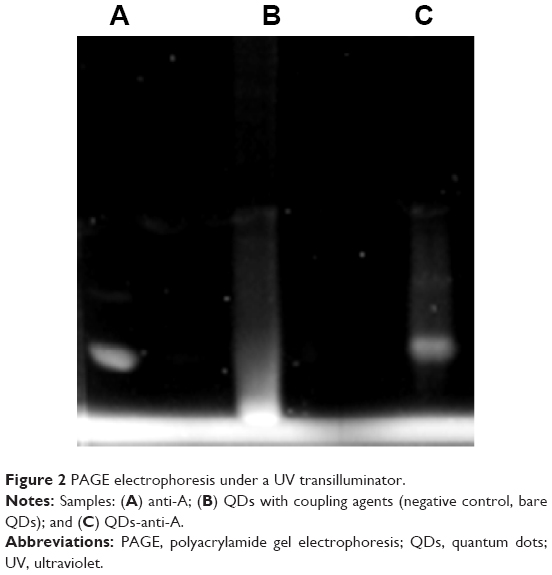 | Figure 2 PAGE electrophoresis under a UV transilluminator. |
Fluorescence microplate assay and electrophoresis indicate a successful conjugation to QDs-anti-A and QDs-anti-B; however, bioconjugations were further analyzed by FCS measurements. From the correlation curves shown in Figure 3, the average diffusion time for bare orange QDs was calculated as τ=152.3 μs, while for the QDs-anti-A and QDs-anti-B this was τ=824.6 μs and τ=747.0 μs, respectively. By using these diffusion times and Equation 1, we obtained the QDs’ R. Bare orange QDs showed an average hydrodynamic diameter of D=3.8 nm, QDs-anti-A of D=20.4 nm, and QDs-anti-B of approximately D=18.5 nm.
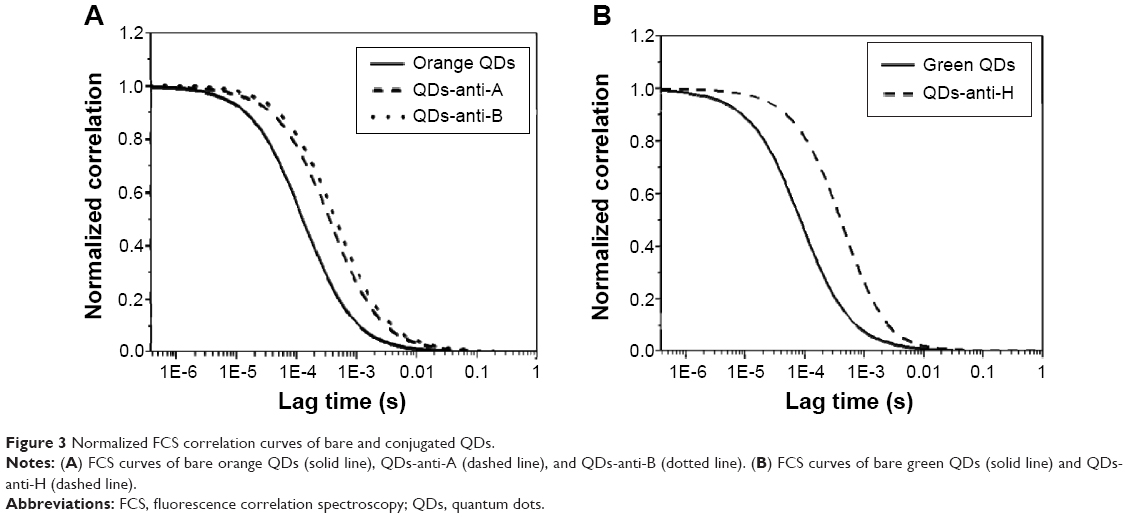 | Figure 3 Normalized FCS correlation curves of bare and conjugated QDs. |
As expected, bare QD sizes, obtained by FCS analysis, were higher than diameters obtained by absorption spectra. This occurs as the R is also related to the charges and profiles of the QD surfaces, while the absorption is an optical property related to the QD core. All bioconjugates presented higher diameters than bare QDs. The results show that anti-A and anti-B antibodies were bound to QDs, a further confirmation of the efficacy of the bioconjugation. Typical original FCS curves and fittings are shown in Figure S1.
QDs bioconjugated to anti-H lectin
Bare green QDs showed an average diffusion time of τ=70.8 μs, while the QDs-anti-H diffusion time was 688 μs. Bare green QDs had an average hydrodynamic diameter D=2.9 nm and QDs-anti-H of D=28.9 nm, also confirming conjugation. Typical original FCS curves and fittings are shown in Figure S1.
The carbohydrate inhibition assay showed that QDs-anti-H were not able to label O RBCs, confirming the bioconjugation. The fluorescence microplate assay with QDs-anti-H was not capable of discriminating bare QDs from conjugates, probably as lectin has different interactions with polystyrene. Furthermore, in the electrophoresis with QDs-anti-H, the visualization of the bands of the QDs with coupling agents was not possible. However, both FCS analysis and the inhibition carbohydrates assay demonstrated that anti-H was successfully conjugated to QDs.
Flow cytometric analysis of RBC samples
ABO blood group incubated with QDs-anti-A and QDs-anti-B
Table 2 shows the percentage of RBCs labeled with their correspondent conjugates. Our results demonstrated that O RBCs did not present considerable labeling with any of the monoclonal antibodies. In both cases, using QDs-anti-A or QDs-anti-B, labeled O RBCs were less than 5%. These results suggest that conjugated QDs were successfully blocked and the labeling was specific and reproducible.
 | Table 2 Average percentage of ABO blood group red blood cells labeled with conjugated QDs |
A1B RBCs presented in their membranes two types of carbohydrates, N-acetylglucosamine (B antigen) and N-acetylgalactosamine (A antigen), thus A1B showed 98.8% of cells labeled with QDs-anti-A and 92% with QDs-anti-B. The cytometry showed that an average of 96.7% (varying from 95% to 98.5%) of A1 RBCs were labeled with QDs-anti-A. For B RBCs incubated with QDs-anti-B, the analysis showed an average of 94.7% (varying from 91% to 98.8%) of cells labeled by these bioconjugates.
Bare QDs did not label cells nonspecifically. All results demonstrated that conjugates labeled RBCs of ABO blood groups specifically and efficiently.
Figure 4 shows typical flow cytometric profiles of A1, B, A1B, and O RBCs when incubated with QDs-anti-A or QDs-anti-B. Type O RBCs incubated with QDs-anti-A or QDs-anti-B showed the same pattern presented by control RBCs (RBCs without QDs). Our results agree with those presented by Aki et al15 and by Hult and Olsson.16 The percentage of labeled RBCs and the labeling profile were similar to ours in both studies, where the authors analyzed ABO antigens stained by a secondary antibody conjugated to organic dyes using an indirect immunoassay. The overall results demonstrated that a direct immunofluorescence assay using our nanotechnology methodology is capable of differentiating ABO RBC groups. The small deviations presented in Table 2 reflect the small differences of antigen expressions that can be found for the same blood group, due to the intrinsic variability of biological systems associated to the error presented by flow cytometry analysis of approximately 5%.
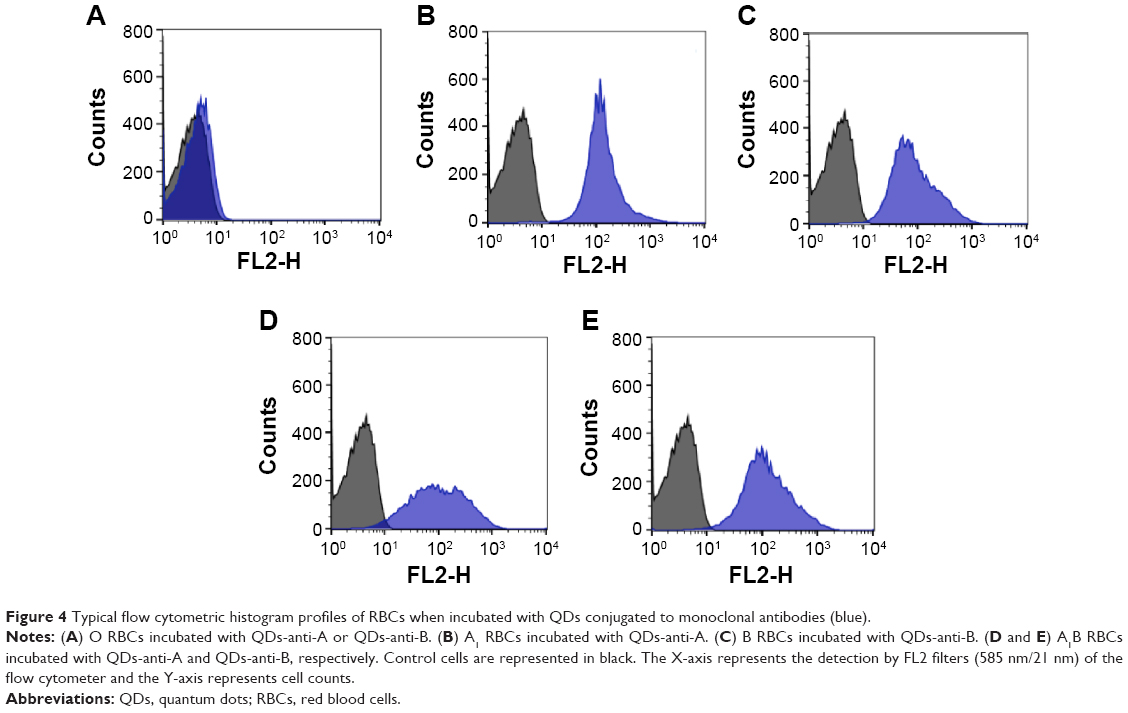 | Figure 4 Typical flow cytometric histogram profiles of RBCs when incubated with QDs conjugated to monoclonal antibodies (blue). |
ABO blood group incubated with QDs-anti-H
Additionally, we investigated the presence or absence of H antigens by L-fucose analysis in ABO blood group. The average percentages of labeled cells are shown in Table 2. O type RBCs had the highest amount of L-fucose on the membrane; approximately 85% (varying from 80% to 95%) of the cells presented H antigens on their surfaces. O RBCs showed a heterogeneous distribution of L-fucose on cell membranes. In A1, B, and A1B groups, all or almost all of the L-fucose molecules were converted into A or B antigens; in this way, a small average labeling of <10% (A1, 8% [varying from 4% to 10%]; B, 7.9% [4% to 12%]; and A1B, <4%) was observed. Typical histogram profiles are shown in Figure 5. As A1, B, and A1B showed similar cytometric results, we presented only the data for the A1 group (Figure 5B).
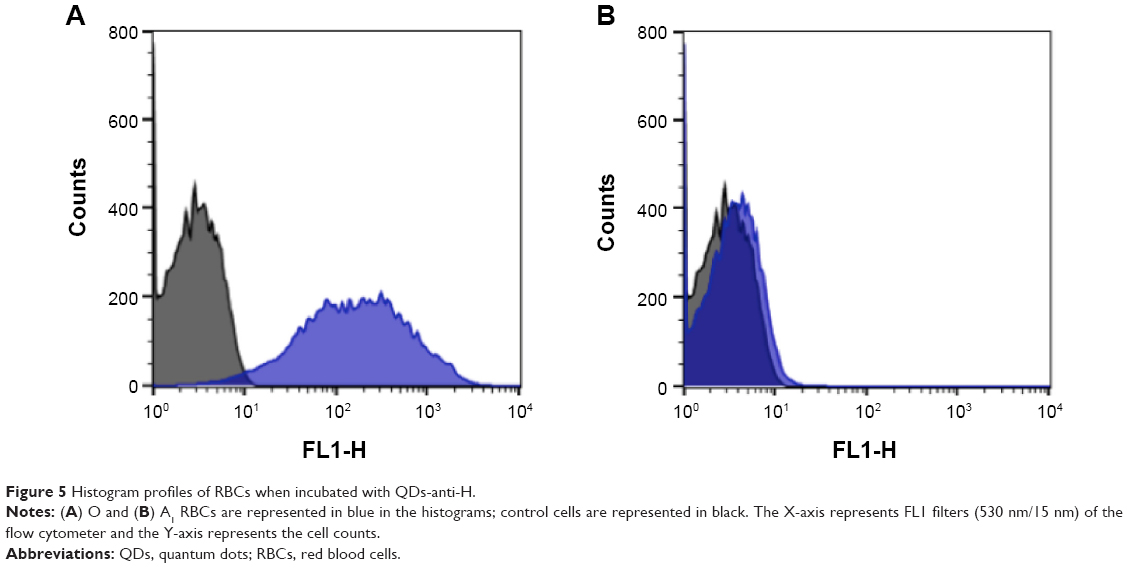 | Figure 5 Histogram profiles of RBCs when incubated with QDs-anti-H. |
A2 and Aweak groups incubated with QDs-anti-A
A2 and some Aweak phenotypes (phenotyped as A3, AX, and Ael) were incubated with QDs-anti-A. Figure 6 shows typical histograms of A2 and Aweak types. The A2 subgroup presented an average percentage of labeled cells of 68% (varying from 66% to 70%) and A3 showed approximately 11% of labeled cells, while AX showed 5% and Ael presented similar quantities as the AX subgroup.
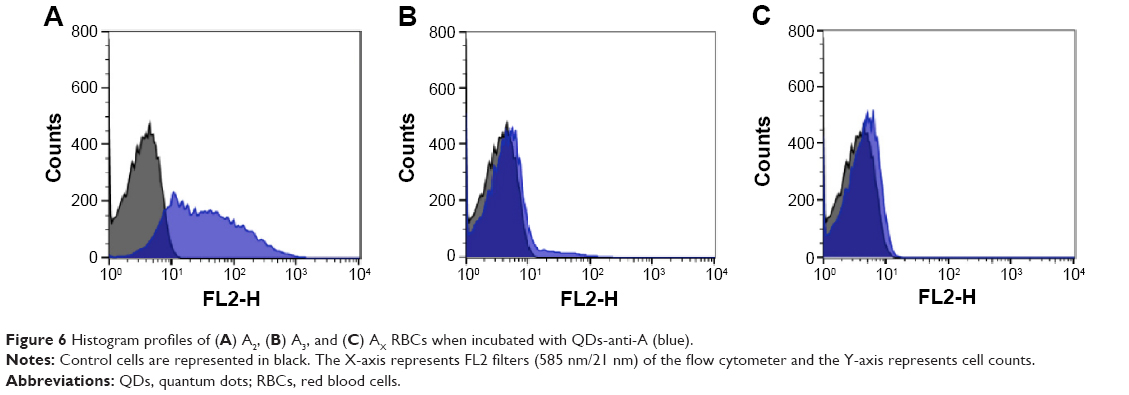 | Figure 6 Histogram profiles of (A) A2, (B) A3, and (C) AX RBCs when incubated with QDs-anti-A (blue). |
According to the histogram profile of A2 (Figure 6), two populations were observed after incubation with QDs-anti-A: 1) a set of unlabeled cells (approximately 35%), probably of RBCs with very little or without A antigens on the cell surface, and 2) a set of labeled cell population (approximately 65%) that presented A antigens on cell surface. The subgroup, serologically defined as A3, with QDs-anti-A, presented a more expressive unlabeled cell population (approximately 88%), while a smaller amount of cells showed a discrete labeling (approximately 12%). The Aweak samples, serologically defined as AX and Ael, showed a similar profile of type O RBCs when incubated with QDs-anti-A. In this case, we could not differentiate them by flow cytometry analysis. However, we were able to differentiate them from the other phenotypes.
These results of labeling and profile obtained for Aweak and A2 agree with those presented by Hult and Olsson16 and with the hemagglutination patterns of serological tests.5 Our results for A3 are also consistent with the mixed-field pattern displayed after agglutination reaction of RBCs with anti-A monoclonal antibody.4,5
A2 and Aweak groups incubated with QDs-anti-H
The flow cytometric patterns of Aweak phenotypes are depicted in Figure 7B. AX and Ael presented only 30% of labeling, approximately. AX showed a similar profile to Ael, with a smaller amount of cells labeled by QDs-anti-H. These results are in accordance with the serological results. However, it is not possible to quantify the amount of H antigens in these cells using serological hemagglutination reactions.5
 | Figure 7 Histogram profiles of (A) A2 and (B) AX RBCs when incubated with QDs-anti-H (blue). |
Figure 7A shows the flow cytometric pattern of A2 phenotype. According to the flow cytometry analysis, A2 showed approximately 70% (varying from 60% to 80%) of RBCs targeted by the QDs-anti-H conjugates. These results can be explained by the fact that QDs-UEA I recognize the L-fucose of H antigens that have not yet been converted, as well as the L-fucose of the A2 antigen, which is exposed in the structure of this biomolecule.29 This observation can be supported by the similar labeling obtained by the QDs-anti-A and QDs- UEA I in A2. Further studies are needed to better elucidate this observation. Furthermore, in our work, we used the anti-H lectin from Sigma Aldrich Co. that can be more efficient in recognizing L-fucose when compared with the anti-H used in serological routine.
Conclusion
The experiments showed that anti-A, anti-B, and anti-H biomolecules conjugated to QDs did not lose their ability to efficiently recognize their respective targets on RBC surfaces. In this work, we used commercial and routinely applied monoclonal antibodies to label living RBCs, with no fixation procedures. Moreover, bioconjugates remained fluorescent, stable, and specifically labeling the cells for at least 6 months. This was confirmed by the results obtained after incubating A1, B, and O RBCs with their respective bioconjugates, which showed approximately 100% of cells labeled by flow cytometry. The results are similar to those obtained with bioconjugates of 15 days. This gives rise to the possibility of using these bioconjugates in hematology centers with good versatility.
We have been able to differentiate the ABO groups by using QDs-anti-A, QDs-anti-B, and QDs-anti-H. Likewise, we were also able to differentiate some A phenotypes. The QDs conjugated to anti-H were important tools to correlate A and H antigens in A blood group. Type A2 was less labeled by QDs-anti-A when compared to type A1, while the opposite was shown for QDs-(UEA I) conjugate results. As discussed before, QDs-(UEA I) recognized in A2 the L-fucose of H antigens that were not yet converted, as well as the L-fucose of the A2 antigen, which is exposed in the structure of this biomolecule, thus justifying the labeling observed with these bioconjugates. Our results still suggest that RBCs from types AX and Ael have fewer amounts of both H and A antigens. In the A group, the amount of A antigens decrease in the order A1 > A3 > AX = Ael. On the other hand, H antigens decrease in the order AX = Ael > A1. Further studies are needed in this field, mainly those that correlate molecular biology with immunophenotyping techniques.
Taken together, these results demonstrate a simple, uncomplicated, specific, quantitative, and reproducible methodology that can be used as complementary and versatile analysis for the comprehension of RBC biology.
Acknowledgments
The authors are grateful to Coordenação de Aperfeiçoamento de Pessoal de Nível Superior (CAPES), Conselho Nacional de Desenvolvimento Científico e Tecnológico (CNPq), and Fundação de Amparo à Ciência e Tecnologia do Estado de Pernambuco (FACEPE) for financial support and student fellowships. We are grateful for the access to equipment and assistance provided by the National Institute of Science and Technology on Photonics Applied to Cell Biology (INFABIC) at the State University of Campinas. INFABIC is co-funded by Fundação de Amparo a Pesquisa do Estado de São Paulo (FAPESP) (08/57906-3) and CNPq (573913/2008-0). We are also grateful to the National Institute of Science in Photonics (INFo) for financial resources. Additionally, we would like to thank Aggeu Magalhães of FIOCRUZ and Dr Irene Santos of Centro de Hemoterapia e Transfusão da Universidade de Campinas for the flow cytometry measurements and Fundação de Hematologia e Hemoterapia de Pernambuco (HEMOPE).
Disclosure
The authors report no conflicts of interest in this work.
References
Patnaik SK, Helmberg W, Blumenfeld OO. BGMUT database of allelic variants of genes encoding human blood group antigens. Transfus Med Hemother. 2014;41(5):346–351. | ||
Daniels G, Castilho L, Flegel W, et al; International Society of Blood Transfusion Committee on Terminology for Red Blood Cell Surface Antigens. International Society of Blood Transfusion Committee on terminology for red blood cell surface antigens: Macao report. Vox Sang. 2009;96(2):153–156. | ||
Daniels G. The molecular genetics of blood group polymorphism. Hum Genet. 2009;126(6):729–742. | ||
Svensson L, Bindila L, Ångström J, et al. The structural basis of blood group A-related glycolipids in an A3 red cell phenotype and a potential explanation to a serological phenomenon. Glycobiology. 2011;21(2):162–174. | ||
Thakral B, Saluja K, Bajpai M, Sharma RR, Marwaha N. Importance of weak ABO subgroups. Lab Med. 2005;36:32–34. | ||
Jaso JM, Wang SA, Jorgensen JL, Lin P. Multi-color flow cytometric immunophenotyping for detection of minimal residual disease in AML: past, present and future. Bone Marrow Transplant. 2014;49(9):1129–1138. | ||
Wang Y, Chen L. Quantum dots, lighting up the research and development of nanomedicine. Nanomedicine. 2011;7(4):385–402. | ||
Sukhanova A, Nabiev I. Fluorescent nanocrystal quantum dots as medical diagnostic tools. Expert Opin Med Diagn. 2008;2(4):429–447. | ||
Medintz IL, Uyeda HT, Goldman ER, Mattoussi H. Quantum dot bioconjugates for imaging, labelling and sensing. Nat Mater. 2005;4(6):435–446. | ||
Michalet X, Pinaud FF, Bentolila LA, et al. Quantum dots for live cells, in vivo imaging, and diagnostics. Science. 2005;307(5709):538–544. | ||
Alivisatos P. The use of nanocrystals in biological detection. Nat Biotechnol. 2004;22(1):47–52. | ||
Santos BS, Farias PM, Fontes A. Semiconductor quantum dots for biological applications. In: Henini M, editor. Handbook of Self Assembled Semiconductor Nanostructures for Novel Devices in Photonics and Electronics. Oxford: Elsevier; 2008:773–798. | ||
Rogach AL, Franzl T, Klar TA, et al. Aqueous synthesis of thiol-capped CdTe nanocrystals: state-of-the-art. J Phys Chem C Nanomater Interfaces. 2007;111(40):14628–14637. | ||
de Farias PM, Santos BS, de Menezes FD, et al. Core−shell CdS/Cd(OH)2 quantum dots: synthesis and bioconjugation to target red cells antigens. J Microsc. 2005;219(Pt 3):103–108. | ||
Aki K, Izumi A, Hosoi E. The evaluation of histo-blood group ABO typing by flow cytometric and PCR-amplification of specific alleles analyses and their application in clinical laboratories. J Med Invest. 2012;59(1–2):143–151. | ||
Hult AK, Olsson ML. Many genetically defined ABO subgroups exhibit characteristic flow cytometric patterns. Transfusion. 2010;50(2):308–323. | ||
Santos BS, Farias PMA, Menezes FD, et al. New highly fluorescent biolabels based on II–VI semiconductor hybrid organic–inorganic nanostructures for bioimaging. Appl Surf Sci. 2008;255(3):790–792. | ||
de Menezes FD, Brasil AG Jr, Moreira WL, et al. CdTe/CdS core shell quantum dots for photonic applications. Microelectronics J. 2005;36(11):989–991. | ||
Tenório DP, Andrade CG, Cabral Filho PE, et al. CdTe quantum dots conjugated to concanavalin A as potential fluorescent molecular probes for saccharides detection in Candida albicans. J Photochem Photobiol B. 2015;142:237–243. | ||
Batissoco AC, Novaretti MCZ. Aspectos moleculares do sistema sanguíneo ABO. Rev Bras Hematol Hemoter. 2003;25:47–58. Portuguese. | ||
Hermanson GT. Zero-length crosslinkers. In: Bioconjugate Techniques. 2nd ed. New York: Academic Press; 2008:215–233. | ||
de Thomaz AA, Almeida DB, Cesar CL. Measuring the hydrodynamic radius of quantum dots by fluorescence correlation spectroscopy. In: Fontes A, Santos BS, editors. Quantum Dots: Applications in Biology: Springer; 2014:85–91. | ||
Shao L, Dong C, Sang F, Qian H, Ren J. Studies on interaction of CdTe quantum dots with bovine serum albumin using fluorescence correlation spectroscopy. J Fluoresc. 2009;19(1):151–157. | ||
Walker JM, editor. Nondenaturing polyacrylamide gel electrophoresis of proteins. In: The Protein Protocols Handbook. 2nd ed. Totowa: Humana Press; 2002:57–60. | ||
Carvalho KH, Brasil AG Jr, Cabral Filho PE, et al. Fluorescence plate reader for quantum dot-protein bioconjugation analysis. J Nanosci Nanotechnol. 2014;14(5):3320–3327. | ||
Andrade CG, Cabral Filho PE, Tenório DP, et al. Evaluation of glycophenotype in breast cancer by quantum dot-lectin histochemistry. Int J Nanomedicine. 2013;8:4623–4629. | ||
Dagtepe P, Chikan V, Jasinski J, Leppert VJ. Quantized growth of CdTe quantum dots; observation of magic-sized CdTe quantum dots. J Phys Chem C Nanomater Interfaces. 2007;111(41):14977–14983. | ||
Yu WW, Qu L, Guo W, Peng X. Experimental determination of the extinction coefficient of CdTe, CdSe, and CdS nanocrystals. Chem Mater. 2003;15(14):2854–2860. | ||
Stanley P, Cummings RD. Structures common to different glycans. Vol Chapter 13. 2nd ed. Cold Spring Harbor: Cold Spring Harbor Laboratory Press; 2009. |
Supplementary material
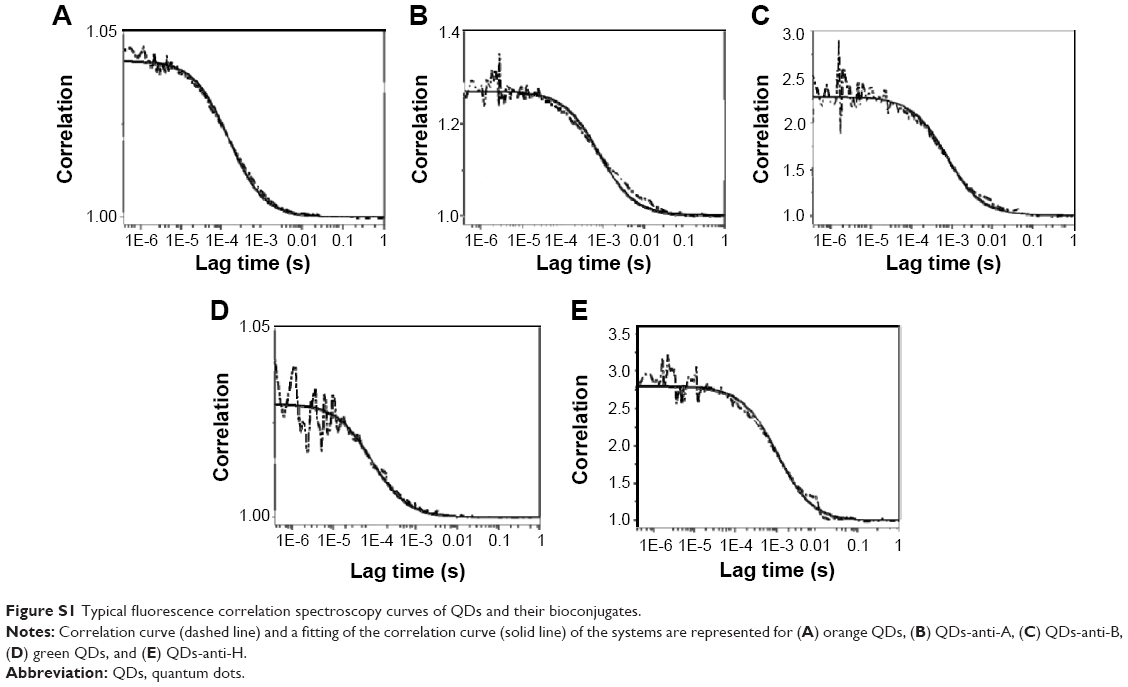 | Figure S1 Typical fluorescence correlation spectroscopy curves of QDs and their bioconjugates. |
 © 2015 The Author(s). This work is published and licensed by Dove Medical Press Limited. The
full terms of this license are available at https://www.dovepress.com/terms
and incorporate the Creative Commons Attribution
- Non Commercial (unported, 3.0) License.
By accessing the work you hereby accept the Terms. Non-commercial uses of the work are permitted
without any further permission from Dove Medical Press Limited, provided the work is properly
attributed. For permission for commercial use of this work, please see paragraphs 4.2 and 5 of our Terms.
© 2015 The Author(s). This work is published and licensed by Dove Medical Press Limited. The
full terms of this license are available at https://www.dovepress.com/terms
and incorporate the Creative Commons Attribution
- Non Commercial (unported, 3.0) License.
By accessing the work you hereby accept the Terms. Non-commercial uses of the work are permitted
without any further permission from Dove Medical Press Limited, provided the work is properly
attributed. For permission for commercial use of this work, please see paragraphs 4.2 and 5 of our Terms.