Back to Archived Journals » Current Biomarker Findings » Volume 4
Biomarkers of chronic alcohol misuse
Authors Gonzalo P, Radenne S, Gonzalo S
Received 8 October 2013
Accepted for publication 12 November 2013
Published 17 January 2014 Volume 2014:4 Pages 9—22
DOI https://doi.org/10.2147/CBF.S37239
Checked for plagiarism Yes
Review by Single anonymous peer review
Peer reviewer comments 3
Philippe Gonzalo,1 Sylvie Radenne,2 Sylvie Gonzalo3
1Laboratoire de Biochimie, Centre Hospitalier Universitaire de Saint-Etienne, Saint-Etienne, France; 2Service d'Hépatologie-Gastroentérologie, Hôpital de la Croix Rousse, Hospices Civils de Lyon, Lyon, France; 3Laboratoire Biomnis, Lyon, France
Abstract: Biological markers of chronic alcoholism can be divided into two groups: direct and indirect markers. Direct markers (mainly blood or serum and urine ethanol, ethylglucuronide, ethyl sulfate, and phosphatidylethanol) directly track the intake of alcohol and vary in their sensitivity and kinetics of appearance and clearance. Indirect markers (mean corpuscular volume,γ-glutamyl transferase, alanine aminotransferase and aspartate aminotransferase, and carbohydrate-deficient transferrin) are biological parameters that are influenced by a steady and significant alcohol intake. We discuss the values of these tests and the relevance of their prescriptions for the clinical evaluation of heavy drinking. We indicate, when known, the pathophysiological mechanism of their elevations. We also discuss the amount and time of alcohol consumption required to give a positive result and the duration of abstinence required for the return to normal values. The forensic use of these biomarkers will not be considered in this review.
Keywords: alcoholism, biomarker, CDT, relapse, alcohol-induced liver disease
Introduction
Alcohol abuse and dependence are defined as psychiatric disorders according to the criteria described in the Diagnostic and Statistical Manual of Mental Disorders, Fourth Edition, Text Revision (DSM-IV-TR).1 Alcohol abuse and alcohol dependence, although somewhat overlapping, are defined as follows: Alcohol abuses are characterized by the recurring use of alcoholic beverages despite alcohol’s negative consequences on various aspects of life, including professional, social, family, economic, legal, and health problems. Alcohol dependence is marked by the need for significantly increased amounts of alcohol, the characteristic withdrawal syndrome, and unsuccessful efforts to cut down drinking. This division into dependence and abuse has not been retained in the DSM-V revision, and abuse and dependence criteria have been combined into a single substance use disorder, with craving being regarded as an additional criterion.2 Chronic alcohol abuse is usually referred to by the generic term “alcoholism,” although several chronic alcohol misuses exist, including binge drinking (heavy episodic drinking during a short period of time), a new drinking behavior arising predominantly in adolescents and young adults. All these behaviors result in severe long-term health effects.3
As stated by Allen in 2003, biomarkers of heavy drinking are not intended to replace the psychometric measures of alcohol misuse that generally aim to assess drinking behavior and alcohol dependence.4 Instead, they are complementary to self-reporting questionnaires and clinical investigations, and the two approaches should be used in conjunction. Indeed, in contrast to self-reporting, biomarkers do not suffer from inaccurate reports of drinking behaviors. In this way, they can provide clinicians with an additional source of objective information on patients. However, they have their own limitations, depending on patient conditions and being subject to analytical caveats. This is obvious when comparison of specificities and sensitivities for the same biomarker are performed between several studies.
The implementation of standardization is constantly ongoing to reduce analytical discrepancies between laboratories. However, test results are still not all correctly standardized, and thus the results are not interpretable using the same reference values in each laboratory, a property called commutability. In addition, methods have significantly changed over time, particularly in enzymology, and as a consequence, it is now difficult to compare and interpret results obtained 20 or 30 years ago.
Another difficulty when comparing studies arises from the characteristics of the population, including the reference population. Indeed, detecting heavy drinking in the general population for driving license restitution is much easier than detecting it among cirrhotic patients. Frequency of alcohol addiction in the general population is also a common caveat. Sensitivity refers to the ability to identify a specific trait (in this case, heavy drinking), but it is much easier to detect the trait with a low rate of false-positive results when the trait is common compared with when it is rare. This can also account for the observed conflicting performances reported for identical alcohol biomarkers.
For all these reasons, it is necessary to note that although they are apparently fully objective, biomarker results should be interpreted in context.
Another difficulty with alcohol biomarkers, beyond the fact that they are reported to rise when alcohol is consumed, is correctly interpreting this elevation. Indeed, the use of traditional biomarkers is well-established, but their alleged performances have evolved, and therefore, it is difficult to interpret them reliably. New biomarkers are generally less available, and their performances are somewhat poorly assessed. This, of course, depends both on the marker and on the circumstances in which it is prescribed. For example, in emergency room settings, alcohol blood level is the immediate concern because it more or less correlates with the patient condition during the acute phase of alcohol intoxication. Both the test and the result are relatively straightforward. However, in more general health care contexts, the range of answers that can be expected from alcohol biomarkers is wider and somewhat overlapping. For example, when mean corpuscular volume (MCV), γ-glutamyl transferase (γ-GT), or aspartate aminotransferase (ASAT) are prescribed, what is expected, and what is measured: The screening of chronic heavy drinking itself, or the evaluation of the toxic effects of chronic heavy alcohol consumption? During the clinical management of heavy-drinking patients, several answers can be expected from alcohol biomarkers: How much and how often is alcohol consumed? Was alcohol consumption fully or only partly stopped? In these instances, an ideal biomarker would indicate the amount of alcohol consumed and the duration of drinking. These are conflicting issues, and we try to focus this review on these points. The range of situations in which alcohol biomarkers are used is wide; we close this review by indicating which biomarker can be used in each situation.
However, first we distinguish between the two categories of markers of alcohol misuse: Direct biomarkers are the direct indication of the past or present existence of ethanol in the body, and indirect biomarkers reflect the physiological response of the organism to the metabolic or toxic effects of ethanol. The object of this review is to evaluate available tests, with particular attention paid to those that can be used to detect and limit the most excessive alcohol abuses.
Other plasma biomarkers such as triglycerides, uric acid, or high-density lipoprotein cholesterol elevations that positively correlate with alcohol consumption fall beyond the scope of this review.
Direct biomarkers
Ethanol
Ethanol, a toxic compound itself, is the primary biomarker of alcohol intoxication. Table 1 presents information about alcohol determination in different biological media that can be used in forensic medicine.
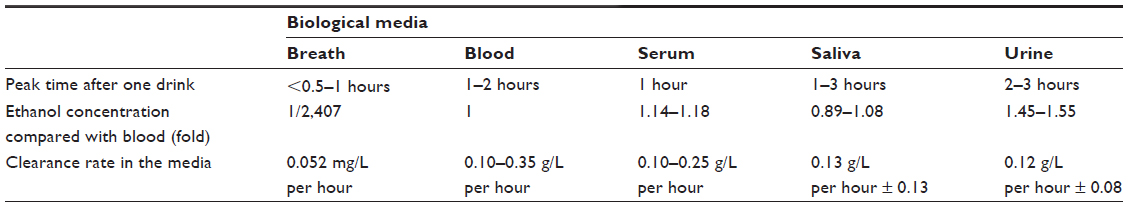 | Table 1 Kinetic parameters of ethanol metabolism |
Assays and performances
Several methods exist for blood ethanol determination. The clinical enzymatic method, based on the use of the alcohol dehydrogenase enzyme from yeast, is the most widely available. This method is quite specific, with nearly no interference with other alcohols such as methanol or ethylene glycol (−0.1% and 0%, respectively, at concentrations of 20 g/L).5 However, confusion is still possible for “negative” blood-alcohol concentration: The limit of determination of this test is not zero but, usually, less than 0.1 g/L (or <2.2 mM). As a consequence, results lower than this threshold should be considered negative. As a result, blood-alcohol concentration can usually be measured for less than 10–12 hours after alcohol ingestion, even with fairly heavy drinking, which is its main limitation. Thus, even programs with frequent monitoring of blood-alcohol concentration may miss recent alcohol consumption. Other methods for ethanol determination include historical distillation methods and gas chromatography, which is considered the reference method and allows the screening of other alcohols such as methanol or ethylene glycol.
Alcohol can also be determined from other biological media, such as breath, saliva, whole blood, or urine. The determination of breath alcohol provides a noninvasive method of approximating the blood-alcohol concentration and is widely used for drunk-driving control.
Kinetic parameters of ethanol metabolism
Kinetic parameters for ethanol metabolism in these different media are displayed in Table 1
Note that the above data depend on the population.
Only 2%–5% of ethanol is excreted unchanged in breath, urine, and sweat. Most of the ethanol is metabolized by liver enzymes, either alcohol dehydrogenase (95% in occasional drinkers) or microsomal p450 enzymes, which are inducible and are the reason why the metabolic rate of ethanol can be more than doubled in alcohol-dependent patients (0.25–0.35 g/L per hour) compared with social drinkers (0.15–0.19 g/L per hour).6 Asian people usually have a lower metabolic clearance of ethanol (0.1 g/L per hour);7 women also have slightly faster metabolic rates than men, possibly related to sex differences in liver weight in relation to lean body mass.8
Expected serum alcohol peak concentrations related to the number of drinks in men and women depending on their weights are indicated in Table 2, according to Pizon et al.6
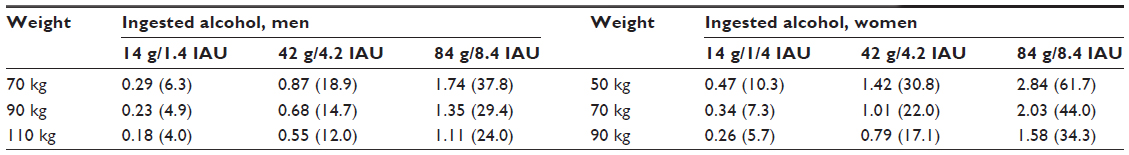 | Table 2 Theoretical peak alcohol serum concentration g/L (mM) |
Ethylglucuronide
EtG formation
Most ethanol is primarily metabolized by the liver (90%–95%) or excreted unchanged by kidneys, lungs, and skin in the form of water and carbonic gas. A very small amount of ethanol (less than 0.1%) can be removed as ethylglucuronide (EtG) by conjugation pathways.
EtG kinetics
The major advantage of EtG is to extend the detection window for ethanol. The blood-EtG concentration peak occurs about 3 hours later than that of ethanol, and this metabolite can be found in the blood about 8 hours after ethanol has been removed.9 Urinary EtG measured in alcoholic patients undergoing alcohol detoxification (cut-off limit, >0.5 mg/L) is detectable 40–130 hours (median, 78 hours) after exposure to alcohol leading to a blood-alcohol concentration of 1 g/L.10
EtG determination and interpretation
Analytical determination of EtG is largely via chromatography, either gas chromatography–mass spectrometry/negative chemical ionization (GC-MS/NCI) or liquid chromatography–tandem mass spectrometry (LC-MS/MS), although enzyme-linked immunosorbent assay tests have been recently developed for serum and urine.11 The preliminary results of this assay reported a high level of accuracy and selectivity of urinary EtG that has been subsequently confirmed.10
A threshold of 0.5 mg/L (2.2 μmol/L) was used to obtain a high sensitivity and avoid positive results caused by unintentional ethanol exposure. However, much lower thresholds are proposed to extend the detection window or decrease the levels of alcohol intake required to get a positive result, although this will reduce specificity. Indeed, EtG presence is specific for ethanol exposure, although not invariably by ingestion of alcohol-containing beverages. False-positive tests have been reported with ethanol-containing mouthwashes and hand sanitizers, but a thorough examination of the literature indicates they are likely uncommon.12
Conclusion
Because EtG is a direct ethanol metabolite, a positive finding is regarded as a very reliable indicator of recent drinking.13 Urinary EtG is a useful tool for objective identification of current drinking and relapse detection. However, this test is expensive and not yet widely available.
Ethyl sulfate
Similarly to EtG, ethyl sulfate (EtS) is a minor metabolite of ethanol. Although the detection window is longer, EtS has little practical advantage compared with EtG. EtS appears to follow the same pattern of urinary excretion as EtG after ethanol exposure, although absolute concentrations are lower.12
There is no immunochemical test for EtS, and only specialized chromatographic methods are available, which also contributes to limiting its present clinical interest.
Phosphatidylethanolamine
Phosphatidylethanolamine formation
Phosphatidylethanolamine (PEth) is generated through the action of phospholipase D in the presence of ethanol.
Kinetic characteristics
PEth is a specific marker demonstrating alcohol presence in the organism. PEth concentration requires about 15 days of abstinence to return to normal values (half-life in whole blood is about 7 days but can vary considerably; range, 3.5–9.0 days).13
PEth determination and performance
PEth determination is still complex and involves LC-MS. The high sensitivity of LC-MS allows for the detection of even low/moderate (social) drinking14 and even, apparently, of a single large alcohol intake.13 PEth would therefore be better than carbohydrate-deficient transferrin (CDT) to detect relapse when alcohol consumption would be not high and/or frequent enough for CDT to become elevated.13
Conclusion
PEth is an efficient biomarker of relapse. It is less sensitive than EtG, requiring a higher level of alcohol intake for a positive result,13 and contrary to CDT, it can be positive for levels of alcohol intake that do not correspond to toxicity. However, this assay is still restricted to specialized laboratories.
Indirect markers
Conventional biochemical markers: MCV, γ-GT, ASAT, alanine aminotransferase
MCV, γ-GT, ASAT, and alanine aminotransferase (ALAT) are established and widely prescribed markers used for the monitoring of alcohol consumption and relapse. Their relevance depends mainly on their sensitivity and specificity and on their delay of normalization after abstinence. A comprehensive and critical review of the literature was published on this topic in 2003.15
γ-GT
Structure
γ-GT is a N-glycosylated glycoprotein of 569 amino acids consisting of two subunits processed from a single-chain precursor by an autocatalytic cleavage. The active site of γ-GT is known to be located in the light subunit. This subunit is the main plasma circulating form of the enzyme.
Tissue location
The γ-GT gene is expressed in many tissues involved in secretory and absorptive processes, including the kidneys, bile duct, pancreas, gallbladder, spleen, heart, brain, and seminal vesicles.16
Functions
γ-GT is a cell membrane–anchored enzyme displayed on the outer surface of cells that catalyzes the transfer of the gamma-glutamyl moiety of glutathione (GSH) or glutathione conjugates to an acceptor that may be an amino acid, a peptide, or water. As a result, γ-GT plays a key role in maintaining GSH and cysteine homeostasis.17 Specifically, renal γ-GT, by cleaving GSH into its constituent amino acids, prevents excretion of glutathione from the body, which can then be reabsorbed. Because GSH is known as a substrate in both conjugation and reduction reactions, γ-GT is critical for resistance to oxidative stress18,19 and drug and xenobiotic detoxification.20 However, it has also been reported that γ-GT reaction products themselves lead to increased free-radical production, particularly by Fenton reactions in the presence of iron, and that γ-GT itself was an independent cardiovascular risk biomarker, being involved in low-density lipoprotein oxidation and generation of inflammatory atheroma within the vascular endothelial wall (reviewed in Mason et al21).
In addition, γ-GT regulates the catabolism of leukotriene C4, a potent mediator of inflammation and vasoconstriction in the lung and vasculature.22
Pathways of γ-GT induction
It is well known that γ-GT plasma levels rise on treatment with drugs such as imipramine derivatives, phenytoin, barbiturates, amiodarone, steroids,23 or alcohol and that this increase is mediated by an induction at the transcriptional level.24 Several studies also demonstrate that γ-GT is upregulated in different cell types after acute exposure to oxidative stress and inflammation, as well as neoplastic transformation by various cellular signaling pathways.25
Assay
Standardization has greatly progressed concerning the determination of γ-GT activity since the first description of this assay in 1969:26 first, with the publication of the International Federation of Clinical Chemistry recommendations for its measurement in 2002,27 and second, with the certification of a reference material for the determination of the γ-GT enzymatic activity made of the purified light subunit of γ-GT from renal porcine origin in 2005.28
The use of standardized substrates and of calibrators led to the reduction of the interlaboratory CV for γ-GT. In 2002, results varied from −60% to +30%.29 In spite of recommendations published several years before, these were only partly adopted by reagent producers, and by 2005, less than 50% of the laboratories in France used an International Federation of Clinical Chemistry–labeled method. The use of a multienzyme calibrator should greatly improve the interlaboratory transferability of the results, as shown by Steinmetz et al.30 In another experiment, the use of a common calibrator led to a drastic reduction in interlaboratory CV (from 20.6% to 4.6%), even when using different reagents and equipment.31
However, although the determination of γ-GT has gradually improved, it is likely that some of the discrepancies observed between previously published studies may have originated from unharmonized analytical methodologies.
Elevations in pathology
Overview: As a biological marker, γ-GT became commercially available in the early 1970s. It was used initially as a sensitive marker of hepatic inflammation.32 Although it is not specifically expressed in the liver, plasma γ-GT activity is usually considered as being of hepatic origin.
The mechanisms of γ-GT elevation in cholestasis are poorly understood. It has been proposed that the rapid serum elevation is a result of the liberation of cell membrane fragments rich in γ-GT, with this release itself being associated with biliary acid toxicity and reflux.33 In contrast, the delayed γ-GT elevation associated with alcohol or drug induction would be caused by an increase in the transcription of the γ-GT genes.24 Of note, in hepatobiliary diseases, a raise in alkaline phosphatase and bilirubin are also usually observed, which is not the case in the absence of alcohol-induced liver damage.
γ-GT levels and alcohol consumption: γ-GT is one of the older and best biological indicators of heavy alcohol drinking, together with MCV.34 γ-GT is elevated in cases of heavy chronic drinking in 35%–90% of patients, depending on the study. In a meta-analysis published in 2003, Conigrave et al found that γ-GT was found higher than the normal limit in 44% of cases, for a specificity set at 90%, which shows a higher specificity than for MCV (33%).15
γ-GT levels correlate with alcohol consumption, but only weakly, with better results seen in men than women (r=0.1–0.3 in women versus r=0.3–0.4 in men) and in adults aged between 30 and 60 years.15 When assessing the probability of having abnormal γ-GT levels with alcohol consumption, odds ratio reached 9.6 for alcohol consumption higher than 420 g/week for men and 5.0 for women with consumption higher than 280 g/week. The minimal alcohol consumption required for having an elevated γ-GT was about 74 g/week for men and 60 g/week for women, which is well below usual reported alcohol amounts.35
Indeed, several studies have looked at the relation between alcohol intake and γ-GT elevation and found that higher alcohol amounts were required to elevate γ-GT. When experimentally tested on young volunteers, a 60 g/day ingestion of alcohol for 3 weeks led only to a 15% increase of γ-GT,36 whereas a doubling rate was observed after 5 weeks in another study.37 However, γ-GT was later shown to be less efficient for detecting alcoholism in young adults.
A low sensitivity of γ-GT is also reported in another study in which, in a large cohort, a significant elevation of γ-GT was observed only for 37% of drinkers ingesting more than 100 g/day, whereas a moderate elevation was detected in only 22% of the drinkers in the 50–99 g/day range.38
There is a general agreement that at least 5 drinks/day (probably more) for several weeks are required to significantly raise γ-GT levels.39 Return to normal range is obtained after 2–6 weeks of abstinence.4 Probably because of its function in the oxidative stress response, γ-GT has even been shown to be an independent marker of cardiovascular disease, which makes γ-GT a useful biomarker not only of liver damage but also of other causes of comorbidity.38
Limitations as a biomarker of chronic alcohol abuse
Any cause of biliary damage or cholestasis results in elevated γ-GT. Not exclusive to the liver, γ-GT is also elevated on damage of many other tissues. In addition, it has been demonstrated repeatedly that γ-GT performs poorly in people younger than 30 years, as reviewed in Conigrave et al.15
γ-GT rises independent of alcohol in obese people, and elevated γ-GT activities appear to be related to very light intake among obese patients. It is even more strongly associated with obesity than alcohol in studies in which both parameters were analyzed together.40 This is, of course, an important limitation in the use of γ-GT as a biomarker of heavy drinking, because of rising obesity rates.
Indications
Screening or opportunistic finding: γ-GT can be used for screening or opportunistic finding, as it is a widely prescribed, routinely performed, and inexpensive test. Indeed, although many factors can lead to its elevation, alcohol is the most common cause.
Detection of alcohol-induced liver damage: Although alcohol is a potent inducer of γ-GT, γ-GT is also described as the first hepatic test to be elevated in case of liver damage,41 and it correlates with steatosis, an alcohol-induced liver pathology.42
Monitoring of abstinence and as a motivational tool: In the absence of liver damage, γ-GT level decreases after 1 week of abstinence and is markedly reduced after 1 month, which is useful for encouraging patients and monitoring treatment success.43,44
In patients with histologic liver damage, serum γ-GT is more elevated before abstinence (two to three times the upper limit of normal) and decreases to normal in 80% of patients 8 weeks after abstinence. In the case of liver damage, serum γ-GT is eight to ten times higher than normal and usually persists at high levels after 8 weeks of abstinence.42
In patients with cirrhosis, γ-GT is also shown to decrease in about 90% of patients, but with a longer delay (11–54 days) and incomplete return to normal.45
Conclusion
γ-GT is cheap and widely popular as a biomarker of heavy alcohol drinking. However, it suffers from poor sensitivity (which is emphasized in women and people younger than 30 years) and specificity (mainly in cases of associated hepatobiliary diseases and obesity).
MCV
Pathophysiology
Macrocytosis has been recognized as being associated with alcoholism for a long time. The mechanism of macrocytosis was quickly recognized as being independent of anemia and folate or vitamin B12 deficiency.46,47 The causes of macrocytosis are complex and poorly understood. Reticulocytosis (37%), thrombocytopenia (41%), and combined cytopenia (36%) are also associated with macrocytosis in alcoholism.48
Ethanol and/or its metabolite acetaldehyde have a toxic effect on bone marrow.49 A vacuolization of red cell precursors and megakaryocytes are found in about 20% of alcoholic patients; this is also observed in cases of chloramphenicol toxicity. An inhibition of heme synthesis is also observed, although it does not result in a decrease in mean corpuscular hemoglobin concentration.50
Acetaldehyde is a potent reagent that is able to react with proteins and form stable adducts that functionally modify these proteins.51 Such modifications have been observed in apolipoproteins and may be responsible for the high triglyceride and high-density lipoprotein cholesterol concentrations observed in the case of chronic alcoholism. These protein adducts also give rise to specific antibodies, mainly immunoglobulin A but also immunoglobulin M, that bind to red cells and other circulating cells and that might explain the macrocytosis and other hematological abnormalities observed in the case of severe alcoholism.52 Immunoglobulin A may also be responsible for glomerulonephrosis.53
What threshold for macrocytosis?
The increase in MCV to higher than 98 fL (normal is between 82 and 96 fL) is evidence of heavy chronic ethanol consumption (mean MCV, 96±4 fL in the >40–500 g ethanol/day range). In chronic drinkers with intake lower than 40 g/day, the upper normal limit for MCV is 98 fL (mean MCV, 90±3.5 fL) compared with 96 fL for abstainers (mean MCV, 89±3.5 fL). Defining macrocytosis using the 98-fL value is of critical importance because in many studies, macrocytosis is defined as over 95 fL, which results in poor specificity while increasing sensitivity.54
Performance of macrocytosis to detect heavy drinking
Sensitivity and specificity vary from 40% to 90%, depending on the value used to define macrocytosis and on the population. Sensitivity is calculated to be 33% at 90% specificity from the computation of the data of more than 50 studies.15 The sensitivity of MCV to detect alcoholic patients would therefore be lower than that of γ-GT (44%).
Macrocytosis would also detect heavier alcohol drinkers than γ-GT. However, as indicated earlier, an increase in γ-GT levels was only observed in case of alcohol consumption exceeding 420 g/week, which is in the same range as that required to raise MCV higher than 98 fL.54 It is therefore likely that both markers are detectable only for harmful levels of alcohol drinking.
As the lifespan of red blood cells is 120 days, it is expected that heavy drinking for several months is required to significantly increase MCV, but studies are lacking to attest to this point. For the same reason, normalization after abstinence necessarily takes several months, typically 10–12 weeks, which has been demonstrated.55 This delay clearly limits the interest of MCV as a relapse marker. In the abovementioned study, the comparison with γ-GT was performed and confirmed that γ-GT returns to the normal range in a shorter time (within 2 months in most, but not all, patients).
Limitations of MCV as a biomarker of chronic alcohol abuse
Macrocytosis appears in patients who have a deficiency of vitamin B12 and/or folate or erythroid lineage disorders, but contrary to obesity or hepatobiliary diseases for γ-GT, these conditions are quite rare. Performance of γ-GT is also lower in young adults and women, which is not the case for macrocytosis. MCV is therefore probably a more reliable marker of heavy drinking than γ-GT.
Conclusion
MCV alone is of a limited interest in screening for alcoholism because it can only detect a limited number of really heavy drinkers. However, its limitations are minor in comparison to those of γ-GT, and thus MCV (>98 fL) may be the best of the traditional biomarkers. In addition, the test is easy and inexpensive.
Aminotransferases ASAT and ALAT
Physiological utility
The transaminases ASAT and ALAT are enzymes involved in the transamination reactions of amino acids. In the liver, these enzymes participate in ammonium detoxification and neoglucogenesis.
ALAT is mainly expressed in liver, kidneys, heart, and skeletal muscles. It is a cytosolic enzyme that also participates in the alanine cycle between peripheric tissues and the liver for neoglucogenesis and nitrogen metabolism.
ASAT also participates in energy metabolism, being involved in the malate–aspartate shuttle that efficiently regenerates the cytosolic NAD+ pool, which potentiates both mitochondrial and glycolytic ATP production and prevents lactic acid production. The distinct ASAT isoenzymes that are involved in this shuttle are located either in mitochondria or in the cytosol. They are encoded by different genes.
Aminotransferases as biomarkers
Being intracellular enzymes, the serum ASAT and ALAT aminotransferase activities are considered unspecific markers of cytolysis, and there is no condition in which only one activity is significantly increased while the other remains in the normal range. As a result, both activities are compared, and when ALAT activity is greater than ASAT activity, liver cytolysis is suspected, whereas ASAT activity greater than ALAT activity points to muscle cytolysis, including myocardial infarction.
However, with alcoholism, the ASAT/ALAT ratio is also usually higher than 1.56 A proposed explanation for this is given here. The mitochondrial ASAT isoenzyme is the main cellular isoenzyme (about 80%) compared with the cytosolic isoenzyme (about 20%). However, the mitochondrial isoenzyme represents less than 10% of the serum ASAT activity in normal patients or in patients with a classical cytolytic hepatitis. Long-term exposure to alcohol promotes mitochondrial ASAT to translocate to the cell membrane, as well as its induction by an upregulation at the transcriptional level.57 As a result, serum mitochondrial ASAT activity is greatly increased on heavy alcohol consumption, leading to inversion of the ASAT/ALAT ratio, usually higher than 2.58
It has been suggested that the serum mitochondrial/total ASAT activities ratio could be used to discriminate drinkers in case of hepatopathy.59 However, the mitochondrial ASAT activity test is no longer currently available. In addition, it has been subsequently shown that ASAT levels reflect liver damage rather than alcohol consumption, contrary to γ-GT that is primarily an alcohol-induced biomarker.60
Conclusion
ASAT and ALAT are cheap and widely available liver function biomarkers, but they primarily reflect liver damage and cannot be used as biomarkers of heavy drinking.
CDT
Structure, definition, and pathophysiology
Transferrin is a glycoprotein synthesized by the liver that is involved in iron blood transport. It can bind a maximum of two Fe3+ ions. It is made of a polypeptide chain of 679 amino acids with two N-linked complex oligosaccharide chains. The heterogeneity in the oligosaccharide chains is important, and the equipment required for its analysis is only available in a very limited number of research laboratories.61,62 As a consequence, to date and in spite of ongoing efforts, the structure of the different transferrin glycoforms is not fully elucidated, which is part of the problem of transferability of the results obtained by the currently available testing methods.
In clinical practice, this glycosylation heterogeneity is only taken into account by the total number of sialic acid residues borne by the transferrin molecule.63 Each of the two glycan chains is considered as being bi-, tri-, and, rarely, tetra-antennary, and each antenna is ended by a sialic acid residue. In addition, during its synthesis, transferrin is partly deglycosylated in the endoplasmic reticulum and the Golgi. Normal human serum typically contains a predominant transferrin glycoform, the tetrasialo-transferrin isoform (n=4; 75%–80%), which is predicted to contain two biantennary N-glycans on the 413 and 611 asparagine residues, leading to a total number of four sialic acid residues (isoelectric point, 5.4). Two additional minor glycoforms are also normally observed. Pentasialotransferrin (n=5; isoelectric point, 5.3) represents about 15% of overall transferrin and contains a triantennary chain on N413 and a biantennary one on N611. Trisialotransferrin (n=3; isoelectric point, 5.6) would derive from the pentasialotransferrin isoform by loss of the biantennary chain linked to the N611 residue and represents about 5% of total transferrin, although this is controversial.63
Chronic alcohol exposure leads to the appearance of hyposialylated transferrin isoforms in the plasma, which was first described by Stibler et al in 1978.64 Supporting mechanisms are not well understood and would involve both biosynthesis and catabolism alterations of the glycan part by ethanol itself and/or its metabolite acetaldehyde, although the only described structural abnormality would correspond to the loss of an entire glycan chain.61,65 Of note, serum sialic acid concentration, putatively a result of the desialylation process of numerous plasma proteins, has been proposed as a marker of heavy drinking.66 The defect in glycosylation might originate from enzyme inhibition by acetaldehyde adduct production or by the effects of ethanol on the mRNA transcription levels of sialyltransferases.65,67
As a result, alcohol consumption leads to the production of two hyposialylated isoforms, the disialotransferrin (n=2; isoelectric point, 5.7; normal proportion, <2%) by loss of the biantennary N-glycan chain on the N611 residue, and asialotransferrin (n=0; isoelectric point, 5.9; lower than 0.5% in normal conditions), once the N413 residue has lost its glycan biantennary chain. Asialotransferrin usually becomes measurable when the disialotransferrin level reaches approximately two- to threefold the upper limit of the reference values.68
These two glycoforms, also referred to as the hyposialylated isoforms of transferrin, constitute the CDT and best reflect alcohol consumption, but it is recommended that disialotransferrin be the primary target molecule for CDT measurement. CDT is expressed in a relative amount (%CDT) to compensate for variations in the total transferrin concentration.69
The monosialotransferrin (n=1), nearly undetectable, most likely derive from the trisialo-transferrin isoform (n=3). Monosialotransferrin is included in the definition of CDT, although it should not be, as trisialotransferrin is no longer included in the CDT definition. However, as it is undetectable even in really heavy drinkers, this causes no change in the interpretation of the results. Elevation of trisialotransferrin itself is observed in different etiologies, including liver diseases, but it has been shown not to depend on alcohol consumption, and as a result, it should not be measured as CDT.70
A possible explanation for this absence of specificity of the trisialotransferrin isoform might originate from the fact that a part of what was referred to as trisialotransferrin (or disialo-trisialo bridging, a pattern in which disialo- and trisialo-transferrin are not adequately separated in some techniques) might actually correspond to extra transferrin glycoforms. Indeed, in the case of disialo-trisialo bridging, more complicated patterns of transferrin glycosylation are observed (with fucosylation and branching), which would also explain why excluding trisialotransferrin from CDT leads to a better correlation with alcohol consumption.62 The disialo-trisialo–bridging pattern is prevalent in patients with liver cirrhosis or other severe liver abnormalities, which complicates the interpretation of CDT as an alcohol biomarker in these patients, in whom other indirect biomarkers of relapse cannot be used.71
In contrast to other glycoproteins, the lack of sialic acid residues in CDT isoforms does not cause their accelerated hepatic clearance via the asialoglycoprotein receptor.63 Thus, CDT isoforms can accumulate at the plasma level, which is not the case for other serum glycosylated proteins that, as a result, cannot be used as biomarkers of heavy drinking. The plasma half-life of CDT, about 2 weeks, is even longer than that of normally glycosylated transferrin (7 days).72,73
After 2 weeks of alcohol intoxication (maximum, 3 weeks), the concentration of CDT is stabilized. CDT is therefore a very sensitive marker to detect relapse in alcohol-dependent people.74
Correlation between serum CDT and alcohol consumption and performance
CDT formation requires a sustained long-term elevation in blood-alcohol concentration, as glycated hemoglobin levels reflect the mean blood glucose concentration. For this reason, CDT is poorly affected by single acute episodes of alcohol intoxication.75
In sober individuals, depending on the methods, the CDT rate is about 2%, and it is currently accepted that ethanol consumption greater than 60 g/day for at least 2 weeks will increase this rate higher than the threshold. However, these figures are controversial.4 Indeed, in an experiment Lesch et al performed with healthy volunteers, an 80 g/day ingestions of ethanol for 3 weeks failed to significantly increase CDT levels.76 However, this is an old study, and both the way CDT was measured and the threshold chosen for positivity can explain this low sensitivity. In contrast to this study, Sillanaukee et al established that CDT was increased when alcohol consumption was higher than 55 g/week, which is well below the accepted amount of at least 50 g/day.35 In another study using a different approach, CDT was measured in drivers submitted to blood-alcohol concentration determination. CDT elevation significantly correlated with blood-alcohol concentration, demonstrating the interest of using CDT in a traffic safety context.77 In the founding study of Stibler and Borg, with a rigorous methodology, a specificity of 100% and a sensitivity of 91% were obtained for healthy individuals after daily consumption of 60 g of ethanol during a 10-day period. In a sample of 187 patients with non-alcoholic-related conditions, only 2% false-positive values were found.78 Our results indicate very a similar performance in a smaller cohort.71 A sensitivity of 86% with a specificity of 94% was observed for a chronic alcohol consumption higher than 60 g/day, and no significant CDT elevation was observed for daily alcohol consumption lower than 30 g/day.
As pointed out by Arndt, the threshold of alcohol consumption for which CDT is raised occurs when alcohol consumption is detrimental and can induce alcohol-induced liver cirrhosis.63 Therefore, CDT positivity correlates with the medical definition of alcoholism. In addition, contrary to other traditional biomarkers such as γ-GT or aminotransferases, CDT positivity is itself independent of liver damage, which we clearly demonstrated by studying CDT performances in a group of cirrhotic patients.71
CDT is therefore a biomarker of regular heavy drinking, and its level of positivity corresponds to alcohol intakes that are harmful. With its very good specificity and good sensitivity, it performs better than other traditional biomarkers such as γ-GT, ASAT and ALAT, and MCV. However, fixing the threshold for its positivity and determination of CDT levels still requires expertise and caution.
Determination
Determination of CDT relies on two principles that support the two general methods used: separation methods and quantification of each fraction and immunological determination of CDT.
The isoelectric points of the hyposialylated isoforms of transferrin after saturation by Fe3+ salts are higher than those of normally glycosylated transferrin, reflecting the loss of the acidic sialic acid residues. This property is used to separate the different isoforms either by capillary electrophoresis or by high-performance liquid chromatography (HPLC).
The immunological method takes advantage of the fact that in all the hyposialylated isoforms that taken together constitute CDT, the asparagine 611 is no longer bound to a glycan chain (see the presumed description of the transferrin glycoforms given earlier). This would make the amino acid stretch, encompassing the N611 residue available for specific antibody binding.
Whatever the method, results should be expressed as a percentage of CDT and not as an absolute value.69 This is calculated using the separative method through measuring the areas under the curve of the different fractions and by measuring total transferrin in a second assay with the immunological method.
CDT caveats
Genetic transferrin variants
Transferrin-C1 is the prevalent isoform in Caucasian subjects (>95%). However, Tf-B and Tf-D variants are also quite common and can interfere with the CDT assay, potentially leading to false-positive results for heterozygous people who are Tf-CD and consuming normal amounts of alcohol. However, most of the transferrin variants are now detected by modern separation method, and this problem is no longer of chief importance.
Sex
In addition, it is reported that women tend to have higher CDT concentrations than men.63 However, in practice, sex is not considered for clinical interpretation.
Analytical caveats
There are still major analytical caveats for CDT determination, although they concern only specific subpopulations such as those with liver cirrhosis and not the detection of heavy drinking in the general population. The analytical difficulties can be divided in 2 categories.
The first category arises from a problem of resolution of the separation method, with no superiority of current HPLC methods over capillary electrophoresis. As demonstrated by Landberg et al, in advanced liver disease, extra transferrin glycoforms are produced in significant amounts and interfere with the CDT assay. These additional isoforms are unrelated to alcohol consumption, and therefore cause false-positive results.62 Accordingly, we propose not to interpret the HPLC and capillary electrophoresis profiles when they were not strictly superimposable on the reference profiles, and we defined specific interpretation rules for the CDT assay by the Sebia Capillarys 2 system.71
The second difficulty concerns the sensitivity and specificity of the detection methods. Indeed, CDT is a small fraction (2%) of a low-abundance protein (transferrin 3 g/L) mixed with a complex mixture of plasma proteins (at least 1,000 different proteins) that changes on patient conditions. As a consequence, detecting CDT (which is itself a mixture of several compounds) is an analytical challenge, all the more so as the precision required to discriminate drinkers from abstinent patients is high. The immunological method (Siemens N-Latex CDT kit; Washington, DC) should be an advantage in this respect, but its limit of quantification is not low enough to perform correctly in case of hypotransferrinemia, which is encountered in advanced liver disease.71
In addition, results given by the immunological method do not correlate correctly with those given by separation method, maybe because of differences in the calibrator used.71
The commutability of the results between the different methods of determination should improve with the use of a common calibrator made of disialotransferrin, but the reference material is not yet available.79
Fixing the threshold for CDT positivity
Fixation of the cut-off of CDT so as to discriminate between abusing and sober patients is of prominent importance. In many manufacturer recommendations, the threshold is fixed according to correlations with other methods for which the direct correlation with alcohol consumption has not necessarily been made.80 As an example, Sebia recommendations (2009/04)80 (a capillary electrophoresis determination) indicate that CDT ≥1.3% suggests excessive drinking behavior from a correlation with an immunological method. In other cases, the reference interval is established from a population of sober patients, and the threshold that will best discriminate excessive drinkers is not precisely calculated but corresponds to the 99th percentile of the sober reference population. This is the case for the Siemens N-Latex CDT kit,81 in which the recommended threshold is set at 2.5%.81 Therefore, the threshold is method-dependent and will have to be set by expert laboratories to correlate CDT levels and alcohol intake.
In our experience, we tested three of the most common methods for CDT determination. For the Sebia Capillarys 2 system, we raised the threshold for positivity to 1.7% or higher, with a grey zone between 1.3% or higher and 1.6%. Using these values, we were able to detect 86% of the abusers (defined as consuming ≥60 g/day) with a specificity of 94%, which gave 96% of correctly classified patients in this cohort of patients without liver disease. In this cohort, performance of the Siemens N-Latex CDT kit was also tested, and it was necessary to raise the threshold to 3% or higher to reach a specificity of 94%, but the sensitivity for the detection of abusers was only 79%. This performance was lower than that reported by the manufacturer, indicating a sensitivity of 93% with a specificity of 97% for a threshold set at 2.5%.81
CDT: what for?
Discrepancies between published performances also depend on what is intended from testing the CDT.
If CDT is intended as a screening tool for harmful behaviors in a medical perspective, focus can easily be set on sensitivity so that a high negative predictive value is obtained. In these conditions, it is possible to use a low threshold without much detriment to the patient, except being falsely classified as an abuser, which can be corrected by clinical questioning.
In contrast, when CDT results are used for the restitution of driving licenses or as a condition for being a candidate for a liver transplantation, the consequences of false-positive results are critical, and it would be advisable to consider a higher threshold to increase the specificity. Knowing the purpose of the test is therefore of prominent importance in this matter, and using two thresholds with a grey zone is a possible solution.
How to use alcohol consumption biomarkers?
Alcohol biomarkers can be used for several purposes. We try here to address several issues. The main characteristics of alcohol biomarkers have been summarized in Table 3.
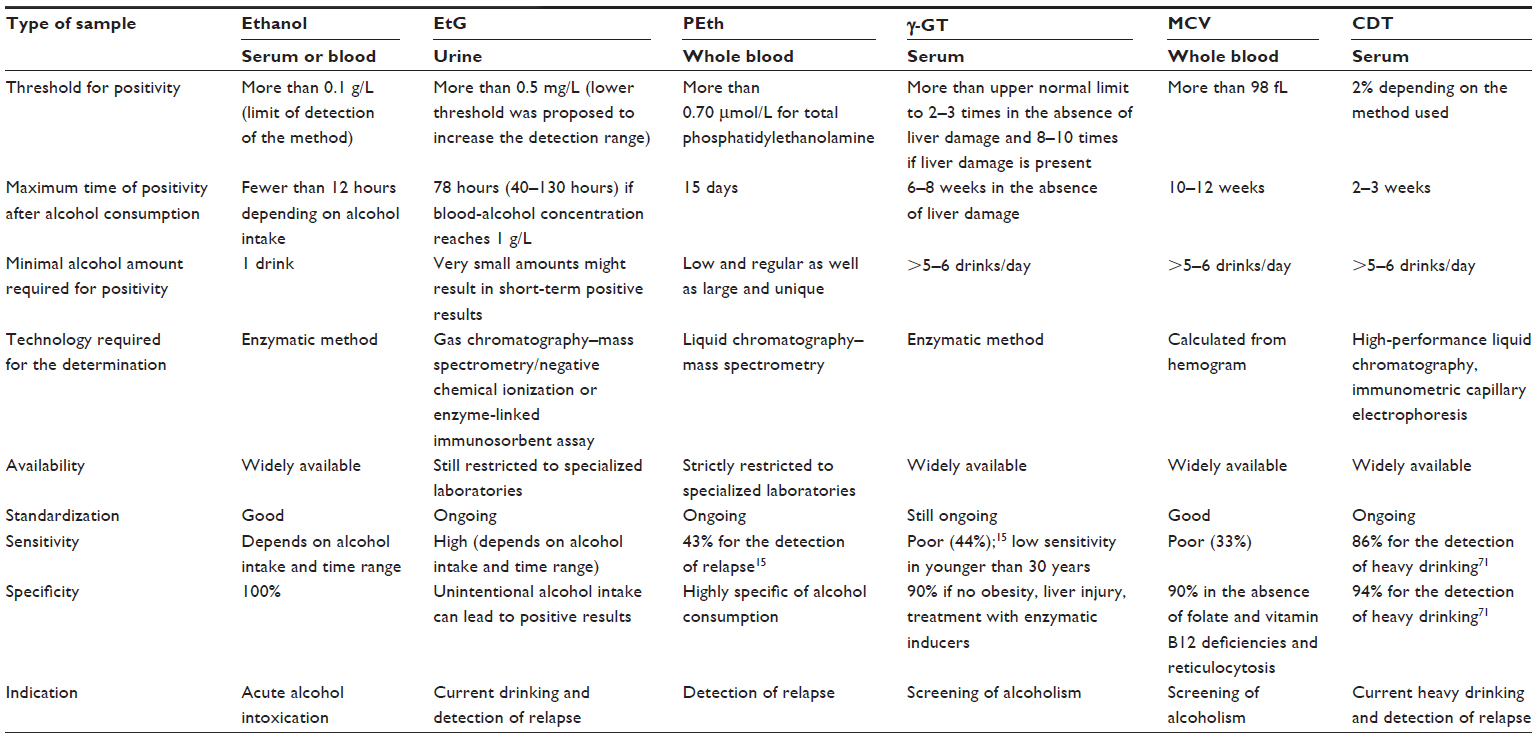 | Table 3 Overview of the main alcohol biomarkers |
Screening for alcohol abuse
In this instance, alcohol abuse, and not alcohol consumption, is investigated. As a consequence, all biomarkers that are positive with low and irregular alcohol consumption should be excluded. This is especially true with EtG and EtS, and probably with PEth.13,14 Thus, biomarkers that denote the toxic effects of ethanol such as γ-GT, MCV, and ASAT and ALAT remain valuable because of their low cost and wide availability. γ-GT is noteworthy among these biomarkers because, as an inductile biomarker, it can also be elevated in the absence of hepatopathy. However, these biomarkers all suffer from poor specificity and sensitivity, and none is better than CDT, the threshold for positivity of which matches the alcohol level that can lead to alcohol-induced liver disease. However, CDT levels are independent of liver damage.71 CDT, in this circumstance, also presents the advantage of being easily available, with the limitation that the threshold for positivity has to be properly defined.
Identifying relapse
When abstinence is the goal, the direct identification of alcohol or its metabolites should be preferred because they display the best specificity. However, ethanol cannot be measured in the blood for more than 10–12 hours, mainly for heavy drinkers who are fast alcohol metabolizers. Urinary EtG (EtS) extends this detection window to about 3 days, which is still too short and would require very frequent patient monitoring. PEth returns to the normal range after about 2 weeks of abstinence and, for this reason, together with its high specificity, is probably to date the best biomarker of relapse even if low or occasional alcohol consumption may remain undetected.13 However, PEth determination still requires expensive and specific HPLC/MS equipment and is restricted to specialized laboratories. CDT level is normalized after 2–3 weeks of abstinence, but moderate alcohol consumption cannot be fully excluded.13 However, as it is widely available, its use in the detection of relapse is recommended once a month.
Acknowledgments
The authors thank Sarah Kanabi for reading and editing this manuscript.
Disclosure
The authors report no conflicts of interest in this work.
References
American Psychiatric Association. Diagnostic and Statistical Manual of Mental Disorders. 4th ed. Washington, DC: American Psychiatric Press; 1994. | |
Hasin DS, O’Brien CP, Auriacombe M, et al. DSM-5 criteria for substance use disorders: recommendations and rationale. Am J Psychiatry. 2013;170(8):834–851. | |
Mathurin P, Deltenre P. Effect of binge drinking on the liver: an alarming public health issue? Gut. 2009;58(5):613–617. | |
Allen JP. Use of biomarkers of heavy drinking in health care practice. Mil Med. 2003;168(5):364–367. | |
Ethanol generation 2 Cobas (ETOH2). [package insert] Roche-Diagnostic, Mannheim, Germany. 2012. French. | |
Pizon AF, Becker CE, Bikin D. The clinical significance of variations in ethanol toxicokinetics. J Med Toxicol. 2007;3(2):63–72. | |
Giang Y-S, Wang S-M, Tsai C-C, Ming-Chang L, Ng C-J. Analyzing alcohol in breath, blood, saliva, and urine for forensic purposes: Taiwanese population. Forensic Sci J. 2007;6(1):1–19. | |
Jones AW. Evidence-based survey of the elimination rates of ethanol from blood with applications in forensic casework. Forensic Sci Int. 2010;200(1–3):1–20. | |
Schmitt G, Droenner P, Skopp G, Aderjan R. Ethyl glucuronide concentration in serum of human volunteers, teetotalers, and suspected drinking drivers. J Forensic Sci. 1997;42(6):1099–1102. | |
Helander A, Böttcher M, Fehr C, Dahmen N, Beck O. Detection times for urinary ethyl glucuronide and ethyl sulfate in heavy drinkers during alcohol detoxification. Alcohol Alcohol. 2009;44(1):55–61. | |
Böttcher M, Beck O, Helander A. Evaluation of a new immunoassay for urinary ethyl glucuronide testing. Alcohol Alcohol. 2008;43(1):46–48. | |
Jatlow P, O’Malley SS. Clinical (nonforensic) application of ethyl glucuronide measurement: are we ready? Alcohol Clin Exp Res. 2010;34(6):968–975. | |
Helander A, Péter O, Zheng Y. Monitoring of the alcohol biomarkers PEth, CDT and EtG/EtS in an outpatient treatment setting. Alcohol Alcohol. 2012;47(5):552–557. | |
Zheng Y, Beck O, Helander A. Method development for routine liquid chromatography-mass spectrometry measurement of the alcohol biomarker phosphatidylethanol (PEth) in blood. Clin Chim Acta. 2011 15;412(15–16):1428–1435. | |
Conigrave KM, Davies P, Haber P, Whitfield JB. Traditional markers of excessive alcohol use. Addiction. 2003;98 Suppl 2:31–43. | |
Hanigan MH, Frierson HF Jr. Immunohistochemical detection of gamma-glutamyl transpeptidase in normal human tissue. J Histochem Cytochem. 1996;44(10):1101–1108. | |
Hanigan MH, Ricketts WA. Extracellular glutathione is a source of cysteine for cells that express gamma-glutamyl transpeptidase. Biochemistry. 1993;32(24):6302–6306. | |
Lieberman MW, Wiseman AL, Shi ZZ, et al. Growth retardation and cysteine deficiency in gamma-glutamyl transpeptidase-deficient mice. Proc Natl Acad Sci U S A. 1996;93(15):7923–7926. | |
Jean JC, Liu Y, Brown LA, Marc RE, Klings E, Joyce-Brady M. Gamma-glutamyl transferase deficiency results in lung oxidant stress in normoxia. Am J Physiol Lung Cell Mol Physiol. 2002;283(4):L766–L776. | |
Paolicchi A, Sotiropuolou M, Perego P, et al. gamma-Glutamyl transpeptidase catalyses the extracellular detoxification of cisplatin in a human cell line derived from the proximal convoluted tubule of the kidney. Eur J Cancer. 2003;39(7):996–1003. | |
Mason JE, Starke RD, Van Kirk JE. Gamma-glutamyl transferase: a novel cardiovascular risk biomarker. Prev Cardiol. 2010;13(1):36–41. | |
Carter BZ, Wiseman AL, Orkiszewski R, Ballard KD, Ou CN, Lieberman MW. Metabolism of leukotriene C4 in gamma-glutamyl transpeptidase-deficient mice. J Biol Chem. 1997;272(19):12305–12310. | |
Rosalki SB, Tarlow D, Rau D. Plasma gamma-glutamyl transpeptidase elevation in patients receiving enzyme-inducing drugs. Lancet. 1971;2(7720):376–377. | |
Barouki R, Chobert MN, Finidori J, Aggerbeck M, Nalpas B, Hanoune J. Ethanol effects in a rat hepatoma cell line: induction of gamma-glutamyltransferase. Hepatology. 1983;3(3):323–329. | |
Corti A, Franzini M, Paolicchi A, Pompella A. Gamma-glutamyltransferase of cancer cells at the crossroads of tumor progression, drug resistance and drug targeting. Anticancer Res. 2010;30(4):1169–1181. | |
Szasz G. A kinetic photometric method for serum gamma-glutamyl transpeptidase. Clin Chem. 1969;15(2):124–136. | |
Schumann G, Bonora R, Ceriotti F, et al; International Federation of Clinical Chemistry and Laboratory Medicine. IFCC primary reference procedures for the measurement of catalytic activity concentrations of enzymes at 37 degrees C. International Federation of Clinical Chemistry and Laboratory Medicine. Part 6. Reference procedure for the measurement of catalytic concentration of gamma-glutamyltransferase. Clin Chem Lab Med. 2002;40(7):734–738. | |
Siekmann L, Bonora R, Burtis CA, et al; International Federation of Clinical Chemistry and Laboratory Medicine. IFCC primary reference procedures for the measurement of catalytic activity concentrations of enzymes at 37 degrees C. International Federation of Clinical Chemistry and Laboratory Medicine. Part 7. Certification of four reference materials for the determination of enzymatic activity of gamma-glutamyltransferase, lactate dehydrogenase, alanine aminotransferase and creatine kinase accord. Clin Chem Lab Med. 2002;40(7):739–745. | |
Infusino I, Bonora R, Panteghini M. Traceability in clinical enzymology. Clin Biochem Rev. 2007;28(4):155–161. | |
Steinmetz J, Schiele F, Gueguen R, Férard G, Henny J; Periodic Health Examination Centers Laboratory Working Group. Standardization of gamma-glutamyltransferase assays by intermethod calibration. Effect on determining common reference limits. Clin Chem Lab Med. 2007;45(10):1373–1380. | |
Lessinger JM, Schiele F, Vialle A, et al. [Enzyme calibrators: principle and practical use]. Ann Biol Clin (Paris). 2002;60(3):281–286. French. | |
Whitfield JB, Pounder RE, Neale G, Moss DW. Serum-glytamyl transpeptidase activity in liver disease. Gut. 1972;13(9):702–708. | |
Cabrera-Abreu JC, Green A. Gamma-glutamyltransferase: value of its measurement in paediatrics. Ann Clin Biochem. 2002;39(Pt 1):22–25. | |
Bagrel A, d’Houtaud A, Gueguen R, Siest G. Relations between reported alcohol consumption and certain biological variables in an “unselected” population. Clin Chem. 1979;25(7):1242–1246. | |
Sillanaukee P, Massot N, Jousilahti P, et al. Dose response of laboratory markers to alcohol consumption in a general population. Am J Epidemiol. 2000;152(8):747–751. | |
Salmela KS, Laitinen K, Nyström M, Salaspuro M. Carbohydrate-deficient transferrin during 3 weeks’ heavy alcohol consumption. Alcohol Clin Exp Res. 1994;18(2):228–230. | |
Belfrage P, Berg B, et al. Prolonged administration of ethanol to young, healthy volunteers: effects on biochemical, morphological and neurophysiological parameters. Acta Med Scand Suppl. 1973;552:1–44. | |
Brenner H, Rothenbacher D, Arndt V, Schuberth S, Fraisse E, Fliedner TM. Distribution, determinants, and prognostic value of gamma-glutamyltransferase for all-cause mortality in a cohort of construction workers from southern Germany. Prev Med. 1997;26(3):305–310. | |
SAMHSA. The Role of Biomarkers in the Treatment of Alcohol Use Disorders, 2012 Revision. Advisory. May 13, 2012;11(2):1–8. Available from: http://adaiclearinghouse.org/downloads/Advisory-The-Role-of-Biomarkers-in-the-Treatment-of-Alcohol-Use-Disorders-434.pdf. Accessed November 20, 2013. | |
Poikolainen K, Vartiainen E. Determinants of gamma-glutamyltransferase: positive interaction with alcohol and body mass index, negative association with coffee. Am J Epidemiol. 1997;146(12):1019–1024. | |
Moussavian SN, Becker RC, Piepmeyer JL, Mezey E, Bozian RC. Serum gamma-glutamyl transpeptidase and chronic alcoholism. Influence of alcohol ingestion and liver disease. Dig Dis Sci. 1985; 30(3):211–214. | |
Majumdar SK, Dias N, Aps EJ. Relationship between hepatic histology and conventional biochemical liver function test in chronic alcoholic patients. Drug Alcohol Depend. 1991;28(2):211–214. | |
Monteiro MG, Masur J. Monitoring alcoholism treatment: the appropriateness of choice between gamma GT or MCV evaluation after a short time of abstinence. Alcohol. 1986;3(4):223–226. | |
Lamy J, Baglin MC, Ferrant JP, Weill J. [Decrease in serum gamma-glutamyltranspeptidase following abstention from alcohol]. Clin Chim Acta. 30 1974;56(2):169–173. French. | |
Lamy J, Baglin MC, Aron E, Weill J. [Decrease in serum gamma-glutamyltranspeptidase following abstention from alcohol in cirrhotics (author transl)]. Clin Chim Acta. 1975;60(1):97–101. French. | |
Wu A, Chanarin I, Levi AJ. Macrocytosis of chronic alcoholism. Lancet. 1974;1(7862):829–831. | |
Buffet C, Chaput JC, Albuisson F, Subtil E, Etienne JP. [Macrocytosis in chronic alcoholic hepatitis (author’s transl)]. Arch Fr Mal App Dig. 1975;64(4):309–315. French. | |
Latvala J, Parkkila S, Niemelä O. Excess alcohol consumption is common in patients with cytopenia: studies in blood and bone marrow cells. Alcohol Clin Exp Res. 2004;28(4):619–624. | |
Latvala J. Effect of Alcohol Consumption and Acetaldehyde on Blood Cells and Molecules [dissertation]. Tampere, Finland: University of Tampere; 2004. | |
Lindenbaum J. Hematologic complications of alcohol abuse. Semin Liver Dis. 1987;7(3):169–181. | |
Niemelä O, Parkkila S. Alcoholic macrocytosis – is there a role for acetaldehyde and adducts? Addict Biol. 2004;9(1):3–10. | |
Hietala J, Koivisto H, Latvala J, Anttila P, Niemelä O. IgAs against acetaldehyde-modified red cell protein as a marker of ethanol consumption in male alcoholic subjects, moderate drinkers, and abstainers. Alcohol Clin Exp Res. 2006;30(10):1693–1698. | |
Kaartinen K, Niemelä O, Syrjänen J, et al. IgA immune responses against acetaldehyde adducts and biomarkers of alcohol consumption in patients with IgA glomerulonephritis. Alcohol Clin Exp Res. 2009;33(7):1231–1237. | |
Koivisto H, Hietala J, Anttila P, Parkkila S, Niemelä O. Long-term ethanol consumption and macrocytosis: diagnostic and pathogenic implications. J Lab Clin Med. 2006;147(4):191–196. | |
Hasselblatt M, Martin F, Maul O, Ehrenreich H, Kernbach-Wighton G. Persistent macrocytosis following abstinence from chronic alcohol use. JAMA. 2001;286(23):2946. | |
Cohen JA, Kaplan MM. The SGOT/SGPT ratio – an indicator of alcoholic liver disease. Dig Dis Sci. 1979;24(11):835–838. | |
Zhou SL, Gordon RE, Bradbury M, Stump D, Kiang CL, Berk PD. Ethanol up-regulates fatty acid uptake and plasma membrane expression and export of mitochondrial aspartate aminotransferase in HepG2 cells. Hepatology. 1998;27(4):1064–1074. | |
Matloff DS, Selinger MJ, Kaplan MM. Hepatic transaminase activity in alcoholic liver disease. Gastroenterology. 1980;78(6):1389–1392. | |
Nalpas B, Vassault A, Le Guillou A, et al. Serum activity of mitochondrial aspartate aminotransferase: a sensitive marker of alcoholism with or without alcoholic hepatitis. Hepatology. 1984;4(5):893–896. | |
Salaspuro M. Characteristics of laboratory markers in alcohol-related organ damage. Scand J Gastroenterol. 1989;24(7):769–780. | |
Flahaut C, Michalski JC, Danel T, Humbert MH, Klein A. The effects of ethanol on the glycosylation of human transferrin. Glycobiology. 2003;13(3):191–198. | |
Landberg E, Åström E, Kågedal B, Påhlsson P. Disialo-trisialo bridging of transferrin is due to increased branching and fucosylation of the carbohydrate moiety. Clin Chim Acta. 2012;414:58–64. | |
Arndt T. Carbohydrate-deficient transferrin as a marker of chronic alcohol abuse: a critical review of preanalysis, analysis, and interpretation. Clin Chem. 2001;47(1):13–27. | |
Stibler H, Allgulander C, Borg S, Kjellin KG. Abnormal microheterogeneity of transferrin in serum and cerebrospinal fluid in alcoholism. Acta Med Scand. 1978;204(1–2):49–56. | |
Stibler H, Borg S. Glycoprotein glycosyltransferase activities in serum in alcohol-abusing patients and healthy controls. Scand J Clin Lab Invest. 1991;51(1):43–51. | |
Sillanaukee P, Pönniö M, Seppä K. Sialic acid: new potential marker of alcohol abuse. Alcohol Clin Exp Res. 1999;23(6):1039–1043. | |
Sillanaukee P, Strid N, Allen JP, Litten RZ. Possible reasons why heavy drinking increases carbohydrate-deficient transferrin. Alcohol Clin Exp Res. 2001;25(1):34–40. | |
Helander A, Eriksson G, Stibler H, Jeppsson JO. Interference of transferrin isoform types with carbohydrate-deficient transferrin quantification in the identification of alcohol abuse. Clin Chem. 2004;7(7):1225–1233. | |
Jeppsson JO, Arndt T, Schellenberg F, et al; International Federation of Clinical Chemistry and Laboratory Medicine Working Group on Standardization of Carbohydrate-deficient Transferin (IFCC-WG-CDT). Toward standardization of carbohydrate-deficient transferrin (CDT) measurements: I. Analyte definition and proposal of a candidate reference method. Clin Chem Lab Med. 2007;45(4):558–562. | |
Dibbelt L. Does trisialo-transferrin provide valuable information for the laboratory diagnosis of chronically increased alcohol consumption by determination of carbohydrate-deficient transferrin? Clin Chem. 2000;46(8 Pt 1):1203–1205. | |
Gonzalo P, Pecquet M, Bon C, et al. Clinical performance of the carbohydrate-deficient transferrin (CDT) assay by the Sebia Capillarys2 system in case of cirrhosis. Interest of the Bio-Rad %CDT by HPLC test and Siemens N-Latex CDT kit as putative confirmatory methods. Clin Chim Acta. 2012;413(7–8):712–718. | |
Potter BJ, Chapman RW, Nunes RM, Sorrentino D, Sherlock S. Transferrin metabolism in alcoholic liver disease. Hepatology. 1985;5(5):714–721. | |
Stibler H, Borg S, Joustra M. Micro anion exchange chromatography of carbohydrate-deficient transferrin in serum in relation to alcohol consumption (Swedish Patent 8400587-5). Alcohol Clin Exp Res. 1986;10(5):535–544. | |
Lesch OM, Walter H, Antal J, et al. Alcohol dependence: is carbohydrate-deficient transferrin a marker for alcohol intake? Alcohol Alcohol. 1996;31(3):257–264. | |
Walter H, Hertling I, Benda N, et al. Sensitivity and specificity of carbohydrate-deficient transferrin in drinking experiments and different patients. Alcohol. 2001;25(3):189–194. | |
Lesch OM, Walter H, Antal J, et al. Carbohydrate-deficient transferrin as a marker of alcohol intake: a study with healthy subjects. Alcohol Alcohol. 1996;31(3):265–271. | |
Appenzeller BM, Schneider S, Maul A, Wennig R. Relationship between blood alcohol concentration and carbohydrate-deficient transferrin among drivers. Drug Alcohol Depend. 2005;79(2):261–265. | |
Stibler H, Borg S. Carbohydrate composition of serum transferrin in alcoholic patients. Alcohol Clin Exp Res. 1986;10(1):61–64. | |
Weykamp C, Wielders JP, Helander A, et al; IFCC Working Group on Standardization of Carbohydrate-Deficient Transferrin (WG-CDT). Toward standardization of carbohydrate-deficient transferrin (CDT) measurements: III. Performance of native serum and serum spiked with disialotransferrin proves that harmonization of CDT assays is possible. Clin Chem Lab Med. 2013;51(5):991–996. | |
Capillarys CDT. [technical notice]. SEBIA, Evry, France. 2008. French. | |
N Latex CDT Kit. [technical notice]. Siemens Healthcare Diagnostic Products GmbH, Marbury, Germany. 2009. French. |
 © 2014 The Author(s). This work is published and licensed by Dove Medical Press Limited. The
full terms of this license are available at https://www.dovepress.com/terms
and incorporate the Creative Commons Attribution
- Non Commercial (unported, 3.0) License.
By accessing the work you hereby accept the Terms. Non-commercial uses of the work are permitted
without any further permission from Dove Medical Press Limited, provided the work is properly
attributed. For permission for commercial use of this work, please see paragraphs 4.2 and 5 of our Terms.
© 2014 The Author(s). This work is published and licensed by Dove Medical Press Limited. The
full terms of this license are available at https://www.dovepress.com/terms
and incorporate the Creative Commons Attribution
- Non Commercial (unported, 3.0) License.
By accessing the work you hereby accept the Terms. Non-commercial uses of the work are permitted
without any further permission from Dove Medical Press Limited, provided the work is properly
attributed. For permission for commercial use of this work, please see paragraphs 4.2 and 5 of our Terms.