Back to Journals » International Journal of Nanomedicine » Volume 13
Bilirubin detoxification using different phytomaterials: characterization and in vitro studies
Authors Mathew BT ![]() , Raji S, Dagher S, Hilal-Alnaqbi A
, Raji S, Dagher S, Hilal-Alnaqbi A ![]() , Mourad AHI
, Mourad AHI ![]() , Al-Zuhair S
, Al-Zuhair S ![]() , Al Ahmad M, El-Tarabily KA
, Al Ahmad M, El-Tarabily KA ![]() , Amin A
, Amin A ![]()
Received 28 December 2017
Accepted for publication 14 March 2018
Published 23 May 2018 Volume 2018:13 Pages 2997—3010
DOI https://doi.org/10.2147/IJN.S160968
Checked for plagiarism Yes
Review by Single anonymous peer review
Peer reviewer comments 2
Editor who approved publication: Dr Thomas Webster
Betty Titus Mathew,1 Shaima Raji,2 Sawsan Dagher,1 Ali Hilal-Alnaqbi,1,3 Abdel-Hamid Ismail Mourad,1,4 Sulaiman Al-Zuhair,5 Mahmoud Al Ahmad,2 Khaled Abbas El-Tarabily,6 Amr Amin6,7
1Mechanical Engineering Department, College of Engineering, United Arab Emirates University, Al Ain, United Arab Emirates; 2Electrical Engineering Department, College of Engineering, United Arab Emirates University, Al Ain, United Arab Emirates; 3Abu Dhabi Polytechnic, Abu Dhabi, United Arab Emirates; 4Mechanical Design Department, Faculty of Engineering, Helwan University, Helwan, Cairo, Egypt; 5Chemical Engineering Department, College of Engineering, United Arab Emirates University, Al Ain, United Arab Emirates; 6Biology Department, College of Science, United Arab Emirates University, Al Ain, United Arab Emirates; 7Department of Zoology/College of Science, Cairo University, Giza, Egypt
Background: Activated carbon (AC) is a common adsorbent that is used in both artificial and bioartificial liver devices.
Methods: Three natural materials – date pits of Phoenix dactylifera (fruit), Simmondsia chinensis (jojoba) seeds, and Scenedesmus spp. (microalgae) – were used in the present investigation as precursors for the synthesis of AC using physical activation. The chemical structures and morphology of AC were analyzed. Then, AC’s bilirubin adsorption capacity and its cytotoxicity on normal liver (THLE2) and liver cancer (HepG2) cells were characterized.
Results: Compared with the other raw materials examined, date-pit AC was highly selective and showed the most effective capacity of bilirubin adsorption, as judged by isotherm-modeling analysis. MTT in vitro analysis indicated that date-pit AC had the least effect on the viability of both THLE2 and HepG2 cells compared to jojoba seeds and microalgae. All three biomaterials under investigation were used, along with collagen and Matrigel, to grow cells in 3D culture. Fluorescent microscopy confirmed date-pit AC as the best to preserve liver cell integrity.
Conclusion: The findings of this study introduce date-pit-based AC as a novel alternative biomaterial for the removal of protein-bound toxins in bioartificial liver devices.
Keywords: activated carbon, adsorption, cytotoxicity, phytomaterials, in vitro analysis, 3D cultures, 2D cultures
Introduction
Acute liver failure (ALF) is a life-threatening and devastating illness that occurs most often in patients who do not have a preexisting liver disease. The disease leads to a cascade of other diseases/complications that may lead to mortality.1 ALF is associated with hepatic dysfunction, abnormal liver biochemical values, coagulopathy, and encephalopathy that is often followed by multiorgan failure and death. Rates of survival have been improved in recent years by blood purification systems, such as the molecular adsorbent recirculating system, which removes both albumin-bound (middle-chain fatty acids, tryptophan and its metabolites, toxic bile acids, and bilirubin) and water-soluble (ammonia, phenylalanine, and tyrosine) toxins or is used in emergency liver transplantation.2 However, liver transplantation in most cases is not readily accessible, due to the lack of matching donors and the complications that usually follow transplantation.
Several biological and nonbiological methods have been used to develop an artificial liver device.3 Activated carbon (AC) is one of the adsorbents used in artificial and bioartificial liver (BAL) devices. Thanks to its ready abundance, reasonable cost, high porosity, advantageous blood compatibility, high chemical and thermal stability, large surface area, and adsorption capacity toward different compounds, most hemoperfusion systems employ AC as an adsorbent to remove bilirubin.4,5 With nanopores <1 nm, the adsorption capacities of AC materials are relatively low toward bilirubin.6 Recently, several carbon-based materials have been reported as new potential bilirubin adsorbents seeking to improve the adsorption efficiency of liver support devices.7,8 Maintenance of cell viability and functionality throughout treatment and implementing cell-housing devices at the patient’s bedside continue to be major unresolved challenges.9 Among cell-housing devices, extracorporeal liver-assistance devices are those that describe all measures of extracorporeal blood treatments that help different functions of the liver in an attempt to minimize the number of failing organs as a consequence of liver failure, thus prolonging patient survival. Extracorporeal liver-assistance devices do not eliminate the cause of the disease, but instead allow time for liver regeneration and/or providing a bridge to patients waiting for a liver transplant, and thus represent an attractive alternative that may improve patients’ prognoses.10 This goal can be reached via inducing hepatocytes to perform liver functions and process externally circulated plasma/blood of liver failure patients. Hepatocytes are often cultured in a cell-housing bioreactor that makes up an essential biological component of BAL devices. Significant developments have been made in enhancing in vitro culturing hepatocytes, yet matrix synthesis and reactor assembly in BAL devices are still lagging. Limited conventional transport, nutritional gradients across the reactor, nonuniform seeding, inefficient immobilization, and poor growth of hepatocytes are only a few limitations that BAL device technology is currently facing. Therefore, new cell culture device designs are required to bring improvement in cellular component efficiency.11 Primary hepatocytes or hepatic cell lines are used in these devices. The hepatic cell lines derived from porcine hepatocytes or from tumor cell lines may sometimes create infection and malignancy transmission.12 Human hepatocytes may then be the best source of cells for future studies of extracorporeal liver-assistance devices.13
Cytotoxicity assaying of cells grown in culture is a widely used method to predict the potential toxic effects of various compounds on the cells.14 There are several commonly used cytotoxicity assays that are currently being used, like ATP measurement, MTT, neutral red, membrane integrity/LDH release, macromolecular synthesis, and glutathione depletion.15–17 Raw materials, such as date pits, jojoba seeds, and microalgae, are inexpensive biomass sources. They contain large carbohydrate content, accounting for >50% of the composition, and have low ash content.18–20 The preparation of AC from date pits, jojoba, and microalgae raw materials has, however, scarcely been reported. AC prepared from date pits by chemical activation has been utilized for methyl orange adsorption.18 AC has been prepared from jojoba-seed residue by chemical activation and the effects of process variables like AC, particle size, and chemical reagent studied.19 AC has been prepared from microalgae by the combination of hydrothermal carbonization and KOH-activation processes.20
3D culture systems are now widely used instead of 2D (or static) culture, as the former represents the microenvironment where cells actually reside in tissues. Studies have shown that the behavior of 3D cultured cells recapitulates the in vivo cellular responses much better.21–24 3D culture systems are employed in drug discovery, cancer cell biology, stem cell research, tissue engineering, and other cell-based analyses.25–27 3D cultures of various cell lines have been used for drug screening, cytotoxicity assays, and cell–biomaterial interaction, where biomaterials used were collagen, collagen–chitosan, Matrigel, fibrinogen matrices, alginate, PuraMatrix scaffolds, and polyethylene glycol matrices.22,24 To examine AC of date pits, jojoba seeds, and microalgae as cell carriers in a BAL bioreactor, HepG2 human cancer cells were assessed, in addition to THLE2 normal liver cells. The rationale was that primary hepatocytes are normally functionally viable for a short period.23 Moreover, culturing primary hepatocytes in a bioreactor at high cell density (as required for a BAL bioreactor) may lead to oxygen deprivation that could reduce cell viability by shear stress due to continuous flow.28 Cell lines in 2D culture cannot be studied more than 72 hours, since the cells need media to be changed or remain in a stationary state. To overcome this limitation, 3D cultured cells in bioreactors are often grown on scaffolds, matrices, or microcarriers that are dependent on the growth characteristics of those cells (adherent or suspension).28–31
In the present study, AC prepared from the different sources under examination was tested for the adsorption of bilirubin from both albumin-containing and albumin-free solutions. To our knowledge, this study is the first to assess the effects of AC prepared from date pits, jojoba, and microalgae on bilirubin adsorption. The capacity and effectiveness of AC is often dependent on the precursor used and the activation technique adopted. Therefore, in this report, AC was prepared using raw date pits, jojoba, and microalgae as carbon precursors, and the selective adsorption of the AC toward bilirubin was evaluated. Finally, the cytotoxicity of the AC synthesized here was assessed both in THLE2 and HepG2 cells cultured in 2D and 3D settings.
Materials and methods
Preparation of activated carbon
Raw date pits (locally collected), jojoba seeds (Simmondsia chinensis; Egyptian Natural Oil, Cairo, Egypt), and dried microalgae cells (Scenedesmus spp.; Algal Oil Company, Manila, Philippines) were collected, washed with deionized water, dried, and grinded using an electric agitated mortar (JK-G-250B2; Jingke Scientific Instrument, Shanghai, China). Physical activation of the raw materials was carried out in a tube furnace (GSL-1500X; MTI Corporation, Richmond, VA, USA) with carbonization followed by activation. Samples were placed in crucibles and kept inside the furnace. N2 gas was passed for 10 minutes, then the temperature was gradually increased under a constant flow of N2 at a rate of 5°C/minute up to 600°C and maintained at this temperature for 4 hours. The carbonaceous material was then activated at 900°C in the same furnace under the flow of CO2 gas instead of N2 gas.30 The as-prepared AC was then sieved using a US standard testing sieve (according to ASTM E-II specification for mesh size of 200–300 μm) for use in the adsorbent experiments. For the preparation of AC nanomaterials (nano-AC), AC was wet-ground in an RM 100 grinder (Retsch, Haan, Germany) and then dried in a freeze-dryer (Telstar, Terrassa, Spain) at −55°C and 0.02 mbar for 6 hours. The material was then filtered using a 0.45 μm polytetrafluoroethylene filter (Thomas Scientific, Swedesboro, NJ, USA) prior to use in the cytotoxicity experiments.
Characterization techniques
The surface morphology and energy-dispersive spectroscopy of the AC samples were examined using scanning electron microscopy (SEM) at 3 kV accelerating voltage (JSM-5600; JEOL, Tokyo, Japan). AC samples were dried overnight in a hot oven at 105°C. Samples were mounted on an adhesive carbon tape attached to an aluminum stub and subsequently sputter-coated with a gold layer.18 Chemical structure was analyzed with Fourier-transform infrared spectroscopy (Thermo Nicolet Nexus 470; GMI, Ramsey, MN, USA). For this analysis, AC samples were oven-dried at 110°C overnight, stored in capped flasks, and kept in a desiccator prior to analysis. Testing samples were prepared by mixing the particles with potassium bromide powder (Sigma-Aldrich, St Louis, MO, USA) and then compressed into pellets. Pellets were then placed in a sample holder and spectra recorded for wave numbers of 400–4,000 cm−1.
Size distribution measurements of Nano-AC were conducted by dynamic light scattering using a Zetasizer Nano ZS (Zen360; Malvern Panalytical, Malvern, UK) at 25°C. The ζ-potential was measured in a clear disposable ζ-cell (DTS 1060C) with the same machine. The nano-AC powder was suspended in deionized water (H2O) using sonication.16 Carbon samples were examined by differential scanning calorimetry (DSC; Q 2000; TA Instruments, New Castle, DE, USA). A sample was heated from 25°C to 600°C at a heating rate of 10°C/minute with a nitrogen flow rate of 50 mL/minute. Thermogravimetric analysis (TGA) was carried out using a Q50 analyzer (TA Instruments).32–34 Samples of AC were heated from 25°C to 800°C at a heating rate of 10°C/minute with a nitrogen flow rate of 40 mL/minute.
Adsorption experiments
Albumin (molecular weight 66,000 g/mol), bilirubin (molecular weight 584.7 g/mol) and all other chemicals were purchased from Sigma-Aldrich. All experiments were conducted in a dark room using brown flasks to avoid photodegradation of toxins. The stability of the prepared solutions was tested by running control experiments without adsorbents for 1 week. Bilirubin stock solution of 80 μM was prepared by dissolving 30.4 g solid bilirubin in 650 mL 0.1 M NaOH solution. To that, 26 mL 2% (w:v) albumin solution was added. The volume was completed to 1 L by adding PBS, bringing the final pH to 7.4. From the stock solution, two dilutions of 60 and 30 μM were prepared.7,32
Batch adsorption experiments were performed using AC prepared from date pits, jojoba and microalgae by mixing 40 mL bilirubin–albumin solutions with specific amounts of AC: 0 g (control), 0.1, 0.5, and 0.8 g for each of the three types of AC. The bottles were then kept in a water-bath shaker (Shimadzu, Kyoto, Japan) at 37°C to mimic human body temperature.6 Shaking speed was kept constant at 100 rpm for all the runs, which was high enough to disperse the AC sample uniformly in the solution. Readings were recorded by ultraviolet-visible spectrophotometry (UV-1800; Shimadzu) at wavelengths of 416 and 279 nm to evaluate bilirubin and albumin concentrations, respectively. At these wavelengths, the bilirubin extinction coefficient is independent of albumin/bilirubin molar ratio.8,35 Calibration was obtained by measuring the optical density of known concentrations of bilirubin and albumin at their respective wavelengths.
Cell culture and propagation
Two human cell lines were purchased from the American Type Culture Collection (ATCC; Manassas, VA, USA): the normal liver cell line THLE2 and the tumor cell line HepG2. THLE2 cells were maintained in bronchial epithelial cell-growth medium (Lonza, Basel, Switzerland) supplemented with heat-inactivated FBS (HyClone; GE Healthcare, Little Chalfont, UK) at a final concentration of 10% and 1% penicillin and streptomycin (Thermo Fisher Scientific, Waltham, MA, USA) and 0.1% gentamicin solution under humidified air with 5% CO2 at 37°C. HepG2 cells were cultured in DMEM (HyClone) supplemented with heat-inactivated FBS to a final concentration of 10% and 1% penicillin–streptomycin solution under humidified air with 5% CO2 at 37°C. Cells were cultured in flasks precoated with collagen I (2.9 mg/mL), fibronectin (1 mg/mL), and bovine serum albumin (1 mg/mL) in bronchial epithelial cell-growth medium according to ATCC guidelines.
THlE2 and HepG2 cells frozen in liquid nitrogen were thawed in a 37°C water bath for 2 minutes. Frozen medium was removed by suspending the contents of one vial in 20 mL propagation medium in a 50 mL Falcon tube. The thawed cells were centrifuged at 1,000 rpm for 5 minutes at 4°C. Cell pellets were resuspended in propagation medium (20% DMEM for HepG2 and 20% bronchial epithelial basal medium for THLE2) and seeded in precoated T25 flasks. Flasks were incubated at 37°C and 5% CO2 for 2–3 days. Cells were cultured until they attained 40%–60% confluence, then dissociated using trypsin–EDTA solution, resuspended in their respective media, and counted using a hemocytometer (Agar Scientific, Stansted Mountfitchet, UK). Cell viability was assessed using the trypan blue exclusion-assay method.21,22 Trypan blue (50 μL) was mixed with 50 μL cell suspension. This suspension (5–10 μL) was then pipetted into the cell-counting chamber of the hemocytometer. Trypan blue penetrates only dead cells, which appear dark blue. Viable and dead cells were detected under light microscopy (CX43; Olympus, Tokyo, Japan). Cell viability was determined to be >90% prior to the seeding of cells.
3D culturing methods were implemented along with 2D culturing; the former is presently used for studies in BAL devices.36 Cells at a density of 3×10⁵ cells/cm2 and in a volume of 250 μL cell medium/cm2 culture plates were used. Matrigel matrix (354248; Corning, NY, USA), a thick gel, was used for culturing the cells. Preparation of Matrigel was carried out as per the manufacturer’s protocol with a final concentration of 5 mg/mL and 150 μL Matrigel/cm2 culture vessel surface.22,24 The medium was changed every 2 days.
Cytotoxicity assays
MTT (Sigma-Aldrich) assays are used for the quantification of mitochondrial activity by measuring the formation of a dark blue formazan product formed by the reduction of the tetrazolium ring of MTT.14,17 The accumulated formazan was dissolved in a detergent and analyzed spectrophotometrically at 570 nm. The amount of formazan is proportional to the number of the viable cells. THLE2 and HepG2 cells were seeded at 5×10³ cells/mL by adding 100 μL cell suspension to each well of a 96-well tissue-culture plate.17,21 The plate was incubated for sufficient time to assure attachment and 40%–60% confluence. A total of 250 μg/mL nano-AC was considered the stock solution, from which concentrations of AC of 12.5–62.5 μg/mL were added to each well. The last row was left untreated with nano-AC (control). Another row was treated as blank (ie, media alone). Nano-AC produced from date pits, microalgae, and jojoba was investigated. Plates were incubated at 37°C, 5% CO2, for 1, 2, and 3 hours. After incubation with the nano-AC, media was aspirated off and replaced with fresh media. Then, MTT solution (10 μL) for a total volume of 100 μL was added to every well and incubated for 3 hours at 37°C with 5% CO2. Subsequently, MTT-containing medium was removed gently and replaced with dimethyl sulfoxide (100 μL per well) to mix the formazan crystals until dissolved. After 20 minutes, absorbance was measured at 570 nm for each well using a microtiter plate reader (XL800; BioTek, Winooski, VT, USA). Cell viability was calculated as percentage of untreated control values (ie, optical density of treated cells/optical density of control).21
Characterization of cell morphology
Hematoxylin and eosin is the standard histologic stain used to evaluate cell structure. Cultured cells were treated with 62.5 μg/mL nano-AC for 24 hours, fixed with ice-cold methanol:ethanol (1:1) for 15 minutes, and air-dried. Coverslips were washed quickly six times in distilled water. Cells were stained with hematoxylin solution for 2 minutes and then rinsed in H2O, then counterstained with eosin for 10 seconds. Coverslips were rinsed in ethanol series (70%, 96%, and 100%), air-dried, mounted with DPX (distyrene, plasticizer, xylene; Sigma-Aldrich) and visualized under bright-field microscope (OLYMPUS, IX83 research inverted microscope 2DECK, Tokyo, Japan) equipped with a camera (DP73; Olympus, Tokyo, Japan).37
For fluorescent microscopy investigation, THLE2 and HepG2 cells were harvested by trypsinization and 3×10⁵ cells/mL plated on sterile coverslips placed in 10 mm petri plates. Cells on coverslips were contained initially in their respective media (1 L/coverslip) for 24 hours at 37°C in a 5% CO2 incubator. Cell cultures were then treated with 62.5 μg/mL nano-AC and incubated for 24 hours. Cells were washed twice with DPBS (Sigma-Aldrich), then fixed in 4% paraformaldehyde (Sigma-Aldrich) for 10 minutes at room temperature.28,37 Cells were washed and permeabilized with 0.1% Triton X-100 for 5 minutes, fluorescein isothiocyanate (FITC)-labeled phalloidin added, and kept incubated for 40 minutes.38–40 Cells were washed with DPBS and 0.1% Triton X-100 for 4 minutes. Samples were mounted with DAPI–Fluoroshield (Sigma-Aldrich) for 10 minutes, then washed to remove the excess DAPI.40 Finally, coverslips were fixed on frosted slides with the DPX mountant. Similarly, the 3D cultured cells were allowed to grow in Matrigel and collagen for 10 days.24,38 Matrigel acts as a framework for cells to grow and mimic the conditions inside the human body. The rate of growth in 3D culture is much slower compared to normal culture, especially in the case of normal cells. The cells attached themselves to the Matrigel and were stained with phalloidin–FITC and DAPI–Fluoroshield fluorescent dyes using the same procedure for the 2D cultured cells.
Data analysis
Data analysis was carried out with t-tests (two-tailed distribution, significant at P<0.05). Readings were collected at three time points post nano-AC administration.
Results and discussion
Phytomaterials and AC characterization
Figure 1 shows SEM images of raw date-pit powder and the AC produced from date pits, jojoba seeds, and microalgae. There were significant differences between the surface morphology of each of them. SEM images of date-pit powder before activation showed an absence of pores (Figure 1A). Pores with a diameter of around 5 μm were formed after activation for 1 hour (Figure 1B and C). Date-pit AC exhibited an even, homogeneous, highly porous, and well-pronounced array of honeycomb structures, indicating the possibility of the toxins to be trapped and adsorbed. The zoomed-in image of Figure 1C shows arrays of threadlike structures that form the walls of the pores and thus highly increase the surface area. Figure 1D–F shows jojoba-seed AC images that demonstrated almost uniform pore structure with channels and large holes in the shape of both macropores and mesopores. Each channel contained a large number of mesopores, as indicated in the zoomed-in image of Figure 1F. Figure 1G–I shows microalgae AC images that demonstrate fiber-like structures. The fibers were connected, with cavities between each other. Pores created on the external surface of the carbon during the activation process were mainly due to the release of volatile matter. This can be attributed to the presence of metallic atoms intercalating the carbon matrix, resulting in the widening of spaces between carbon atomic layers.
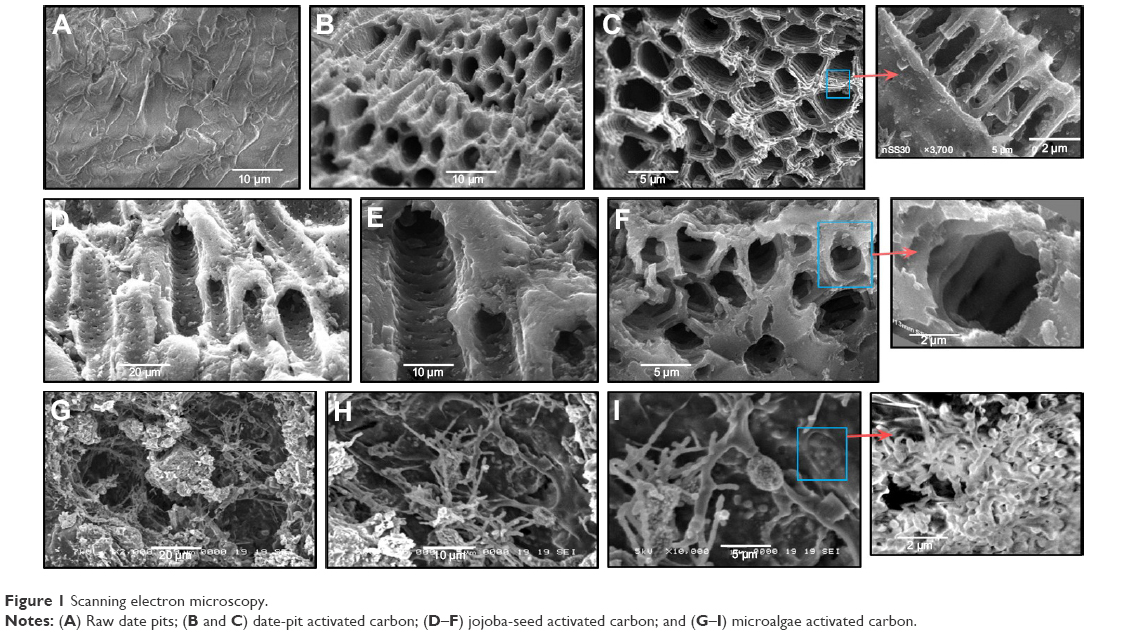 | Figure 1 Scanning electron microscopy. |
The results of the elemental analysis of AC obtained from the three precursors – date pits, jojoba seeds, and microalgae – at 900°C activation temperature are shown in Table 1, showing mass percentages of carbon, hydrogen, nitrogen, and oxygen. Insignificant amounts of other elements were found, but are not shown in the table, such as sodium, potassium, calcium, magnesium, phosphorus, and iron. The carbon and nitrogen content of jojoba-seed AC were highest. However, the oxygen content was lowest. Furthermore, the carbon and nitrogen content of microalgae AC was lowest. Date-pit AC showed carbon-, hydrogen-, nitrogen-, and oxygen-content values of 49.82%, 4.12%, 4.02%, and 28.18%, respectively. This is due to the release of volatiles during carbonization that results in the elimination of noncarbon species and enrichment of carbon.18,41
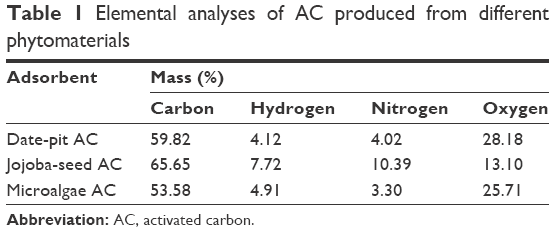 | Table 1 Elemental analyses of AC produced from different phytomaterials |
Figure 2 shows Fourier-transform infrared spectra of the three samples of AC synthesized from date pits, jojoba seeds, and microalgae in the wave-number range 400–4,000 cm−1. The three AC samples showed almost similar functional groups with intensity variation. As a result of physical activation, carbonization and activation of the raw materials causes the decomposition of O2 and H groups.41–43 Oxygen bonds to peripheral carbon atoms, from which different functional groups arise.18 The bands around 3,400 cm−1 are attributed to the asymmetric and symmetric stretching vibrations of O−H bonds and indicate the presence of carboxylic acid on the surface of the AC. Other peaks observed at 2,300–2,350 cm−1 are assigned to aliphatic bands. Peaks at 1,400–1,700 cm−1 are attributed to conjugated stretching of C−O, C=C, C=O of carbonyl groups. Date-pit AC showed a broad band around 1,030 cm−1 that is attributed to C−O stretching. This indicates the presence of acids, alcohols, and phenols. The band at 650 cm−1 is due to plane-ring deformation.
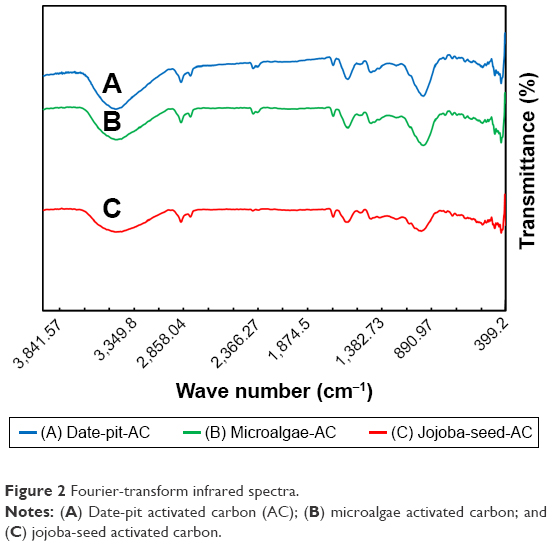 | Figure 2 Fourier-transform infrared spectra. |
Figure 3A shows the size distribution of nano-AC produced from date-pit deionized water (H2O) dispersion. It has a large size distribution in of 65–350 nm, and most particles were <200 nm, with an average size of 135 nm. Figure 3B shows the size distribution of nano-AC produced from jojoba seeds in H2O dispersion. It has a narrow size distribution, with an average size of 284 nm. Figure 3C shows the size distribution of nano-AC produced from microalgae in H2O dispersion. It has a large size distribution of 170–700 nm, with average size of 344 nm.18,40 Figure 3A shows that most particles were <200 nm, with an average size of 135 nm. Figure 3B shows a narrow size distribution, with an average size of 284 nm. Figure 3C shows a large size distribution of 170–700 nm, with average size of 344 nm.18,40
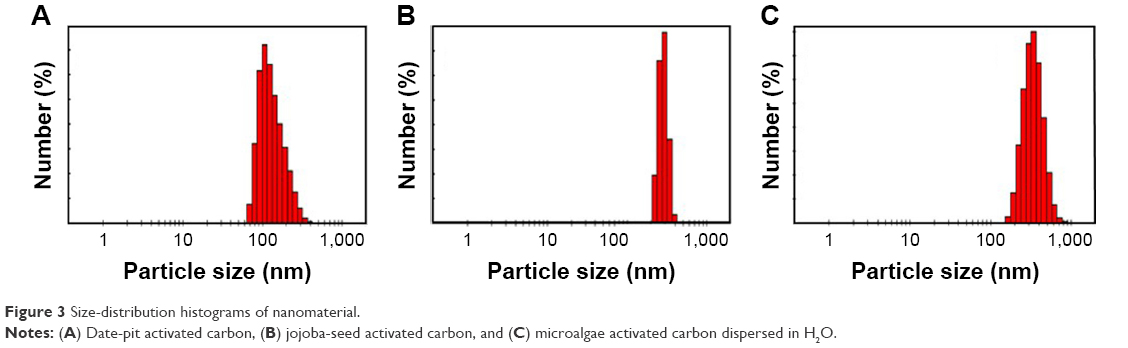 | Figure 3 Size-distribution histograms of nanomaterial. |
Figure 4 shows ζ-potential values of −10.1 mV for date-pit nano-AC, −26.3 mV for jojoba-seed nano-AC, and −42.7 mV for microalgae nano-AC in H2O suspension. Date-pit nano-AC had small negative charge on the surface, which indicates less stability and affinity to agglomerate with time into clusters, whereas the microalgae nano-AC produced had high stability and homogeneity, due to the repulsive force among particles. This was indicated by the huge negative surface charge of the particles. By increasing the stability of nano-AC in suspension, adsorption and removal of various toxin molecules will be enhanced.16,44,45
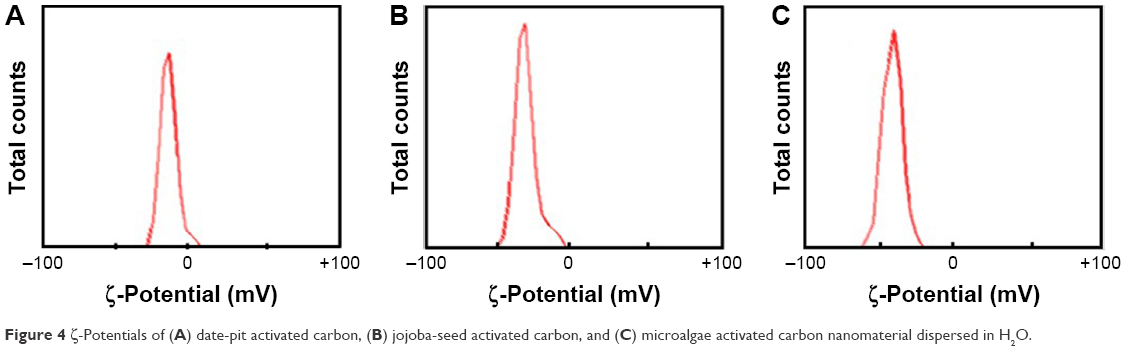 | Figure 4 ζ-Potentials of (A) date-pit activated carbon, (B) jojoba-seed activated carbon, and (C) microalgae activated carbon nanomaterial dispersed in H2O. |
In order to determine general decomposition characteristics of the raw phytomaterials during activation, samples were subjected to TGA. Figure 5A shows the TGA curves of date pits, jojoba seeds, and microalgae in N2 atmosphere at a 10°C/minute heating rate. The thermal decomposition of the three samples took place in three stages. At the first stage of the date pits, a sharp weight loss of the raw material was observed: about 12% at 35°C–100°C. The first stage presented a significant weight loss, due to much volatility released mainly due to the evaporation of water. The second stage obtained at 100°C–450°C was about 10%, in which the carbonization process began and mainly hemicellulose and cellulose fractions decomposed. At higher temperatures (450°C–800°C), the weight loss was due to lignin decomposition. The TGA curve of jojoba seeds showed about 8% weight loss up to 250°C, due to dehydration of the sample. During the next stage, progressive and significant weight loss was observed up to 450°C, thanks to the decomposition of cellulose and hemicellulose of the sample to condensable gas (acetic acid, methanol, and tar) and incondensable gas (CO, CO2, CH4, H2, H2O). At the third stage, lignin began to decompose and contribute to the weight loss. Also, the residual volatility from the first stage was further released, but carbon was left. The TGA curve of microalgae showed a small decrease at the first stage, as the examined microalgae cells had already dried.33,34 Then, progressive and significant weight loss was observed from 140°C to 600°C, wherein most of the organic materials were decomposed, since microalgae is not lignocellulosic in composition, but instead comprised of lipids, proteins, nucleic acids, and carbohydrates.18 The third stage >600°C showed carbonaceous matters in the solid residuals starting to decompose. From TGA results, it can be stated that temperatures >800°C are more appropriate for pyrolysis and activation of raw materials.33,34
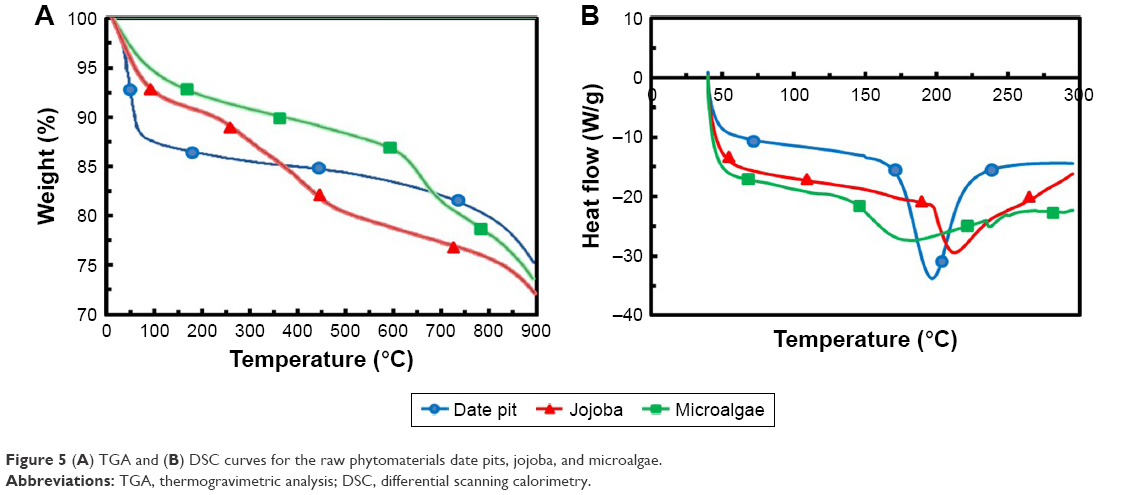 | Figure 5 (A) TGA and (B) DSC curves for the raw phytomaterials date pits, jojoba, and microalgae. |
Figure 5B shows DSC curves. These showed a small drop in temperature in the first stage, because the samples needed to heat to evaporate the remaining water.33 DSC of date pits and jojoba seeds showed valleys at about 200°C and 212°C, respectively, where hemicellulose and cellulose decomposed and produced plentiful organic compounds, such as tar, ketone, and methanol, which would vaporize by adsorbing large amount of heat. Microalgae, however, arrived at its valley at about 180°C, as lipids, proteins, nucleic acids, and noncellulosic carbohydrates decomposed at lower temperature.18
Adsorption properties
Figure 6A, C, and E shows bilirubin adsorption via date-pit AC, jojoba-seed AC, and microalgae AC, respectively, using 0.1, 0.5, and 0.8 g of each at an initial bilirubin concentration of 30 μM in the bilirubin–albumin solution. The insignificant drop in bilirubin concentration in the control experiments (P<0.05), without adsorbent, proves that the drop was mainly due to the adsorption. The amount of bilirubin increased with increased AC amount, and it was observed that the highest adsorption rate of bilirubin occurred within the first 4 hours.6,7 Adsorption typically exhibits two stages. In the initial stage, external surface adsorption dominated, where bilirubin diffused from the solution to the external surface of the adsorbent. This step was mainly controlled by the surface adsorption kinetic rate. Once the external surface had been saturated with the bilirubin molecules, the second stage started, wherein internal diffusion becomes more important and often leads to a steady decrease in adsorption rate.7,35
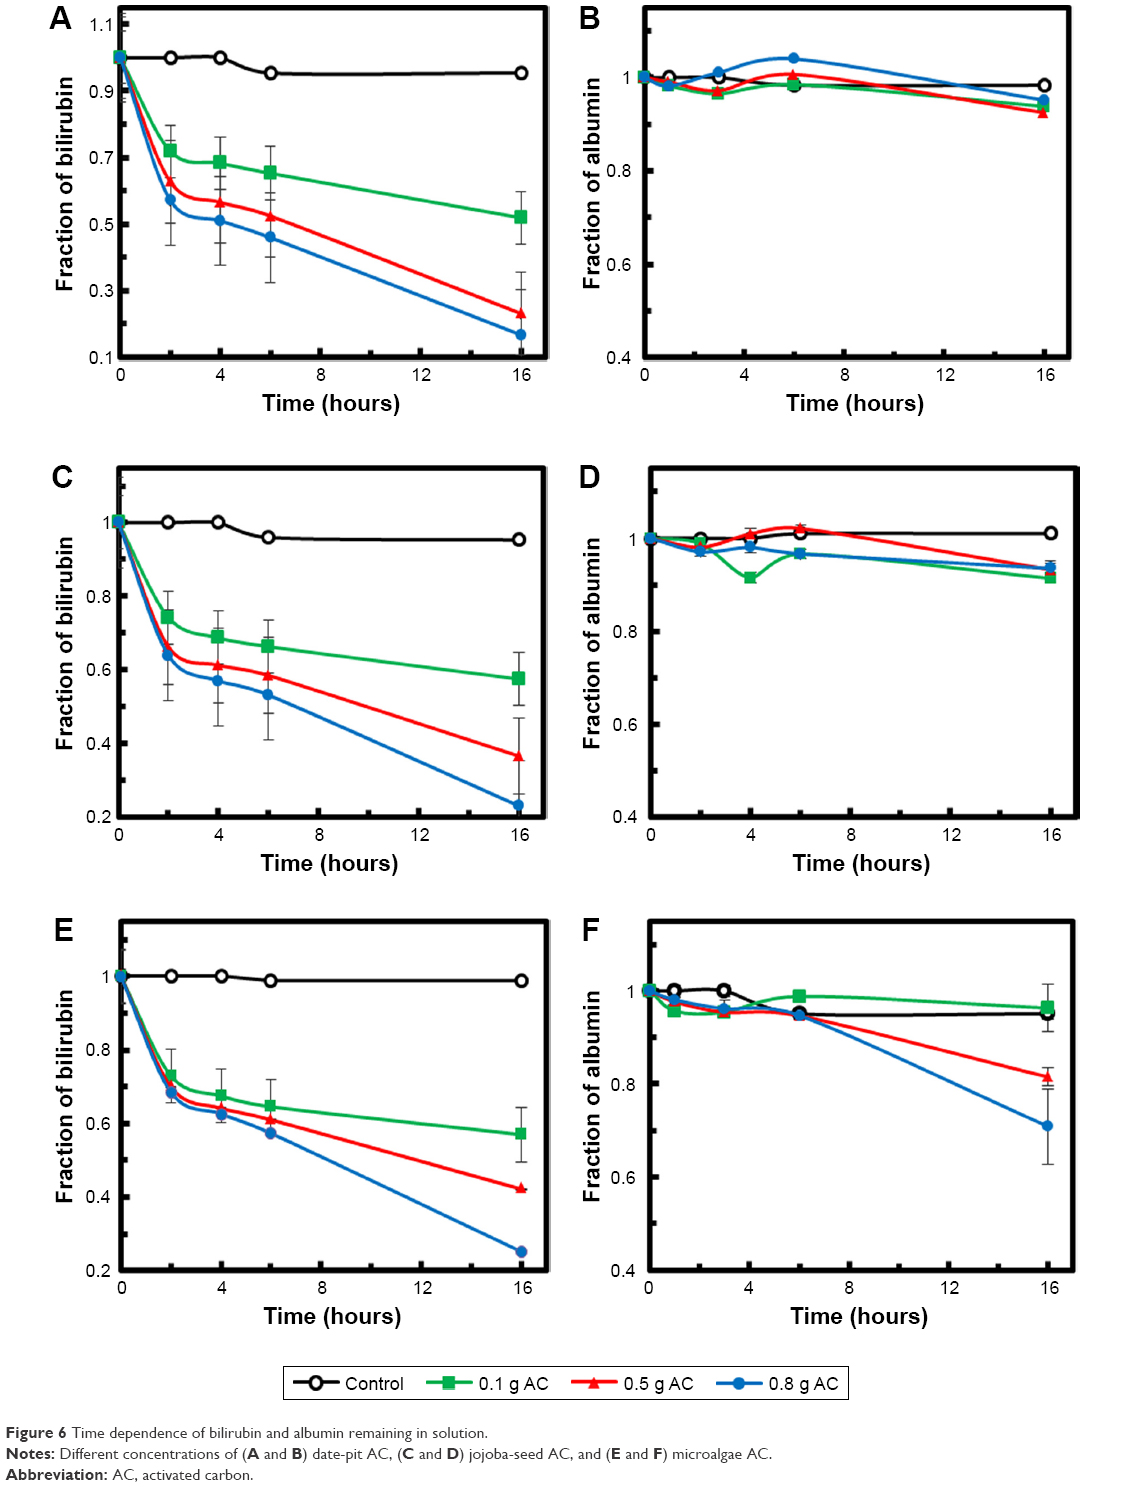 | Figure 6 Time dependence of bilirubin and albumin remaining in solution. |
Figure 6B, D, and F shows the albumin concentration in the same solutions with date-pit AC, jojoba-seed AC, and microalgae AC, respectively, using 0.1, 0.5, and 0.8 g of each. It was clearly demonstrated that in the presence of AC, the drop in albumin concentration was insignificant. This suggests that the as-synthesized AC samples were able to strip the bilirubin molecules from the bilirubin–albumin complex, rather than adsorbing the complex altogether. For successful removal of bilirubin, the AC should be capable of competing with at least the weak-binding sites on albumin for unconjugated bilirubin. Specifically, electrostatic and hydrophobic interaction and hydrogen bonds can be formed between oxygen-containing groups (ie, on the AC) and bilirubin molecules. Thanks to the AC’s high surface area resulting from the macropores, adsorption efficiency was enhanced. The selective adsorption of bilirubin in mixed solutions of bilirubin and albumin is based on a difference in the physical sizes of those molecules. Therefore, bilirubin molecules of about 2 nm were able to get into the AC through the macropores and immobilized on their inner surfaces, leaving albumin behind, as albumin molecules were much larger than the pore size.46,47 The binding of bilirubin molecules to the inner surfaces of the AC was stronger than that to their outer surfaces, due to confinement effects and a high density of bilirubin molecules. This is a vital feature of the as-synthesized AC that proves its significance for removal of bilirubin from the blood without removal of useful molecules and materials.
To compare the performance of the three adsorbents, a slight difference was observed wherein date-pit AC showed the highest adsorption of bilirubin with time (Figure 6A). However, jojoba-seed AC and microalgae AC showed almost similar trends with time (Figure 6C and E). This variation can be attributed to the deference in the surface morphology, as indicated in Figure 1. Figure 7 shows the initial concentration (C0, mg/L) of bilirubin versus the final concentration (Ceq, mg/L). Initially, three different concentrations (80, 60, and 30 μM) of bilirubin were tested, and results of all samples demonstrated reduction in bilirubin. However, date-pit AC had more adsorption capacity than jojoba-seed AC and microalgae-AC. Jojoba-seed AC showed the least bilirubin removal, and microalgae AC showed a moderate rate of adsorption.
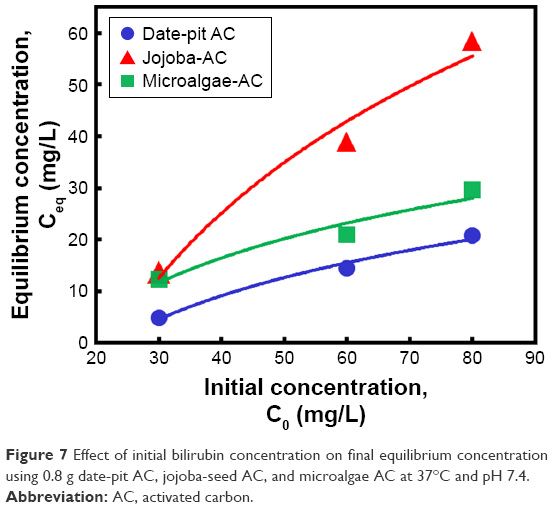 | Figure 7 Effect of initial bilirubin concentration on final equilibrium concentration using 0.8 g date-pit AC, jojoba-seed AC, and microalgae AC at 37°C and pH 7.4. |
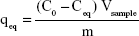
Figure 8A and B shows Langmuir and Freundlich linear isotherm plots for date-pit AC, jojoba-seed AC, and microalgae AC. Langmuir and Freundlich isotherms are commonly used isotherms to identify the most suitable adsorption mechanism. Amounts of bilirubin adsorbed on AC at equilibrium (qeq, mg/g) were calculated thus:
|
|
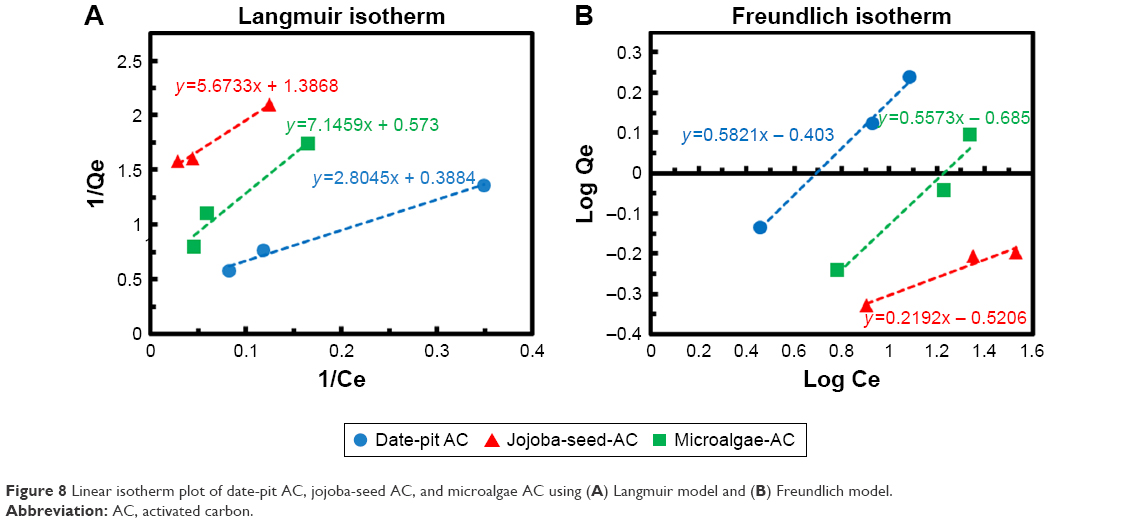 | Figure 8 Linear isotherm plot of date-pit AC, jojoba-seed AC, and microalgae AC using (A) Langmuir model and (B) Freundlich model. |
where, qeq is the amount of solute adsorbed at equilibrium, C0 the initial bilirubin concentration, Ceq the equilibrium concentration of the solute in the bulk solution after 16 hours, Vsample the volume of the sample, and “m” the mass of the adsorbent used. The Langmuir isotherm, described in Equation 2, assumes that forces of attraction among the adsorbed molecules are negligible and when a molecule occupies one site, no further adsorption takes place at that site:35,48
|
|

where qo is the maximum adsorption capacity and “b” is a constant related to free energy of adsorption. By plotting the graph 1/qe vs 1/Ceq, Langmuir constants can be determined and the values of qo and “b” determined from the intercept and slope, respectively. The results shown in Figure 8 were used to determine qeq and Ceq, which were then used to determine the isotherm parameters qo and “b” (Table 2).
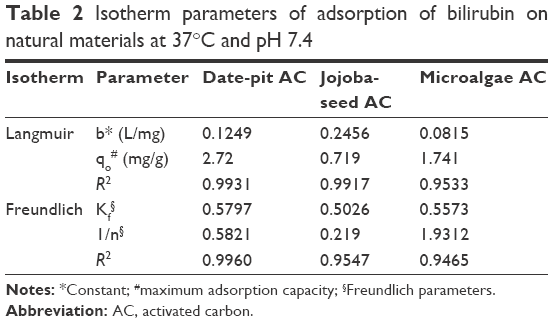 | Table 2 Isotherm parameters of adsorption of bilirubin on natural materials at 37°C and pH 7.4 |
On the other hand, the Freundlich isotherm, shown in Equation 3, describes unideal and reversible adsorption, applied to multilayer adsorption with nonuniform distribution of adsorption heat and affinity over the heterogeneous surface:48
| (3) |

where kf and “n” are Freundlich parameters, which can be determined from the slope and intercept of the straight line of log qeq vs log Ceq, respectively.48 The parameters of the two isotherms determined are presented in Table 2. The coefficient of determination (R2) which measures the level of accuracy of fit of the Langmuir and Freundlich models, was close to unity. This suggests that both models can describe the adsorption process well. However, the Langmuir model was more appropriate. The results showed that the maximum adsorption capacity for date-pit AC was 2.72 mg/g, which was higher than the adsorption capacity of jojoba-seed AC and microalgae AC, at 0.719 and 1.74 mg/g, respectively.
In vitro cytotoxicity of AC
Normal hepatocytes (THLE2) and the human hepatocellular carcinoma cell line HepG2 were used to evaluate the in vitro cytotoxic activity of the as-synthesized AC. THLE2 and HepG2 cells were incubated with 12.5–62.5 μg/mL of date-pit AC, jojoba-seed AC, or microalgae AC for 3 hours. Cell viability was determined by MTT assay. The reduction in MTT occurred mainly in the mitochondria, due to the action of succinate dehydrogenase, thus providing a measure of mitochondrial function wherein only cells that were viable were capable of metabolizing the dye efficiently and producing purple formazan, which is proportional to the amount of viablility.18,40
Figure 9A–C shows cell-viability results of THLE2 cells incubated with date-pit, jojoba-seed, and microalgae nano-AC using MTT assay. A minimal decrease in cell viability compared to the untreated control was observed and appeared proportional to incubation time. For example, THLE2 cells that were treated with date-pit nano-AC showed 75% viability in the third hour, whereas jojoba-seed and microalgae nano-AC showed 45% and 25% viability, respectively, at the same exposure time. Growth inhibition was 25% for date-pit nano-AC and 70% for both microalgae and jojoba-seed. Figure 10A–C shows that cell viability of nano-AC-treated HepG2 cells was decreased compared to control cells. For example, date-pit nano-AC demonstrated about 60% viability in the third hour, whereas jojoba-seed and microalgae nano-AC showed about 40% viability. There were slight differences between the two cell lines concerning their sensitivity to nano-AC samples. The difference between the proliferation rate of the THLE2 and HepG2 cells may be attributed to different uptake mechanisms of nano-AC by the two cell lines.40 The variation in conjunction with the different nano-AC products applied could be attributed to the difference in particle size and surface charge (Figures 3 and 4).44 Furthermore, the MTT assay appeared to be more sensitive, which can be attributed to either the assay being based mainly on the enzymatic conversion of MTT in the mitochondria and/or the reactive oxygen species generated within the mitochondria may also have damaged mitochondrial components.40
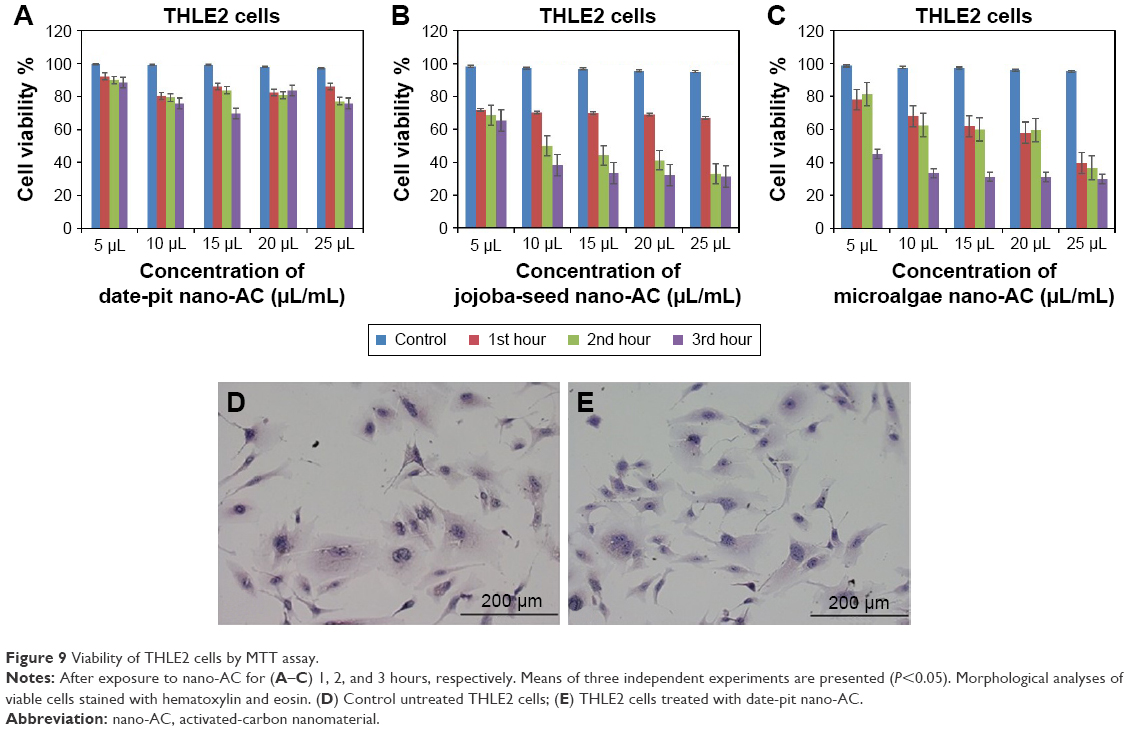 | Figure 9 Viability of THLE2 cells by MTT assay. |
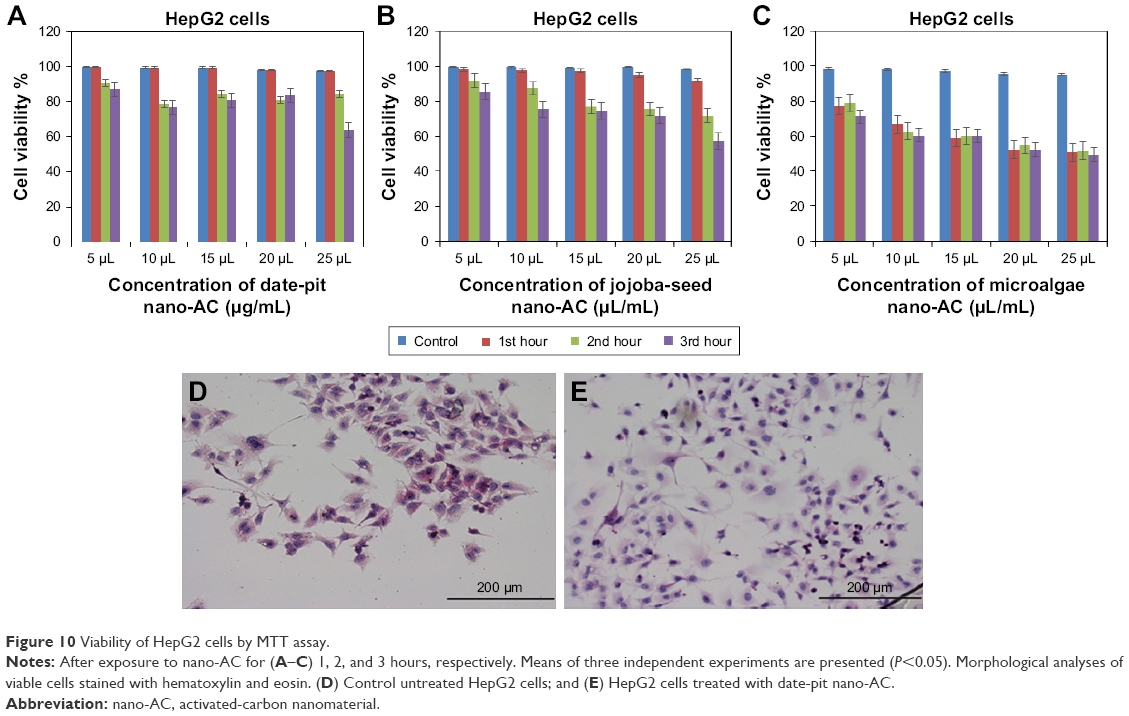 | Figure 10 Viability of HepG2 cells by MTT assay. |
Effect of AC on morphology of THLE2 and HepG2 cells
Figures 9D and E and 10D and E show THLE2 and HepG2 cells stained with hematoxylin and eosin where the nuclei appear purple, whereas the cytoplasm is pink. Cells are mostly clustered, and individual cells are polygonal in shape. The nuclei of HepG2 cells are smaller than those of THLE2 (Figure 9D and E. After 24 hours’ exposure to 62.5 μg/mL date-pit nano-AC, THLE2 cells did not reveal any apoptotic activity. HepG2 cells showed apoptotic activity, which is a characteristic stress signal of cancerous cells.49
THLE2 and HepG2 cells was stained with DAPI–Fluoroshield and phalloidin–FITC fluorescent dyes (Figure 11). DAPI is a fluorescent tag that binds strongly to AT rich regions in DNA in the cell nucleus, as it can pass through an intact nuclear membrane, and exhibits blue fluorescence. Phalloidin–FITC, on the other hand, binds to the cytoskeleton components, ie, actin filaments, which are located directly underneath the plasma membrane, and exhibits green fluorescence.38–40 Figure 11 shows fluorescence-microscopy of 2D and 3D cultured THLE2 and HepG2 cells treated with date-pit, jojoba-seed, and microalgae nano-AC. The integrity and distribution of actin cytoskeletal filaments were marginally affected by the nano-AC treatments applied.40 Morphology changes were also more evident in HepG2 cells than normal THLE2 cells.
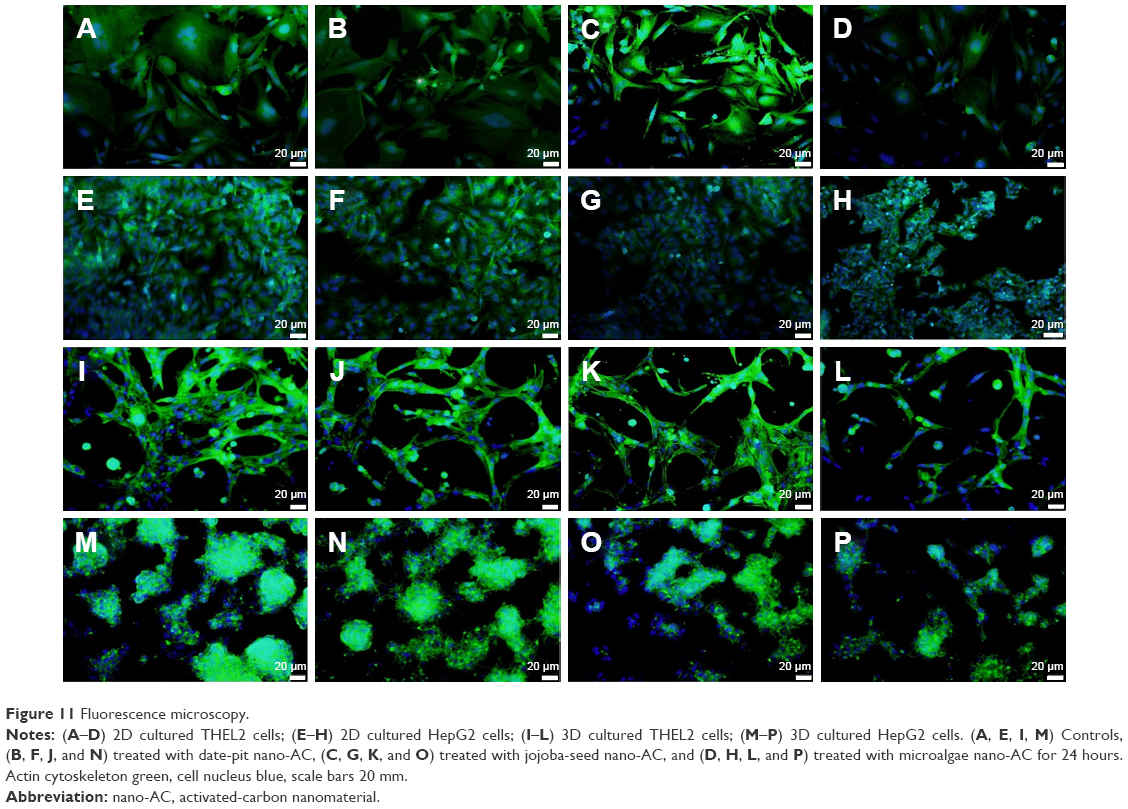 | Figure 11 Fluorescence microscopy. |
Conclusion
To develop a novel adsorbent for bilirubin detoxification, three phytomaterials were selected as precursors for the synthesis of AC: date pits, jojoba seeds, and microalgae. Structural and morphological analyses showed differences among the three newly produced AC materials. However, all developed AC materials showed porous structures with large surface area. In addition, they all displayed excellent adsorbent qualities, including high adsorption capacity for bilirubin and high selectivity for bilirubin against albumin. These unique properties clearly showed the advantageous capability of AC in filtering out bilirubin from the blood without losing any useful blood components. The Langmuir and Freundlich models fitted the equilibrium experimental data, and the Langmuir isotherm-equilibrium model showed a better fit. The results revealed that date-pit AC had more adsorption capacity than jojoba-seed AC and microalgae AC. Moreover, in vitro MTT assays on normal hepatocytes (THLE2) and cancerous hepatocytes (HepG2) demonstrated that nano-AC has a more potent effect on the viability of HepG2 cells compared to its normal counterpart.
Acknowledgments
The authors wish to acknowledge the support received from the office of Deputy of Vice Chancellor for Research and Graduate Studies at United Arab Emirates University under internal university fund code 31N154. This study was partially supported by United Arab Emirates University (UAEU) Program for Advanced Research fund 31S319 for AA and UAEU startup fund code 31N207 for MAA. We are also grateful to Dr Tahir Rizvi, Professor, College of Medicine and Health Sciences, UAEU, who provided the resources for the work.
Disclosure
The authors report no conflicts of interest in this work.
References
Bernal W, Wendon J. Critical care medicine: acute liver failure. N Engl J Med. 2013;369:2525–2534. | ||
Kjaergard LL, Liu J, Als-Nelson B, Gluud C. Artificial and bioartificial support systems for acute and acute-on-chronic liver failure: a systematic review. JAMA. 2003;289:217–222. | ||
Jalan R, Sen S, Williams R. Prospects for extracorporeal liver support. Gut. 2004;53:890–898. | ||
Rozga J, Umehara Y, Trofimenko A, Sadahiro T, Demetriou AA. A novel plasma filtration therapy for hepatic failure: preclinical studies. Ther Apher Dial. 2006;10:138–144. | ||
Stange J, Mitzner SR, Risler T, et al. Molecular adsorbent recycling system (MARS): clinical results of a new membrane-based blood purification system for bioartificial liver support. Artif Organs. 1999;23:319–340. | ||
Müller BR. Effect of particle size and surface area on the adsorption of albumin-bonded bilirubin on activated carbon. Carbon. 2010;48:3607–3615. | ||
Ding W, Zou L, Sun S, Li W, Gao D. A new method to increase the adsorption of protein-bound toxins in artificial liver support systems. Artif Organs. 2014;38:954–962. | ||
Chen J, Han W, Chen J, et al. High performance of a unique mesoporous polystyrene-based adsorbent for blood purification. Regen Biomater. 2017;4:31–37. | ||
Teotia RS, Kalita D, Singh AT, Verma SK, Kadam SS, Bellare JR. Bifunctional polysulfone-chitosan composite hollow fiber membrane for bioartificial liver. ACS Biomater Sci Eng. 2015;1:372-381. | ||
Aron J, Agarwal B, Davenport A. Extracorporeal support for patients with acute and acute on chronic liver failure. Expert Rev Med Devices. 2016;13:367–380. | ||
Jain E, Damania A, Shakya AK, Kumar A, Sarin SK, Kumar A. Fabrication of macroporous cryogels as potential hepatocyte carriers for bioartificial liver support. Colloids Surf B Biointerfaces. 2015;136:761–771. | ||
Arumugaswami V, Svendsen C, inventors; Cedars-Sinai Medical Center, assignee. Induced pluripotent stem cell-derived hepatocyte based bioartificial liver device. United States patent US20160256672A1. 2015 Feb 10. | ||
Damania A, Kumar A, Sarin SK, Kumar A. Optimized performance of the integrated hepatic cell-loaded cryogel-based bioreactor with intermittent perfusion of acute liver failure plasma. J Biomed Mater Res B Appl Biomater. 2018;106:259–269. | ||
Hamid R, Rotshteyn Y, Rabadi L, Parikh R, Bullock P. Comparison of Alamar blue and MTT assays for high through-put screening. Toxicol In Vitro. 2004;18:703–710. | ||
Weyermann J, Lochmann D, Zimmer A. A practical note on the use of cytotoxicity assays. Int J Pharm. 2005;288:369–376. | ||
Zakrzewska KE, Samluk A, Wierzbicki M, et al. Analysis of the cytotoxicity of carbon-based nanoparticles, diamond and graphite, in human glioblastoma and hepatoma cell lines. PLoS One. 2015;10:e0122579. | ||
Slater TF, Sawyer B, Straeuli U. Studies on succinate-tetrazolium reductase systems III, points of coupling of four different tetrazolium salts. Biochim Biophys Acta. 1963;77:383–393. | ||
Mahmoudi K, Hamdi N, Srasra E. Preparation and characterization of activated carbon from date pits by chemical activation with zinc chloride for methyl orange adsorption. J Mater Environ Sci. 2014;5:1758–1769. | ||
Tawalbeh M, Allawzi M, Kandah MI. Production of activated carbon from jojoba seed residue by chemical activation residue using a static bed reactor. J Appl Sci. 2005;5:482–487. | ||
Chen Y, Wu Y, Hua D, et al. Thermochemical conversion of low-lipid microalgae for the production of liquid fuels: challenges and opportunities. RSC Adv. 2015;5:18673–18701. | ||
Almutary M, Sanderson BJ. The MTT and crystal violet assays: potential confounders in nanoparticle toxicity testing. Int J Toxicol. 2016;35:454–462. | ||
Edmondson R, Broglie JJ, Adcock AF, Yang L. Three-dimensional cell culture systems and their applications in drug discovery and cell-based biosensors. Assay Drug Dev Technol. 2014;12:207–218. | ||
Guo L, Dial S, Shi L, et al. Similarities and differences in the expression of drug-metabolizing enzymes between human hepatic cell lines and primary human hepatocytes. Drug Metab Dispos. 2011;39:528–538. | ||
Luckert C, Schulz C, Lehmann N, et al. Comparative analysis of 3D culture methods on human HepG2 cells. Arch Toxicol. 2017;91:393–406. | ||
Artym VV, Matsumoto K. Imaging cells in three-dimensional collagen matrix. Curr Protoc Cell Biol. 2010;48:1–20. | ||
Thurnherr T, Brandenberger C, Fischer K, et al. A comparison of acute and long-term effects of industrial multiwalled carbon nanotubes on human lung and immune cells in vitro. Toxicol Lett. 2011;200:176–186. | ||
Damania A, Hassan M, Shirakigawa N, et al. Alleviating liver failure conditions using an integrated hybrid cryogel based cellular bioreactor as a bioartificial liver support. Sci Rep. 2017;7:40323. | ||
Ortega I, McKean R, Ryan AJ, MacNeil S, Claeyssens F. Characterization and evaluation of the impact of microfabricated pockets on the performance of limbal epithelial stem cells in biodegradable PLGA membranes for corneal regeneration. Biomater Sci. 2014;2:723–734. | ||
Nicolas CT, Hickey RD, Chen HS, et al. Liver regenerative medicine: from hepatocyte transplantation to bioartificial livers and bioengineered grafts. Stem Cells. 2017;35:42–50. | ||
Hilal-Alnaqbi A, Gaylor JD. Fibre-in-fibre bioartificial liver device: Initial in vitro testing. Int J Biomedi Eng Technol. 2011;6:323–336. | ||
Hilal-Alnaqbi A, Mourad AH, Basem Y, Gaylor JD. Experimental evaluation and theoretical modeling of oxygen transfer rate for the newly developed hollow fiber bioreactor with three compartments. Biomed Mater Eng. 2013;23:387–403. | ||
Matos J, Nahas C, Rojas L, Rosales M. Synthesis and characterization of activated carbon from sawdust of algarroba wood – 1: physical activation and pyrolysis. J Hazard Mater. 2011;196:360–369. | ||
Mourad AH, Akkad R, Soliman AA, Madkour TM. Characterization of thermally treated and untreated polyethylene-polypropylene blends using DSC, TGA and IR techniques. Plast Rubber Compos: Macromol Eng. 2009;38:265–278. | ||
Babaghayou MI, Mourad AH, Lorenzo V, et al. Photodegradation characterization and heterogeneity evaluation of the exposed and unexposed faces of stabilized and unstabilized LDPE films. Mater Des. 2016;111:279–290. | ||
Annesini MC, Piemonte V, Turchetti L. Removal of albumin-bound toxins removal from albumin-containing solutions: tryptophan fixed-bed adsorption on activated carbon. Chem Eng Res Des. 2010;88:1018–1023. | ||
van Wenum M, Adam AA, Hakvoort TB, et al. Selecting cells for bioartificial liver devices and the importance of a 3D culture environment: a functional comparison between the HepaRG and C3A cell lines. Int J Biol Sci. 2016;12:964–978. | ||
Atale N, Gupta S, Yadav UC, Rani V. Cell-death assessment by fluorescent and nonfluorescent cytosolic and nuclear staining techniques. J Microsc. 2014;255:7–19. | ||
Yan H, Endo Y, Shen Y, et al. Ado-trastuzumab emtansine targets hepatocytes via human epidermal growth factor receptor 2 to induce hepatotoxicity. Mol Cancer Ther. 2015;15:480–490. | ||
Frickmann H, Schröpfer E, Dobler G. Actin assessment in addition to specific immuno-fluorescence staining to demonstrate rickettsial growth in cell culture. Eur J Microbiol Immunol (Bp). 2013;3:198–203. | ||
Peñaloza JP, Márquez-Miranda V, Cabaña-Brunod M, et al. Intracellular trafficking and cellular uptake mechanism of PHBV nanoparticles for targeted delivery in epithelial cell lines. J Nanobiotechnol. 2017;15:1. | ||
Arena N, Lee J, Clift R. Life cycle assessment of activated carbon production from coconut shells. J Clean Prod. 2016;125:68–77. | ||
Zhou L, Yu Q, Cui Y, et al. Adsorption properties of activated carbon from reed with a high adsorption capacity. Ecol Eng. 2017;102:443–450. | ||
Rodríguez-Reinoso F, Molina-Sabio M. Activated carbons from lignocellulosic materials by chemical and/or physical activation: an overview. Carbon N Y. 1992;30:1111–1118. | ||
Chen Y, Yang Y, Xu B, et al. Mesoporous carbon nanomaterials induced pulmonary surfactant inhibition, cytotoxicity, inflammation and lung fibrosis. J Environ Sci (China). 2017;62:100–114. | ||
Mandal S, Sahu MK, Patel RK. Adsorption studies of arsenic(III) removal from water by zirconium polyacrylamide hybrid material (ZrPACM-43). Water Resour Ind. 2013;4:51–67. | ||
Harm S, Falkenhagen D, Hartmann J. Pore size: a key property for selective toxin removal in blood purification. Int J Artif Organs. 2014;37:651–678. | ||
Annesini MC, Piemonte V, Turchetti L. Adsorption of albumin-bound toxins on anionic resin: an equilibrium study. Asia Pac J Chem Eng. 2012;7:510–516. | ||
Tan IA, Ahmad AL, Hameed BH. Adsorption of basic dye on high surface-area activated carbon prepared from coconut husk: equilibrium, kinetic and thermodynamic studies. J Hazard Mater. 2008;154:337–346. | ||
Archana M, Bastian, Yogesh TL, Kumaraswamy KL. Various methods available for detection of apoptotic cells: a review. Indian J Cancer. 2013;50:274–283. |
 © 2018 The Author(s). This work is published and licensed by Dove Medical Press Limited. The
full terms of this license are available at https://www.dovepress.com/terms
and incorporate the Creative Commons Attribution
- Non Commercial (unported, 3.0) License.
By accessing the work you hereby accept the Terms. Non-commercial uses of the work are permitted
without any further permission from Dove Medical Press Limited, provided the work is properly
attributed. For permission for commercial use of this work, please see paragraphs 4.2 and 5 of our Terms.
© 2018 The Author(s). This work is published and licensed by Dove Medical Press Limited. The
full terms of this license are available at https://www.dovepress.com/terms
and incorporate the Creative Commons Attribution
- Non Commercial (unported, 3.0) License.
By accessing the work you hereby accept the Terms. Non-commercial uses of the work are permitted
without any further permission from Dove Medical Press Limited, provided the work is properly
attributed. For permission for commercial use of this work, please see paragraphs 4.2 and 5 of our Terms.