Back to Journals » Risk Management and Healthcare Policy » Volume 13
Association Between Parental Socioeconomic Status and Skeletal Muscle Mass in Chinese College Students: Fitness Improvement Tactics in Youths (FITYou) Project
Authors Tian Y ![]() , Zhong F, Li C, Wu C
, Zhong F, Li C, Wu C ![]() , Zou J, Wang Q, Song Z, Cui Y, Sun X, Huang C
, Zou J, Wang Q, Song Z, Cui Y, Sun X, Huang C ![]()
Received 9 June 2020
Accepted for publication 26 September 2020
Published 4 November 2020 Volume 2020:13 Pages 2457—2467
DOI https://doi.org/10.2147/RMHP.S266891
Checked for plagiarism Yes
Review by Single anonymous peer review
Peer reviewer comments 2
Editor who approved publication: Professor Marco Carotenuto
Ying Tian,1 Fei Zhong,2 Cheng Li,3 Chunchun Wu,2 Jiaqi Zou,1 Qiang Wang,1 Zhengxue Song,1 Yufei Cui,4,5 Xiaomin Sun,6 Cong Huang2,5
1College of Sports Science, Shenyang Normal University, Shenyang, People’s Republic of China; 2Department of Sports and Exercise Science, College of Education, Zhejiang University, Hangzhou, People’s Republic of China; 3Department of Grain Science and Industry, Kansas State University, Manhattan, KS, USA; 4Institute of Exercise Epidemiology and Department of Physical Education, Huaiyin Institute of Technology, Huai’an, People’s Republic of China; 5Department of Medicine and Science in Sports and Exercise, Tohoku University Graduate School of Medicine, Sendai, Japan; 6Department of Nutrition and Food Safety, School of Public Health, Xi’an Jiaotong University Health Science Center, Xi’an, People’s Republic of China
Correspondence: Cong Huang
Department of Sports and Exercise Science, College of Education, Zhejiang University, 866 Yuhangtang Road, Hangzhou 310058, People’s Republic of China
Email [email protected]
Purpose: The purpose of this study was to determine the association between parental socioeconomic status (SES) and skeletal muscle mass in Chinese college students.
Methods: A cross-sectional study including 2204 college freshmen was conducted in Shenyang, China. Data regarding body composition, health examinations, and a self-reported questionnaire were available from all the participants. Skeletal muscle mass assessment was completed by a bioelectrical impedance analyzer. Information on parental SES (educational levels, annual income, and occupational status) was collected via questionnaires. Covariance analysis was used to adjust for the confounding effects of sex, age, ethnicity, smoking status, alcohol use, and sleep duration.
Results: Multivariate analysis showed that college freshmen with higher parental SES levels generally had higher skeletal muscle mass after adjustment for confounding factors (mean [95% confidence interval]: low, 42.4 [42.0, 42.8]; middle, 42.9 [42.6, 43.3]; high, 43.7 [43.4, 44.1], p for trend < 0.001). Similar results were observed for paternal and maternal SES (p for trend < 0.001, respectively), whereas association between paternal SES and youth muscle mass became non-significant after adjusting for maternal SES (p for trend = 0.077). Results also showed positive linear trends for skeletal muscle mass and paternal or maternal educational levels and annual income (p for trend < 0.001, respectively), but not for occupational status.
Conclusion: This study found a positive association between parental SES and skeletal muscle mass in Chinese college students. Compared to the normalization of height or weight, body mass index-adjusted skeletal muscle mass is more likely to be associated with SES.
Keywords: educational status, annual income, occupational status, muscular fitness, youth
Introduction
The skeletal muscle is an important component of the human body and is key in energy, protein, and glucose metabolism.1 Skeletal muscle mass peaks in the 20s, remain high in the 30s to 40s, and declines after 45 years old.2,3 Previous study showed that a negative association has been observed between muscle mass and cardiometabolic risk in adolescents.4 Additionally, data indicated that adults with higher skeletal muscle mass have a significantly lower rates of cardiovascular disease (CVD) after 10 years.5 It is suggested that maintaining muscle mass during the youth stage is crucial for conserving physical capacity and preventing metabolic diseases in middle and old age.
Previous studies have reported the relationships between skeletal muscle mass and behavioral habits, such as diet and physical exercise, during adolescence.6–8 Also, skeletal muscle may be affected by fat mass and obesity associated gene in adolescents.9 However, limited studies have focused on the association between socioeconomic status (SES) and skeletal muscle mass. SES is a sign of social position, which is usually estimated according to the educational level, income, and occupational status.10 Evidence indicates that children and youths in families with lower levels of SES exhibit significantly higher mortality risk compared with children and youths living in higher SES families.11 Also, adolescents with a low SES have inferior physical fitness than those with a high SES.12 A recent study reported that lower muscle mass among prepubertal children is associated with lower parental SES, based on the parental educational level and standard of living.13 Poor living conditions during adolescence, which result in low muscle mass, could contribute to the vulnerability to diabetes.14 Despite these findings, further evidence regarding the association between parental SES and muscle mass in youths is needed.
Based on previous studies, there is uncertainty regarding the relationship between SES and muscle mass, and the assessment of SES must be more comprehensive and specific. Therefore, the purpose of this study was to investigate whether skeletal muscle mass in youths is related to their parents’ SES, which is evaluated by the levels of paternal and maternal education, income, and occupation.
Materials and Methods
Study Participants
Fitness Improvement Tactics in Youths (FITYou) project was carried out in Shenyang, China. Its objective was to clarify the influence of the social economy, lifestyle, physiological status, metabolic regulation on the health-related quality of life, and health status of college students during college. Further details regarding the project content can be found in previously published works.15,16
The baseline data of the FITYou project were used in the current study, which were collected at the same time segments (7:30–17:00) over several days (September 5–20, 2017). Of the 4717 Chinese college freshmen that were invited to participate in this survey, 4323 students agreed by submitting written informed consent (response rate = 91.6%). Additional written informed consent from parents or legal guardians was obtained for participants under 18 years of age. Of the 4323 students, 218, 1300, and 534 students had missing data on physical examination, SES, and skeletal muscle mass, respectively. Among the remaining 2271 students, age (n=27), body mass index (BMI) (n=6), smoking status (n=4), drinking status (n=17), and sleep duration (n=13) had different degrees of data completeness. As a result, a total of 2204 college freshmen were included in the final analysis (Figure 1). The study was carried out in strict accordance with the Helsinki Declaration,17 to protect the rights of participants and ensure their safety. The research plan was approved by the Ethics Committee of the College of Education, Zhejiang University.
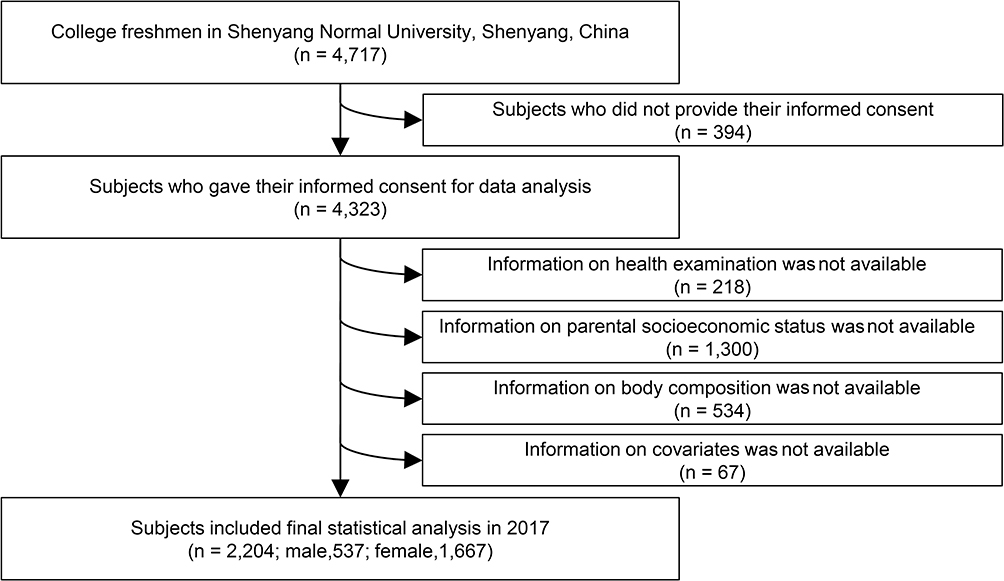 |
Figure 1 Participants’ selection flowchart. |
Assessment of SES
To measure the SES, data on the self-reported educational status, annual income, and primary occupation status were utilized. The paternal and maternal SES values were assessed separately. The paternal and maternal educational levels were determined based on the question: “What is your paternal and maternal educational status?” The responses were categorized into four groups: primary school, middle school, high school, and ≥ college. Parental annual income was assessed by the question: “What is your paternal or maternal average annual income?” with the possible answers categorized into four groups: <15,000, 15,000–29,999, 30,000–49,999, and ≥50,000 Chinese Yuan (CNY). Similarly, parental occupational status was assessed by the question: “What is your paternal and maternal current occupational status?” The answers were divided into four groups: non-employed, self-employed, blue-collar workers, and white-collar workers. The four categories of each SES components were assigned 1–4 points. The total score for the six questions (three for fathers and three for mothers) was calculated and reported as the family’s SES level. The score ranged from 6 to 24, with higher scores indicating higher SES.
Assessment of Skeletal Muscle Mass
Due to the high accuracy of bioelectrical impedance,18 a bioimpedance instrument (TANITA BC-420 MA, Tokyo, Japan) was used to measure body weight and skeletal muscle mass by eight-point contact electrodes in a multi-loop method. Participants stood barefoot on the analyzer platform and maintained the upper body upright with their muscles being as relaxed as possible. The toes and heels were required to maintain contact with the four electrodes. The participants were asked to hold the two handles with both hands while the thumbs-maintained contact with the tactile electrodes. While facing directly forward the arms were maintained straight at a 30° abduction in the frontal plane. The measurements were carried out by trained staff and the measurements’ phase was completed within 30 seconds. Since the skeletal muscle mass is significantly affected by body size, the value of the skeletal muscle mass was standardized by the body height (skeletal muscle mass [kg]/height [m2]), body weight (skeletal muscle mass [kg]/weight [kg]), and BMI (skeletal muscle mass [kg]/BMI [kg/m2]), respectively.19 BMI was calculated by dividing the weight in kilograms by height in square meters (kg/m2).
Relevant Covariates
Data on socio-demographic variables were collected by self-reported questionnaires. Age was calculated based on the date of birth while ethnicity was summarized into Han or other ethnic groups, according to the answers provided for the multiple-choice question. Lifestyle-related information was obtained directly from the self-administered questionnaire, including smoking status (current, former, or never smoking), drinking status (current drinkers, non-drinkers), and daily sleep duration (<6, 6–7, 7–8, ≥8 hours).
Statistical Analysis
To describe the participants’ characteristics according to the SES levels, the analysis of variance or χ2 test was used for continuous and categorical variables, respectively. Continuous variables were presented as means (standard deviations, SD), while categorized variables were presented as numbers and percentages.
Analysis of the covariance was used to obtain the linear trend between SES scores and skeletal muscle mass in college freshmen. Data were shown as means and 95% confidence intervals (CI). The covariance analysis included three statistical models adjusted for covariates while considering both total and paternal/maternal-specific relationships. Model 1 was adjusted for age, gender, and ethnicity. In Model 2, lifestyle-related variables including smoking status, drinking status, and sleep duration were added. Based on the existing covariates in Model 2, paternal and maternal SES scores were added to Model 3 as appropriate. Moreover, associations of each component with SES levels and skeletal muscle mass were also examined. All the tests were two-tailed, and p-value < 0.05 was considered as statistically significant for group differences. IBM SPSS Statistics for MAC, version 22.0 (IBM Corp., Armonk, N.Y., USA) was used for the statistical analysis of the data in this study.
Results
Participants’ Characteristics
The participants’ characteristics in the different categories of the total parental SES scores are summarized in Table 1. A total of 2204 college students aged 15–24 years were included in this study; of these, 537 (24.4%) were males and 1667 (75.6%) were females. Mean (SD) skeletal muscle mass was 54.9 (7.8) kg in the male students and 39.2 (4.3) kg in the female students. A large number of students were from Chinese Han ethnicity.
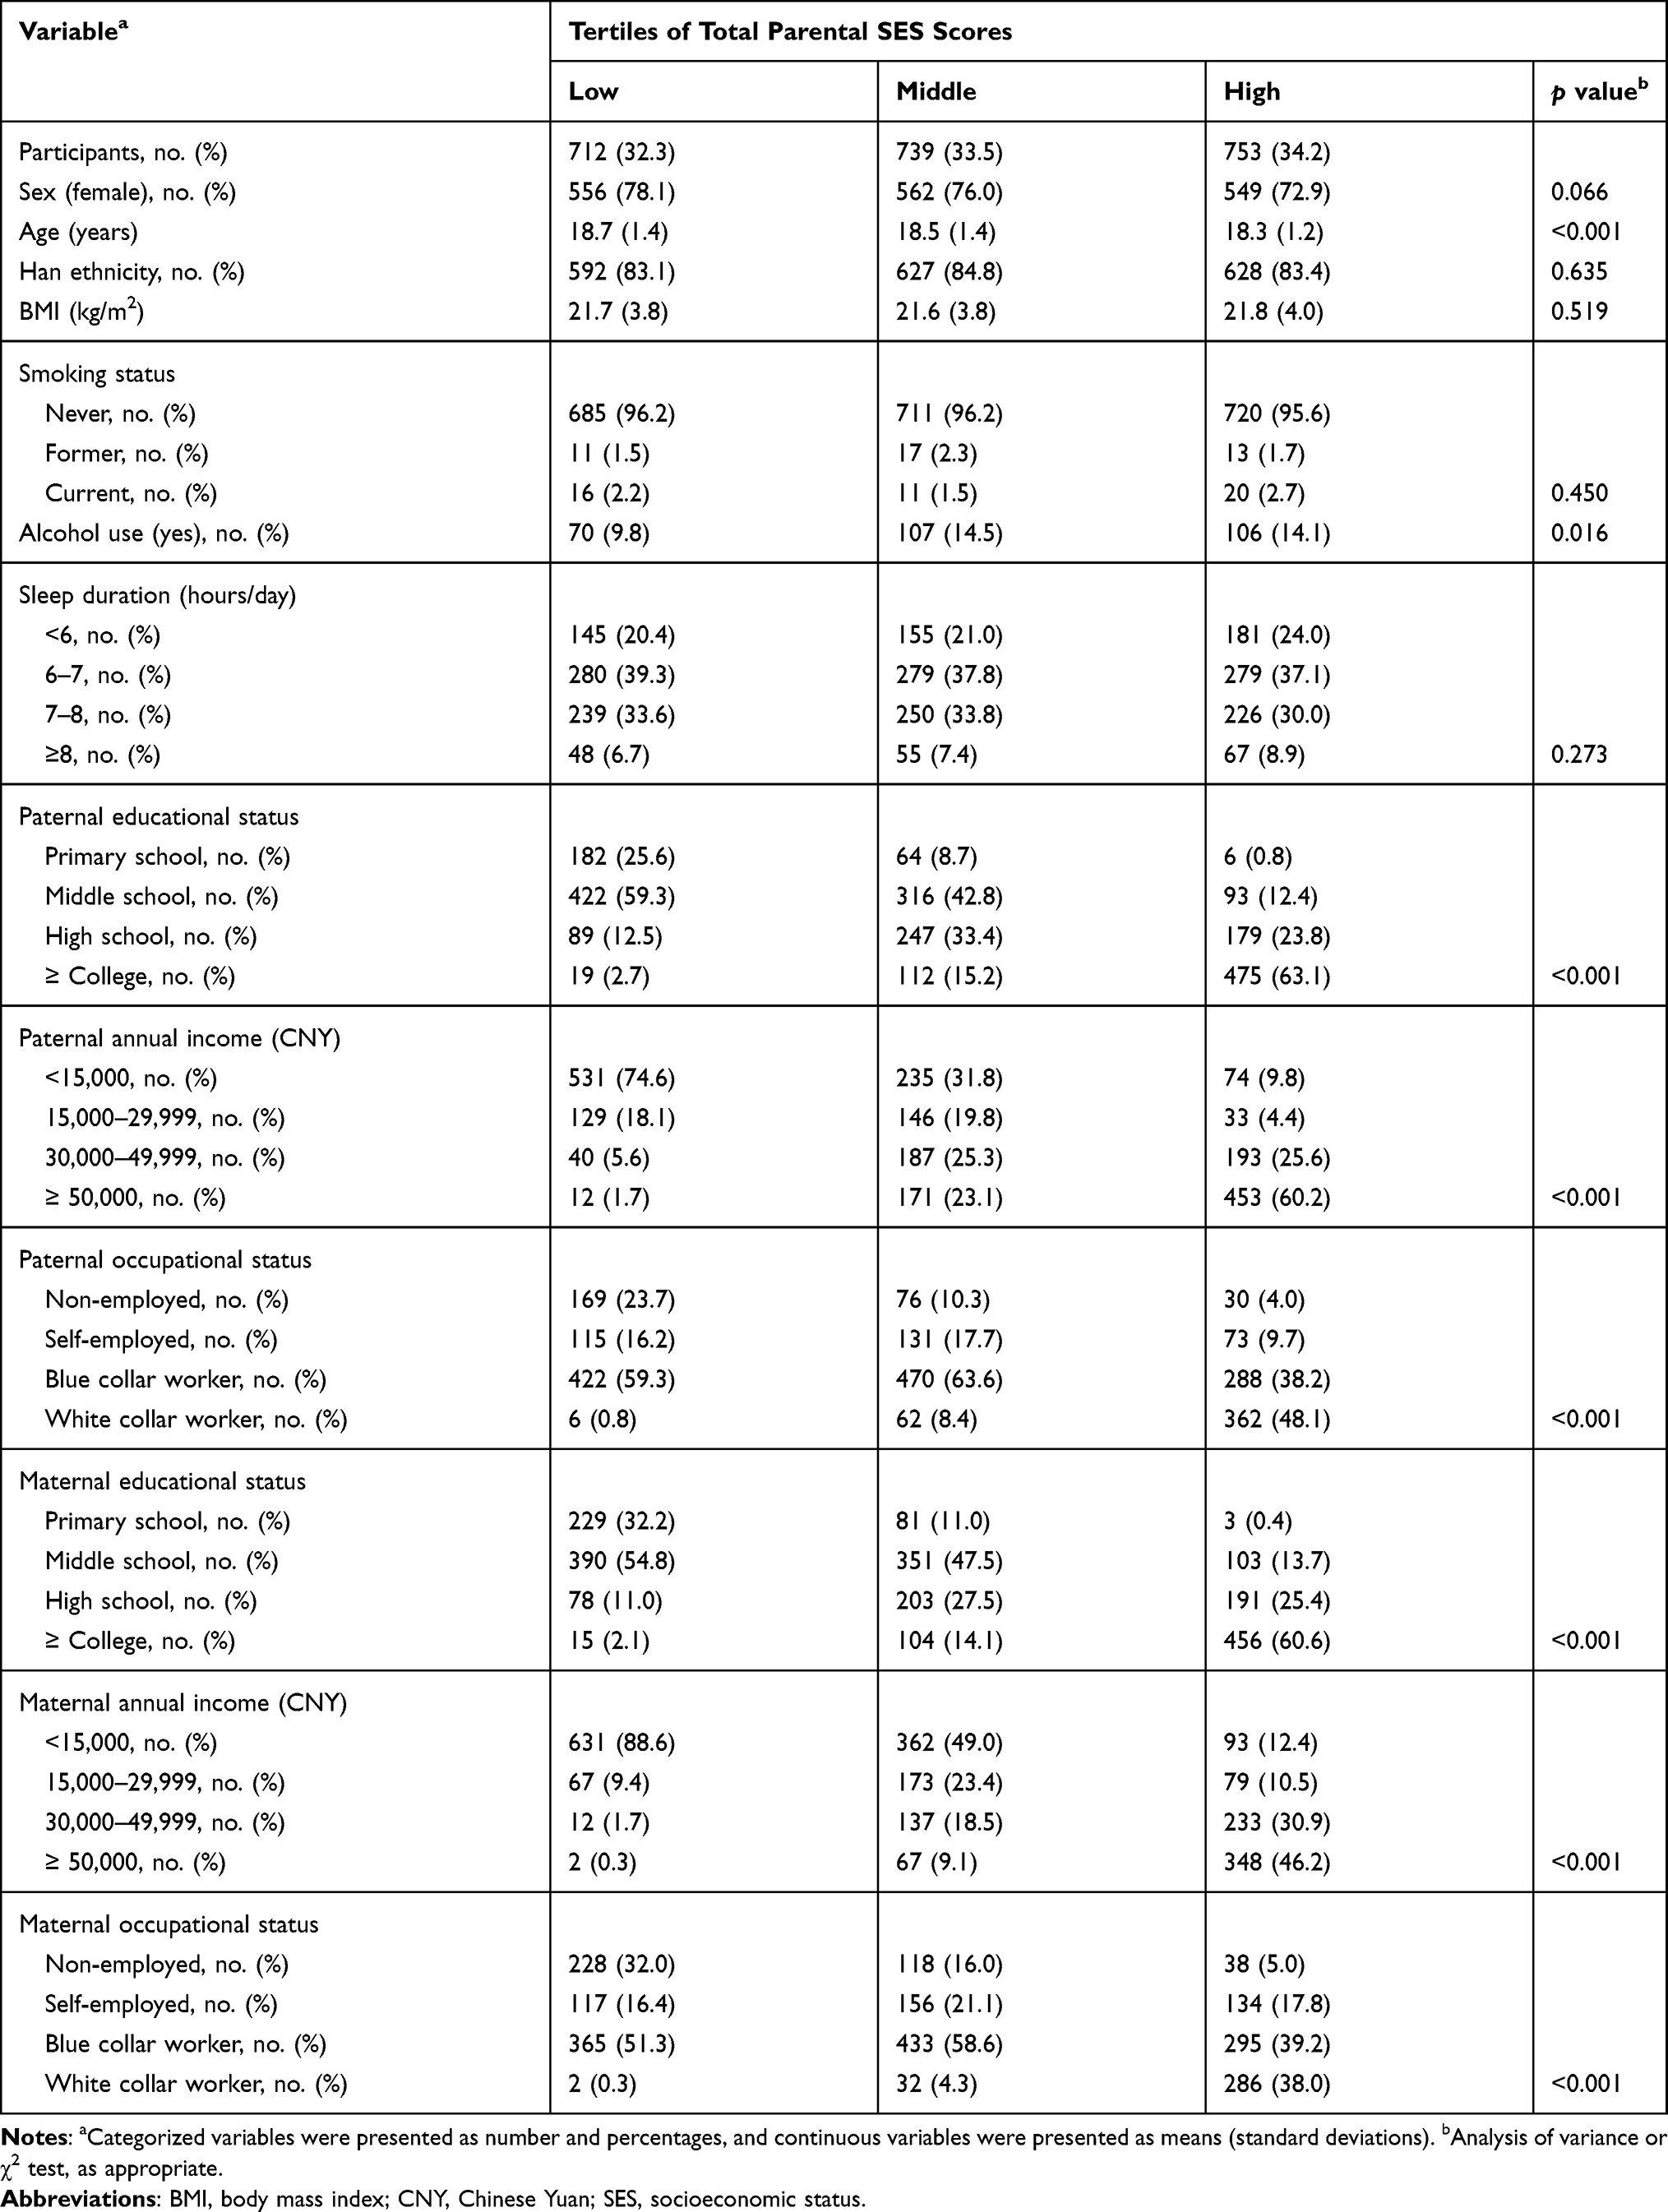 |
Table 1 Participants’ Characteristics According to Parental SES Scores in Chinese College Freshmen (n=2204) |
Younger students tended to have higher parental SES levels (p < 0.001). There was no significant difference in BMI, smoking status, and sleep duration between the SES tertiles, while the youths with middle and high parental SES were related to higher proportions of alcoholic beverage drinking (p = 0.016). Both paternal and maternal educational status (p < 0.001), annual income (p < 0.001), and occupational status (p < 0.001) were significantly and positively associated with total parental SES levels.
Parental SES and Skeletal Muscle Mass in College Freshmen
Table 2 indicates the association between tertiles of total parental SES levels and skeletal muscle mass in the youths, before and after adjusting for the potential covariates (Model 2). In the univariate model, lower total parental SES scores were associated with lower skeletal muscle mass (p for trend < 0.001), and the trend was similar and significant subsequent to the adjustment for all potential covariates (p for trend < 0.001). Regarding the association between paternal and maternal SES scores and skeletal muscle mass separately, shown in Table 3, both the covariate non-adjusted model and the covariate-adjusted model had the same approximate tendency regarding the association of the total paternal SES scores with the skeletal muscle mass. In contrast, an additional adjustment for maternal SES levels (as appropriate) was added to Model 3 for the analysis of the association between paternal SES and skeletal muscle mass. This resulted in the previously significant linear trend becoming non-significant (p for trend = 0.077). Moreover, higher paternal or maternal SES was significantly associated with youth skeletal muscle mass adjusted by BMI, but not body height or weight.
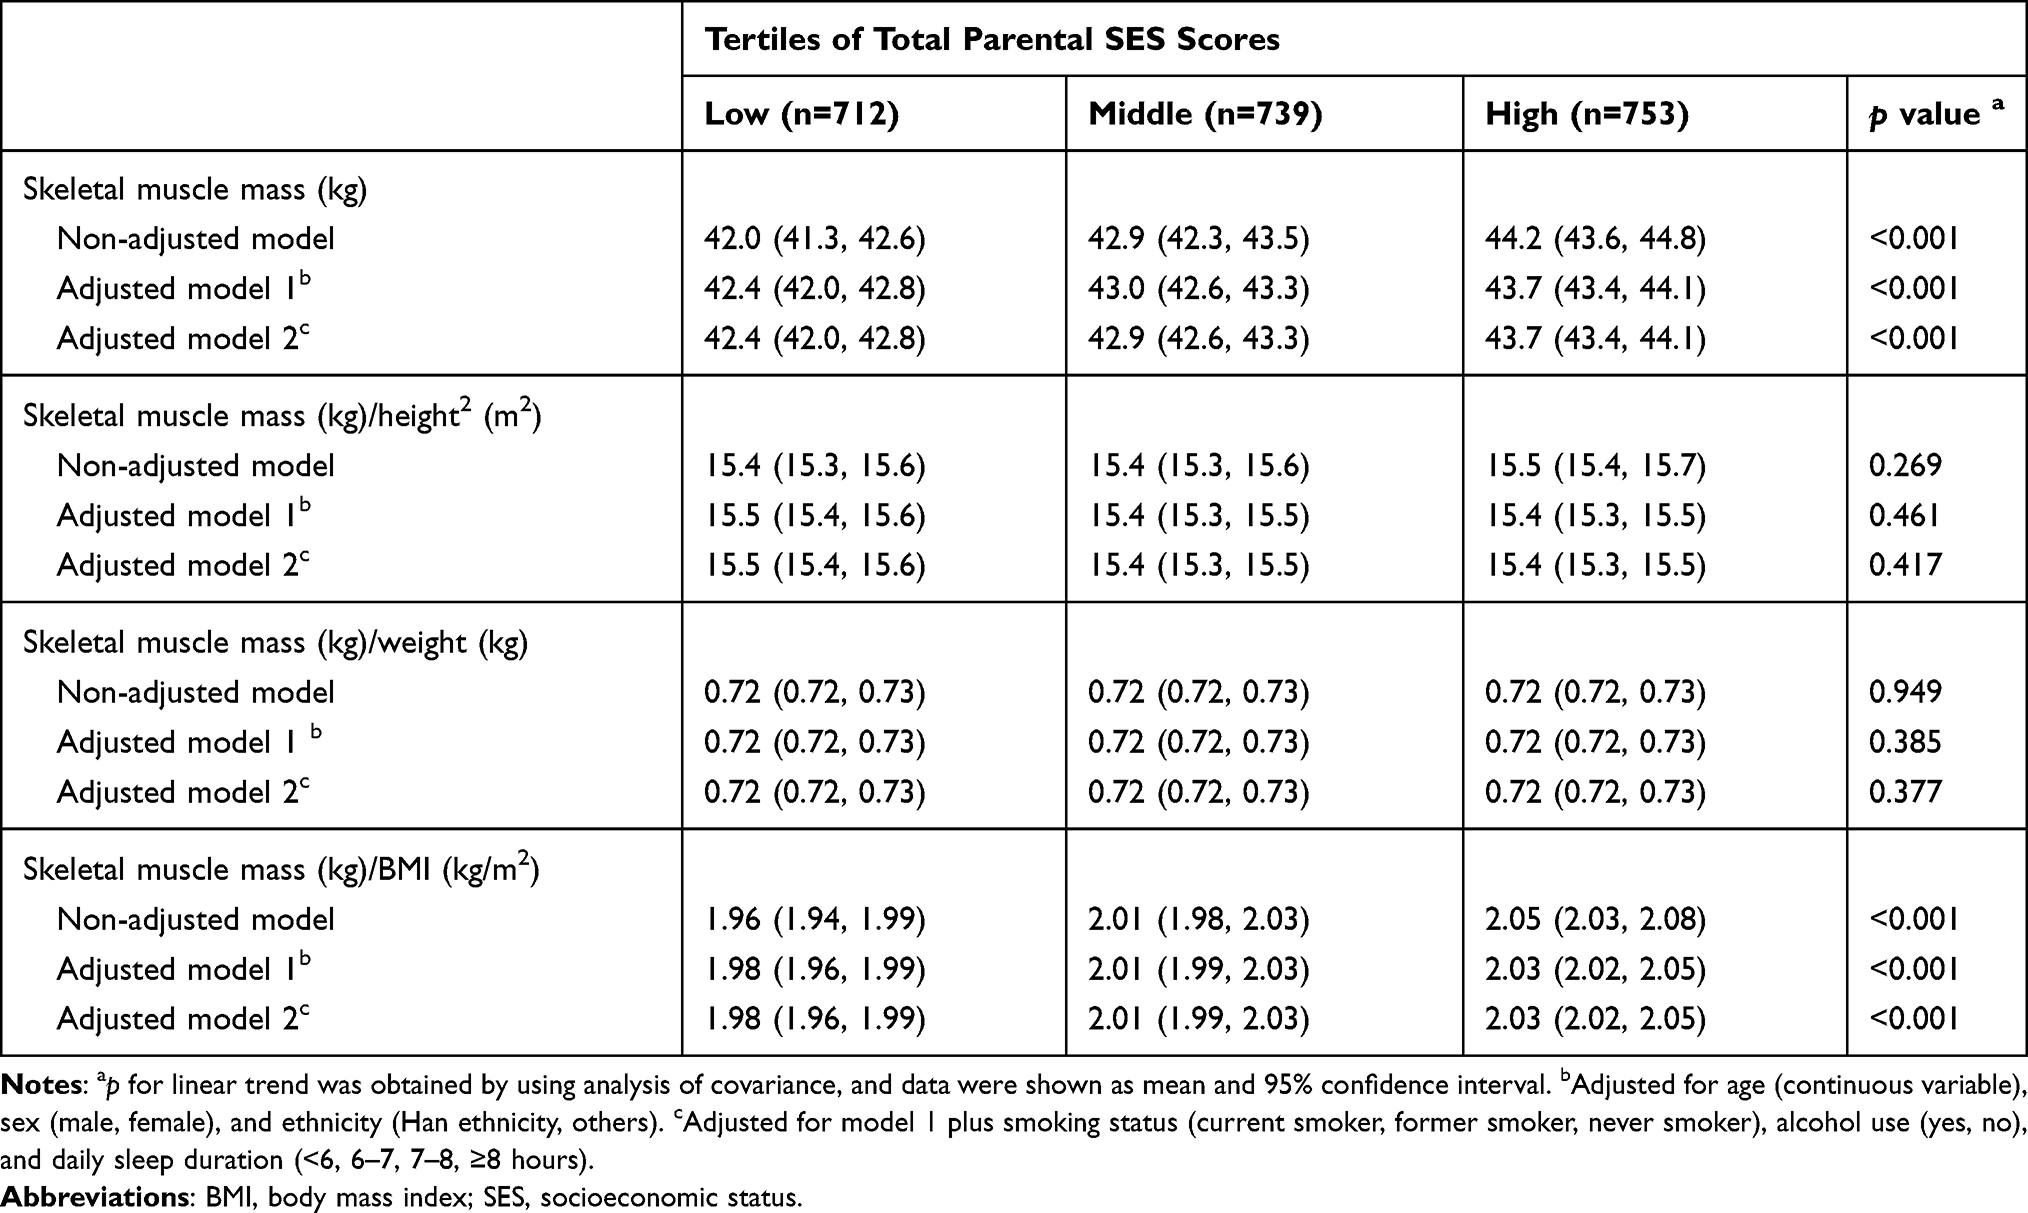 |
Table 2 Association Between Total Parental SES Scores and Skeletal Muscle Mass in Chinese College Freshmen (n=2204) |
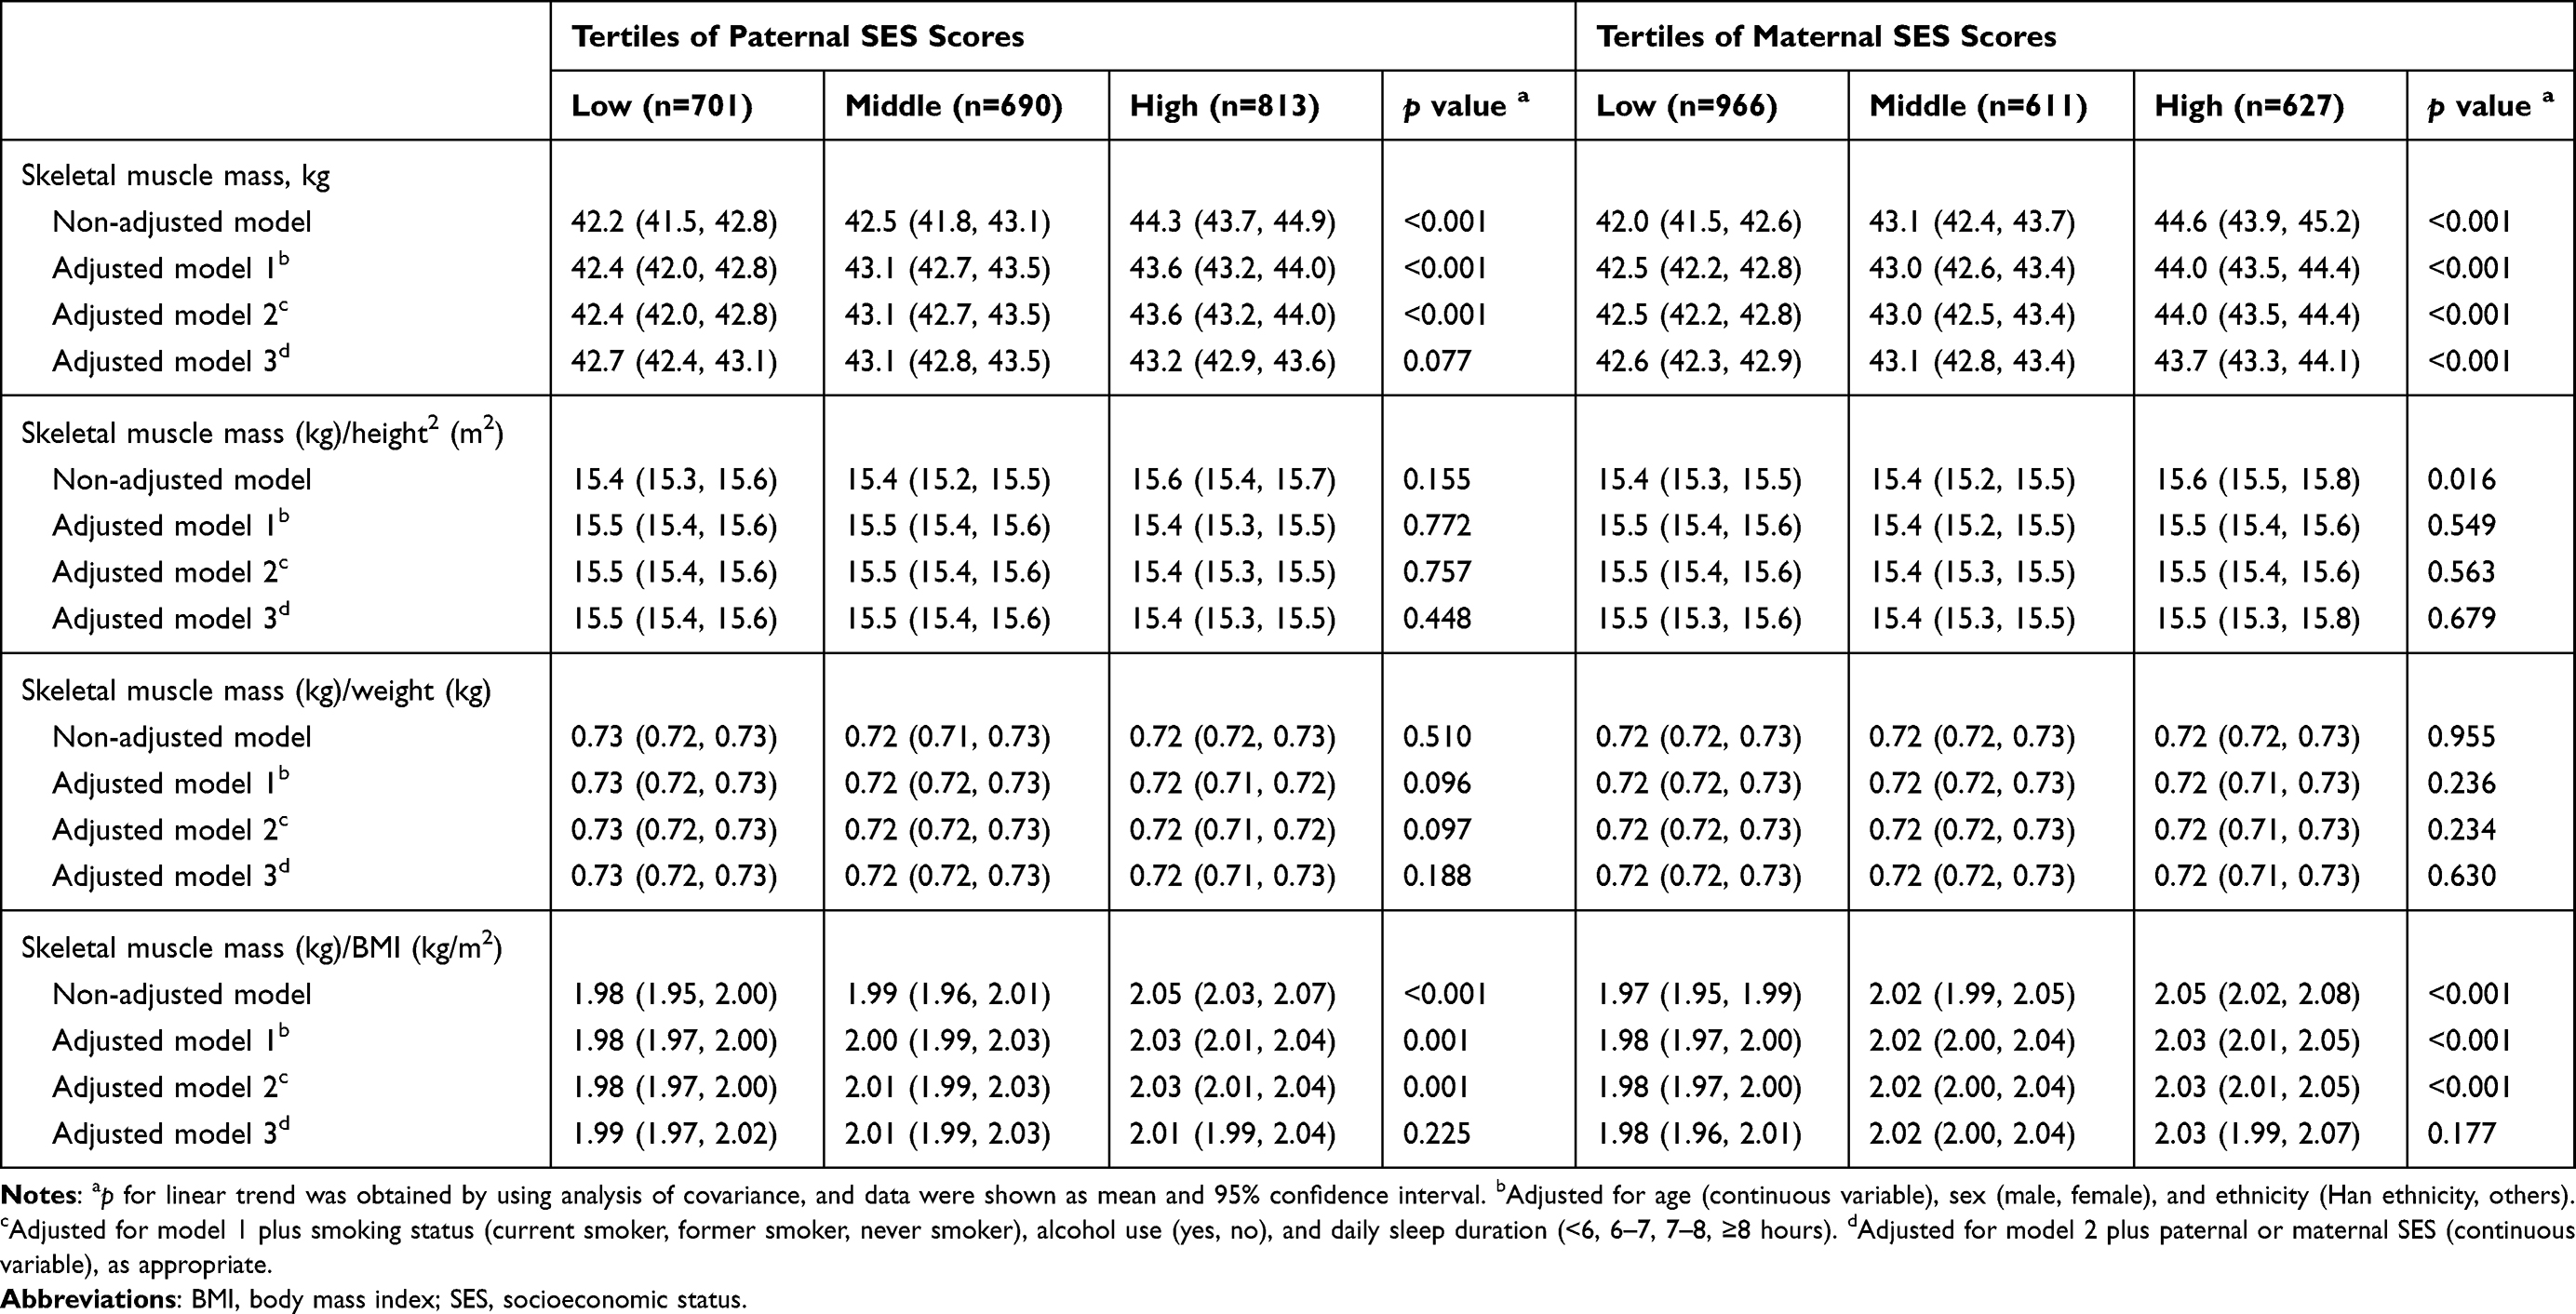 |
Table 3 Association Between Total Paternal and Maternal SES Scores and Skeletal Muscle Mass in Chinese College Freshmen (n=2204) |
A more detailed analysis of the relationship between domain-specific paternal and maternal SES levels and youths’ skeletal muscle mass after adjusting for age, gender, ethnicity, smoking status, alcohol use, and daily sleep duration (Model 2) is shown in Figure 2. Overall, higher skeletal muscle mass was associated with higher paternal and maternal educational status (p for trend < 0.001, respectively) and annual income (p for trend < 0.01, respectively); however, there was no observed linear trend for occupational status (p for trend = 0.089 for father; p for trend = 0.339 for mother). The youths had the lowest skeletal muscle mass in the paternal or maternal blue-collar job groups, which was significantly lower than that in the white-collar job groups (p < 0.05, data not shown). Similar results were also observed between SES and skeletal muscle mass adjusted by BMI (Figure 3).
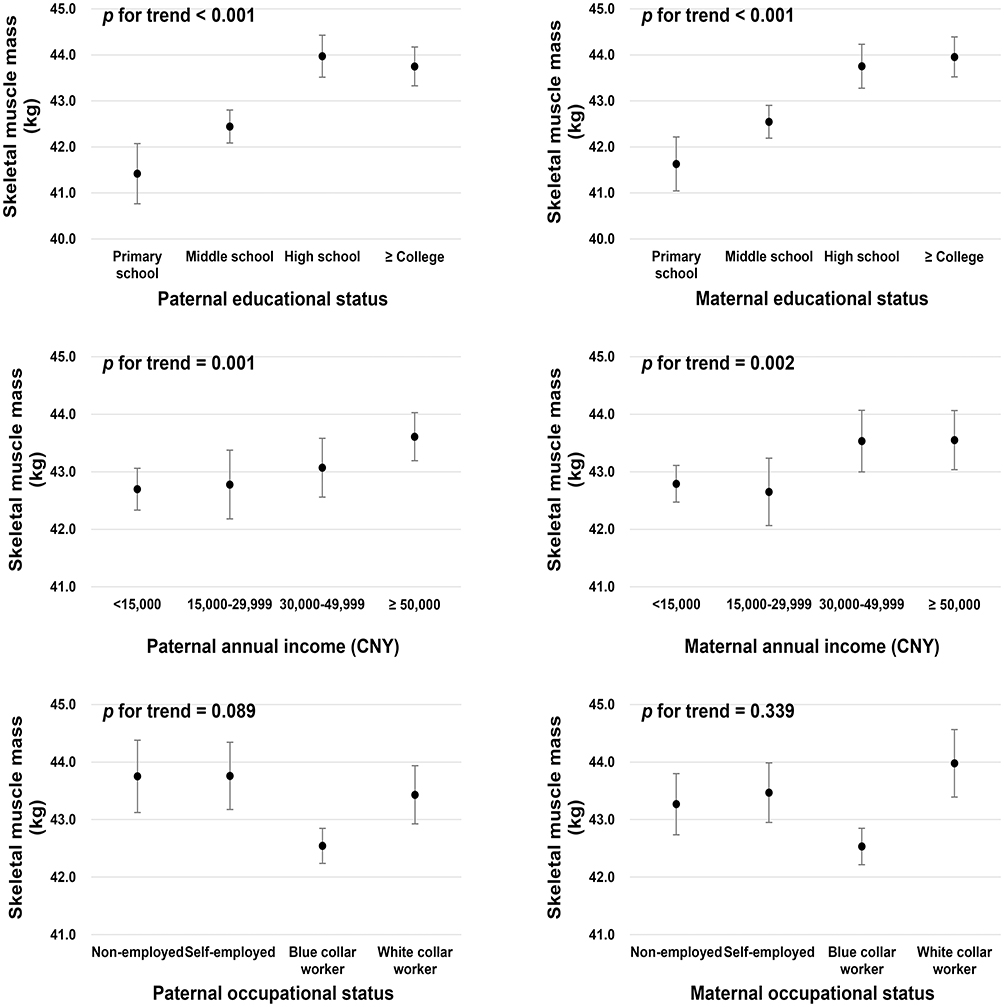 |
Figure 2 Association of paternal and maternal socioeconomic status with skeletal muscle mass in Chinese college freshmen. Analysis of covariance was performed by adjusting for age (continuous variable), sex (male, female), ethnicity (Han ethnicity, others), smoking status (current smoker, former smoker, never smoker), alcohol use (yes, no), and daily sleep duration (<6, 6–7, 7–8, ≥8 hours). Data are presented as mean and 95% confidence interval. |
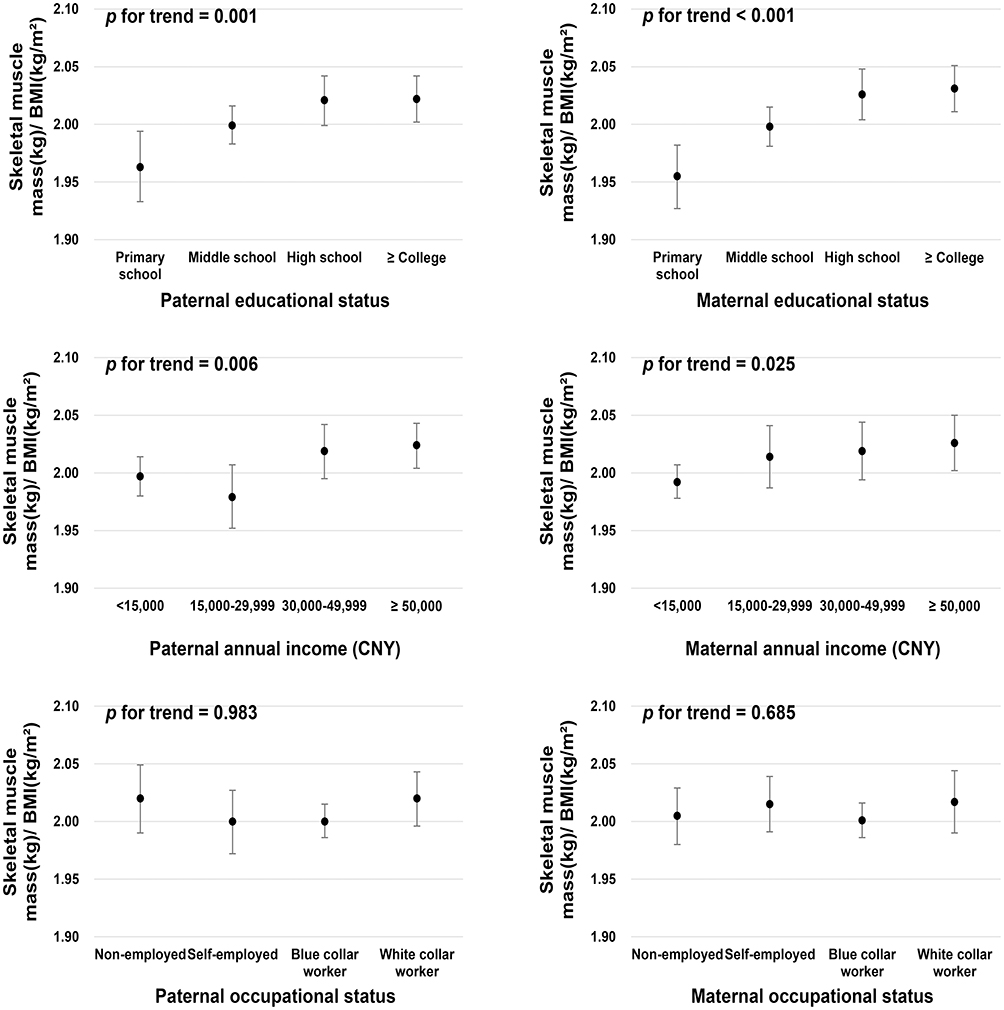 |
Figure 3 Association of paternal and maternal socioeconomic status with skeletal muscle mass adjusted by BMI in Chinese college freshmen. Analysis of covariance was performed by adjusting for age (continuous variable), sex (male, female), ethnicity (Han ethnicity, others), smoking status (current smoker, former smoker, never smoker), alcohol use (yes, no), and daily sleep duration (<6, 6–7, 7–8, ≥8 hours). Data are presented as mean and 95% confidence interval. BMI, body mass index. |
Discussion
In this cross-sectional study, we investigated the association between parental SES levels and skeletal muscle mass in Chinese college freshmen. The results indicate that students with a high total family SES scores tend to have higher skeletal muscle mass after adjusting for age, gender, ethnicity, smoking status, alcohol use, and daily sleep duration. Compared to the normalization of body height or weight, body mass index-adjusted skeletal muscle mass is more likely to be associated with SES. Paternal SES was not significantly associated with the skeletal muscle mass in youths after adjusting for maternal SES. Moreover, skeletal muscle mass was positively associated with educational status and annual income, but not with the occupational status of the parents.
This study indicates a positive association between parental SES and skeletal muscle mass in Chinese college freshmen, which is consistent with several previous studies. Pruszkowska-Przybylska et al reported that high SES was associated with high muscle mass percentage in 607 healthy Polish elementary school students aged 6–13 years.13 A cross-sectional study including 2297 Caucasian children revealed that appendicular skeletal muscle mass is lower in the lower-income London children aged 5–14 years, but this significant association is only shown in the oldest boys and girls and the youngest girls.20 In addition, a cross-sectional study found that those with sarcopenia are significantly more likely to be in the lowest income bracket than those with no sarcopenia. This was true in both men and women.21 Another observational study reported that sarcopenia was significantly associated with low income in 426 elderly Hispanic and non-Hispanic white men living in New Mexico.22 These previous studies’ results suggest that lower-income may be a risk factor for reduced skeletal muscle mass. Furthermore, this study showed that parental SES was more likely to be associated with BMI-adjusted youth skeletal muscle mass than those adjusted by height or weight. Chang et al suggested that qualitative muscle indices, which were adjusted by BMI, are more accurate in predicting low muscle function than are height- and weight-adjusted indices in Asian older adults, because they consider anthropometric characteristics as part of the definition.23
The authors of this study are unaware of any previous study regarding the independent relationship of family occupational and educational levels with skeletal muscle mass in adolescents or youths. Some studies discussed such an association in middle-aged and elderly Chinese. A study reported that participants in the lower educational level tended to have sarcopenia,24 which is similar to the results of the current study. Furthermore, findings regarding the occupational status and skeletal muscle mass in this study differ from those in currently-existing literature. A large-scale cross-sectional survey of the elderly indicated that the mean skeletal muscle mass index was lower in white-collar, blue-collar, and pink-collar workers compared to agribusiness, fisheries, and low-level workers.25 Nevertheless, our study showed a significant difference in the skeletal muscle mass of the youths between blue-collar and white-collar worker parents, with the highest muscle mass occurring in the children of white-collar worker parents. This discrepancy could be explained by the fact that those who are engaged in agricultural jobs are more physically active while those in white-collar jobs have higher SES and contribute more to their children by providing a better living environment.
Interestingly, the maternal SES was not only independently associated with muscle mass in the youths, but also affected the relationship between paternal SES and their children’s skeletal muscle mass. In China, mothers tend to take on more parenting responsibilities, which may be one reason why they play an important role in their children’s development. Although the paternal educational status is important, the maternal educational status may have a greater impact on reducing the prevalence of childhood undernutrition after adjusting for the children’s age, sex, and country developmental levels in low- and middle-income countries.26 Aslam and Kingdon reported that only the maternal educational status was a significant predictor of a child’s height and weight.27 The prevalence of stunting and underweight is higher among adolescents with low and medium SES than those with high SES.28
Notably, the nutritional status may be an underlying mechanism for the positive association between SES and skeletal muscle mass. It is well known that high intake of vegetables and fruits may lead to sufficient intakes of vitamins, such as vitamin C,29 and the trace elements.30 Students with high SES tend to consume more vegetables, fruit, grains,31 and higher amounts of vitamin C, vitamin D, and protein.32,33 Observational studies showed that sufficient vitamin C and vitamin D statuses may contribute to reduce the loss of skeletal muscle.34,35 Moreover, an 8-week intervention including branched-chain amino acids and vitamin D supplementation significantly increased the muscle strength and muscle mass in post-acute sarcopenic older adults.36 Thus, the nutritional status including the amounts of vitamins and protein consumed, may be a potential pathway underlying the association between parental SES and youths’ skeletal muscle mass, when low muscle mass is a diagnostic criterion for malnutrition.37
It is possible that the correlation between higher SES level in parents and the children’s muscle mass may be attenuated by the children’s level of participation in physical activity. Furthermore, evidence38 has shown that lower personal and household wealth are associated with an increased likelihood of inactivity. Fuemmeler et al39 pointed out that greater parental participation in moderate- to high-intensity physical exercise is associated with increased participation of the child in moderate- to high-intensity physical exercise. Apparently, parents with good exercise habits are more likely to encourage their children to participate in sports than parents who are sedentary. In addition, physical activity in young adults is a significant predictor of appendicular muscle mass and skeletal muscle mass index.40 Good exercise habits are significantly associated with a lower prevalence of sarcopenia, and exercise could effectively delay the rate of skeletal muscle mass loss in middle-aged and elderly people.41,42 The effect of resistance exercise on skeletal muscle mass is particularly significant.43 Given the cited literatures, physical activity levels may be another possible underlying mechanism of the association between parental SES and skeletal muscle mass in youths.
This study has some limitations. First, we were unable to determine the causal relationship between parental SES scores and their children’s skeletal muscle mass due to the cross-sectional study design. Secondly, the research data were obtained from only one university, which might have led to sample selection bias. Thirdly, the covariates in this study were limited. Dietary intakes, physical exercise, and genetic factors in youths should be considered as potential confounding factors.
Conclusions
In conclusion, our study revealed that higher parental SES levels are associated with skeletal muscle mass in Chinese college students. Higher parental educational status and annual income present a linear trend with the youths’ skeletal muscle mass. Compared to the normalization of height or weight, body mass index-adjusted skeletal muscle mass is more likely to be associated with SES. These findings suggest that better family SES levels may contribute to better muscular fitness in youths. Beyond economics, curbing the widening gap between the rich and the poor worldwide also has important implications for human health. Future investigation is needed to confirm the causal relationship between family SES and muscular fitness in youths.
Acknowledgments
The authors are extremely grateful to all the participants in this study. The authors would also like to express their sincere gratitude to the staffs.
Author Contributions
All authors made substantial contributions to conception and design, acquisition of data, or analysis and interpretation of data; took part in drafting the article or revising it critically for important intellectual content; agreed to submit to the current journal; gave final approval of the version to be published; and agree to be accountable for all aspects of the work.
Disclosure
The authors declare no conflict of interest.
References
1. Argiles JM, Campos N, Lopez-Pedrosa JM, Rueda R, Rodriguez-Manas L. Skeletal muscle regulates metabolism via interorgan crosstalk: roles in health and disease. J Am Med Dir Assoc. 2016;17(9):789–796.
2. Gallagher D, Visser M, De Meersman RE, et al. Appendicular skeletal muscle mass: effects of age, gender, and ethnicity. J Appl Physiol. 1997;83(1):229–239.
3. Janssen I, Heymsfield SB, Wang ZM, Ross R. Skeletal muscle mass and distribution in 468 men and women aged 18–88 yr. J Appl Physiol. 2000;89(1):81–88. doi:10.1152/jappl.2000.89.1.81
4. Burrows R, Correa-Burrows P, Reyes M, Blanco E, Albala C, Gahagan S. Low muscle mass is associated with cardiometabolic risk regardless of nutritional status in adolescents: A cross-sectional study in a Chilean birth cohort. Pediatr Diabetes. 2017;18(8):895–902.
5. Tyrovolas S, Panagiotakos D, Georgousopoulou E, et al. Skeletal muscle mass in relation to 10 year cardiovascular disease incidence among middle aged and older adults: the ATTICA study. J Epidemiol Community Health. 2020;74(1):26–31.
6. Campbell EL, Seynnes OR, Bottinelli R, et al. Skeletal muscle adaptations to physical inactivity and subsequent retraining in young men. Biogerontology. 2013;14(3):247–259.
7. Alexandrov NV, Eelderink C, Singh-Povel CM, Navis GJ, Bakker SJL, Corpeleijn E. Dietary protein sources and muscle mass over the life course: the lifelines cohort study. Nutrients. 2018;10:10.
8. Hao G, Pollock NK, Harris RA, Gutin B, Su S, Wang X. Associations between muscle mass, physical activity and dietary behaviour in adolescents. Pediatr Obes. 2019;14(3):e12471.
9. Doaei S, Kalantari N, Mohammadi NK, et al. Up-regulation of FTO gene expression was associated with increase in skeletal muscle mass in overweight male adolescents. Arch Med Sci. 2019;15(5):1133.
10. Green LW. Manual for scoring socioeconomic status for research on health behavior. Public Health Rep. 1970;85(9):815–827.
11. Braudt DB, Lawrence EM, Tilstra AM, Rogers RG, Hummer RA. Family socioeconomic status and early life mortality risk in the United States. Matern Child Health J. 2019;23(10):1382–1391. doi:10.1007/s10995-019-02799-0
12. Vanhelst J, Fardy PS, Chapelot D, Czaplicki G, Ulmer Z. Physical fitness levels of adolescents in the Ile de France region: comparisons with European standards and relevance for future cardiovascular risk. Clin Physiol Funct Imaging. 2016;36(6):476–481. doi:10.1111/cpf.12253
13. Pruszkowska-Przybylska P, Sitek A, Rosset I, et al. The association between socioeconomic status, duration of breastfeeding, parental age and birth parameters with BMI, body fat and muscle mass among prepubertal children in Poland. Anthropol Anz. 2019;76(5):409–419.
14. Schooling CM, Jiang C, Zhang W, Lam TH, Cheng KK, Leung GM. Adolescent build and diabetes: the Guangzhou Biobank Cohort Study. Ann Epidemiol. 2011;21(1):61–66. doi:10.1016/j.annepidem.2010.08.010
15. Zhang Z, Tian Y, Zhong F, et al. Association between oral health-related quality of life and depressive symptoms in Chinese college students: fitness improvement tactics in Youths (FITYou) project. Health Qual Life Outcomes. 2019;17(1):96.
16. Guo F, Tian Y, Cui Y, Huang C. Night-eating syndrome and depressive symptoms in college freshmen: fitness improvement Tactics in youths (FITYou) project. Psychol Res Behav Manag. 2020;13:185–191.
17. Association WM. Declaration of helsinki ethical principles for medical research involving human subjects. JAMA. 2013;310(20):2191–2194.
18. Bosy-Westphal A, Jensen B, Braun W, Pourhassan M, Gallagher D, Muller MJ. Quantification of whole-body and segmental skeletal muscle mass using phase-sensitive 8-electrode medical bioelectrical impedance devices. Eur J Clin Nutr. 2017;71(9):1061–1067.
19. Kim KM, Jang HC, Lim S. Differences among skeletal muscle mass indices derived from height-, weight-, and body mass index-adjusted models in assessing sarcopenia. Korean J Intern Med. 2016;31(4):643–650.
20. McCarthy HD, Eeden CV, Samani-Radia D. Influence of socioeconomic status on measures of skeletal muscle mass in children. Porc Nutr Soc. 2015;74(OCE2):E153. doi:10.1017/S0029665115001718
21. Alexandre Tda S, Duarte YA, Santos JL, Wong R, Lebrao ML. Prevalence and associated factors of sarcopenia among elderly in Brazil: findings from the SABE study. J Nutr Health Aging. 2014;18(3):284–290.
22. Baumgartner RN, Koehler KM, Gallagher D, et al. Epidemiology of sarcopenia among the elderly in New Mexico. Am J Epidemiol. 1998;147(8):755–763.
23. Chang JS, Kim TH, Kim H, Choi EH, Kim N, Kong ID. Qualitative muscle mass index as a predictor of skeletal muscle function deficit in Asian older adults. Geriatr Gerontol Int. 2017;17:99–107.
24. Liu X, Hao Q, Yue J, et al. Sarcopenia, obesity and sarcopenia obesity in comparison: prevalence, metabolic profile, and key differences: results from WCHAT study. J Nutr Health Aging. 2020;24(4):429–437.
25. Kim SH, Kim W, Yang S, Kwon S, Choi KH. Influence of occupation on sarcopenia, sarcopenic obesity, and metabolic syndrome in men over 65 years of age. J Occup Environ Med. 2018;60(10):e512–e517.
26. Vollmer S, Bommer C, Krishna A, Harttgen K, Subramanian SV. The association of parental education with childhood undernutrition in low- and middle-income countries: comparing the role of paternal and maternal education. Int J Epidemiol. 2017;46(1):312–323.
27. Aslam M, Kingdon GG. Parental education and child health - understanding the pathways of impact in Pakistan. World Dev. 2012;40(10):2014–2032.
28. Dapi LN, Janlert U, Nouedoui C, Stenlund H, Haglin L. Socioeconomic and gender differences in adolescents’ nutritional status in urban Cameroon, Africa. Nutr Res. 2009;29(5):313–319.
29. Slavin JL, Lloyd B. Health benefits of fruits and vegetables. Adv Nutr. 2012;3(4):506–516. doi:10.3945/an.112.002154
30. Angeles-Agdeppa I, Sun Y, Denney L, et al. Food sources, energy and nutrient intakes of adults: 2013 Philippines National Nutrition Survey. Nutr J. 2019;18(1):59. doi:10.1186/s12937-019-0481-z
31. Fahlman MM, McCaughtry N, Martin J, Shen B. Racial and socioeconomic disparities in nutrition behaviors: targeted interventions needed. J Nutr Educ Behav. 2010;42(1):10–16. doi:10.1016/j.jneb.2008.11.003
32. Nabhani-Zeidan M, Naja F, Nasreddine L. Dietary intake and nutrition-related knowledge in a sample of Lebanese adolescents of contrasting socioeconomic status. Food Nutr Bull. 2011;32(2):75–83.
33. Salamoun MM, Kizirian AS, Tannous RI, et al. Low calcium and vitamin D intake in healthy children and adolescents and their correlates. Eur J Clin Nutr. 2005;59(2):177–184.
34. Lewis LN, Hayhoe RPG, Mulligan AA, et al. Circulating Vitamin C in middle- and older-aged men and women are associated with lower estimated skeletal muscle mass. J Nutr. 2020.
35. Liu G, Lu L, Sun Q, et al. Poor vitamin D status is prospectively associated with greater muscle mass loss in middle-aged and elderly Chinese individuals. J Acad Nutr Diet. 2014;114(10):1544–1551 e1542.
36. Takeuchi I, Yoshimura Y, Shimazu S, Jeong S, Yamaga M, Koga H. Effects of branched-chain amino acids and vitamin D supplementation on physical function, muscle mass and strength, and nutritional status in sarcopenic older adults undergoing hospital-based rehabilitation: A multicenter randomized controlled trial. Geriatr Gerontol Int. 2019;19(1):12–17.
37. Deutz NEP, Ashurst I, Ballesteros MD, et al. The underappreciated role of low muscle mass in the management of malnutrition. J Am Med Dir Assoc. 2019;20(1):22–27.
38. Janssen I, Boyce WF, Simpson K, Pickett W. Influence of individual-and area-level measures of socioeconomic status on obesity, unhealthy eating, and physical inactivity in Canadian adolescents. Am J Clin Nutr. 2006;83(1):139–145.
39. Fuemmeler BF, Anderson CB, Mâsse LC. Parent-child relationship of directly measured physical activity. Int J Behav Nutr Phys Act. 2011;8(1):17.
40. Ayabe M, Kumahara H, Yamaguchi-Watanabe A, et al. Appendicular muscle mass and exercise/sports participation history in young Japanese women. Ann Hum Biol. 2019;46(4):335–339.
41. Akune T, Muraki S, Oka H, et al. Exercise habits during middle age are associated with lower prevalence of sarcopenia: the ROAD study. Osteoporosis Int. 2014;25(3):1081–1088.
42. Leon AS. Attenuation of adverse effects of aging on skeletal muscle by regular exercise and nutritional support. Am J Lifestyle Med. 2017;11(1):4–16.
43. Forbes SC, Little JP, Candow DG. Exercise and nutritional interventions for improving aging muscle health. Endocrine. 2012;42(1):29–38.
 © 2020 The Author(s). This work is published and licensed by Dove Medical Press Limited. The
full terms of this license are available at https://www.dovepress.com/terms
and incorporate the Creative Commons Attribution
- Non Commercial (unported, 3.0) License.
By accessing the work you hereby accept the Terms. Non-commercial uses of the work are permitted
without any further permission from Dove Medical Press Limited, provided the work is properly
attributed. For permission for commercial use of this work, please see paragraphs 4.2 and 5 of our Terms.
© 2020 The Author(s). This work is published and licensed by Dove Medical Press Limited. The
full terms of this license are available at https://www.dovepress.com/terms
and incorporate the Creative Commons Attribution
- Non Commercial (unported, 3.0) License.
By accessing the work you hereby accept the Terms. Non-commercial uses of the work are permitted
without any further permission from Dove Medical Press Limited, provided the work is properly
attributed. For permission for commercial use of this work, please see paragraphs 4.2 and 5 of our Terms.