Back to Archived Journals » Reports in Medical Imaging » Volume 14
Artificial Intelligence in Predicting Clinical Outcome in COVID-19 Patients from Clinical, Biochemical and a Qualitative Chest X-Ray Scoring System
Authors Esposito A ![]() , Casiraghi E, Chiaraviglio F, Scarabelli A, Stellato E, Plensich G, Lastella G, Di Meglio L, Fusco S, Avola E
, Casiraghi E, Chiaraviglio F, Scarabelli A, Stellato E, Plensich G, Lastella G, Di Meglio L, Fusco S, Avola E ![]() , Jachetti A, Giannitto C, Malchiodi D
, Jachetti A, Giannitto C, Malchiodi D ![]() , Frasca M, Beheshti A, Robinson PN, Valentini G, Forzenigo L, Carrafiello G
, Frasca M, Beheshti A, Robinson PN, Valentini G, Forzenigo L, Carrafiello G
Received 16 November 2020
Accepted for publication 28 February 2021
Published 12 March 2021 Volume 2021:14 Pages 27—39
DOI https://doi.org/10.2147/RMI.S292314
Checked for plagiarism Yes
Review by Single anonymous peer review
Peer reviewer comments 3
Editor who approved publication: Professor Tarik Massoud
Andrea Esposito,1 Elena Casiraghi,2 Francesca Chiaraviglio,1 Alice Scarabelli,3 Elvira Stellato,3 Guido Plensich,3 Giulia Lastella,1 Letizia Di Meglio,3 Stefano Fusco,3 Emanuele Avola,3 Alessandro Jachetti,4 Caterina Giannitto,5 Dario Malchiodi,2 Marco Frasca,2 Afshin Beheshti,6,7 Peter N Robinson,8,9 Giorgio Valentini,2 Laura Forzenigo,1 Gianpaolo Carrafiello1
1Radiology Department, Foundation IRCCS Ospedale Maggiore Policlinico Hospital, Milan, 20122, Italy; 2Anacleto Lab, Computer Science Department, University of Milan, Milan, 20133, Italy; 3Postgraduate School of Diagnostic and Interventional Radiology, University of Milan, Milan, 20122, Italy; 4Accident and Emergency Department, Foundation IRCCS Ospedale Maggiore Policlinico Hospital, Milan, 20122, Italy; 5Radiology Department, Humanitas Research Hospital, Milan, 20013, Italy; 6KBR, Space Biosciences Division, NASA Ames Research Center, Moffett Field, CA, 94035, USA; 7Stanley Center for Psychiatric Research, Broad Institute of MIT and Harvard, Cambridge, MA, 02142, USA; 8The Jackson Laboratory for Genomic Medicine, Farmington, CT, 06032, USA; 9Institute for Systems Genomics, University of Connecticut, Farmington, CT, 06030, USA
Correspondence: Elvira Stellato; Alice Scarabelli Email [email protected]; [email protected]
Purpose: To determine the performance of a chest radiograph (CXR) severity scoring system combined with clinical and laboratory data in predicting the outcome of COVID-19 patients.
Materials and Methods: We retrospectively enrolled 301 patients who had reverse transcriptase-polymerase chain reaction (RT-PCR) positive results for COVID-19. CXRs, clinical and laboratory data were collected. A CXR severity scoring system based on a qualitative evaluation by two expert thoracic radiologists was defined. Based on the clinical outcome, the patients were divided into two classes: moderate/mild (patients who did not die or were not intubated) and severe (patients who were intubated and/or died). ROC curve analysis was applied to identify the cut-off point maximizing the Youden index in the prediction of the outcome. Clinical and laboratory data were analyzed through Boruta and Random Forest classifiers.
Results: The agreement between the two radiologist scores was substantial (kappa = 0.76). A radiological score ≥ 9 predicted a severe class: sensitivity = 0.67, specificity = 0.58, accuracy = 0.61, PPV = 0.40, NPV = 0.81, F1 score = 0.50, AUC = 0.65. Such performance was improved to sensitivity = 0.80, specificity = 0.86, accuracy = 0.84, PPV = 0.73, NPV = 0.90, F1 score = 0.76, AUC= 0.82, combining two clinical variables (oxygen saturation [SpO2]), the ratio of arterial oxygen partial pressure to fractional inspired oxygen [P/F ratio] and three laboratory test results (C-reactive protein, lymphocytes [%], hemoglobin).
Conclusion: Our CXR severity score assigned by the two radiologists, who read the CXRs combined with some specific clinical data and laboratory results, has the potential role in predicting the outcome of COVID-19 patients.
Keywords: radiography, thoracic, COVID-19, artificial intelligence, prognosis
Introduction
Coronavirus disease 2019 (COVID-19), caused by the novel severe acute respiratory syndrome coronavirus 2 (SARS-CoV-2), emerged in Wuhan, China, in December 2019 and quickly became a pandemic.1 As of February 16, 2021, World Health Organization (WHO) data reported 2,729,223 confirmed cases in Italy, with 93,835 deaths.2 The Fleischner Society presented three different scenarios and an algorithm for a recommendation on the use of chest imaging that included computed tomography (CT) and/or chest radiography (CXR), to direct patient management during the COVID-19 pandemic. Ultimately, the choice of imaging modality is left to the judgement of clinical teams at the point of care, accounting for the differing attributes of chest radiography and CT, local resources, and expertise.3 CXR is not sensitive to mild or early COVID-19 infection,4 but the greater sensitivity of CT for early pneumonic changes is partially reduced by the huge burden placed on radiology departments in terms of staff commitment, CT room workflow and disinfection procedures.3,4 Therefore, many Italian hospitals decided to employ CXR as a first-line triage tool. In addition, CXR provided faster results compared to reverse transcriptase polymerase-chain reaction (RT-PCR), which is the current commonly utilized detection method for COVID-19.4–6
CXR has been widely used and it is still performed as the primary imaging modality for large-scale screening and clinical management of COVID-19 patients. CXR, in a single anteroposterior projection, was routinely obtained and it is still done in the emergency department (ED) for patients presenting with dyspnea and/or fever and a high pre-test probability of COVID-19 (based upon individual’s exposure risk), alongside the initial RT-PCR testing. Moreover, recent studies examined the utility of initial CXR on predicting clinical outcome.4,7–11 These studies correlated the presence and the extension of opacities on initial CXR with the need for hospitalization and/or for intubation.
In this worldwide health crisis, Artificial Intelligence (AI) has been considered as a useful tool to identify early COVID-19 infections and to monitor the condition of the infected patients.12–14 The literature provides several examples of AI-based methodologies designed to help clinicians and radiologists to pick up the most important information from a lot of clinical, laboratory and radiological features.7,15,16 The aim of our study was to explore the relationship between a qualitative CXR severity scoring system and clinical, laboratory findings of COVID-19 patients at admission, as well as to determine their combined performances in predicting the outcome of these patients with the support of dedicated AI-based techniques.
Materials and Methods
Patient Population and Clinical Data Collection
We retrospectively enrolled 301 patients that were referred to the ED of an urban multicenter health system, from March 6th to April 9th, with RT-PCR positive result for COVID-19 confirmation. This retrospective study was accepted by the Ethics Committee of our Institution, Foundation IRCCS Ca’ Granda Maggiore Policlinico Hospital which also waived the requirement for informed patient consent, for its retrospective nature. This retrospective study was conducted in accordance with the principles of the Declaration of Helsinki. The institutional review board approved the study according to General Data Protection Regulation (GDPR).
All these patients underwent a CXR at admission in the ED. We registered age, gender, past medical history, clinical findings, comorbidities, laboratory test results, and length from symptom onset to presentation. Temperature and body mass index (BMI) were also collected. Fever was defined by temperature >99.5° F while obesity was indicated by a BMI > 30 kg/m2. All patients were followed for 90 days from the initial ED presentation. The patients who were not hospitalized were contacted by phone to check up on their condition, and those who were hospitalized were evaluated throughout their hospitalization using their Electronic Medical Records. This period was sufficient to evaluate the outcome of all the 301 patients.
All this information was collected by our team and the data were registered in an electronic database.
We assessed the discrimination capability of the collected variables with respect to the patients’ outcome. We divided the patients into two classes: moderate/mild and severe. Moderate/mild class included patients who did not die or were not intubated while severe class included patients who were intubated or died.
Chest X-Ray Analysis
All patients received either digital anteroposterior (A-P) CXR (240 patients; 80%) or digital posteroanterior and lateral (P-A/Lat) CXR (61 patients; 20%) at the admission at the ED. Two thoracic radiologists, respectively, with 23 and 20 years of experience in thoracic imaging, reviewed the baseline CXR independently of each other. To minimize bias, reviewers were blind to patient histories and their COVID-19 positivity.
To assess the severity of pulmonary involvement, a qualitative pulmonary radiological severity scoring system was defined by each radiologist as follows.
Each lung was divided manually, by each radiologist, into three quadrants, with similar height, by tracing two horizontal lines: the highest line passed through the middle of the aortic arch, the lowest line through the bifurcation of inferior pulmonary arteries. Each lung was divided into a superior (from apices to the middle of aortic arch), middle (fSSorm the middle of aortic arch to the bifurcation of inferior pulmonary arteries) and an inferior quadrant (from the bifurcation of inferior pulmonary arteries to the diaphragm sulcus), for a total of six quadrants.
More precisely, the quadrants were defined as follows:
- Right lung: Superior Right Quadrant (SRQ), Middle Right Quadrant (MRQ) and Inferior Right Quadrant (IRQ);
- Left lung: Superior Left Quadrant (SLQ), Middle Left Quadrant (MLQ) and Inferior Left;
- Quadrant (ILQ).
For each quadrant, the radiologists assigned a score from 0 to 4, as follows: 0 = negative, no anomaly evaluated; 1 = presence of reticular interstitial thickening; 2 = presence of ground glass opacities ± reticular interstitial thickening; 3 = presence of ground glass plus consolidation with ground glass as the most widespread anomaly; 4 = presence of consolidation or presence of ground glass plus consolidation, with consolidation as the most widespread anomaly.
For each patient, the CXR score could range from 0, completely normal quadrants, to 24, which indicated the presence of consolidation as the most widespread anomaly in all the six quadrants. An example of the calculation of the score by each evaluator using pulmonary division is displayed in Figure 1.
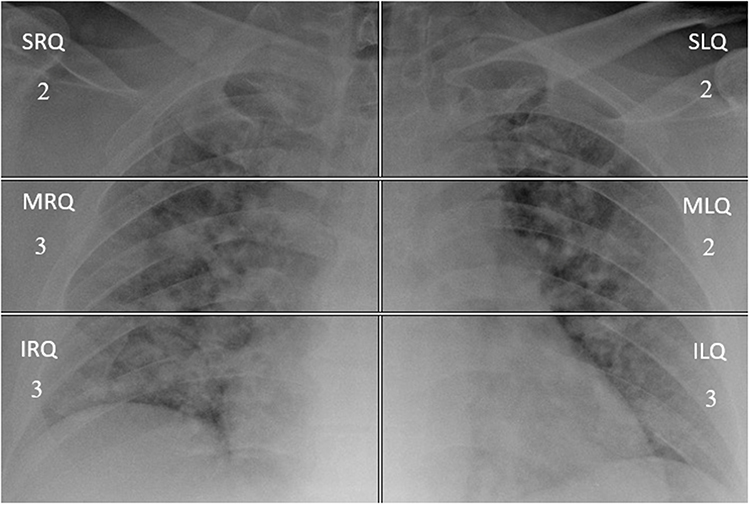 |
Figure 1 Example of the CXR severity score. Portable chest radiograph (CXR) of a COVID-19 patient. Division of CXR in six segments for the final evaluation score. CXR shows lower lung quadrants, middle lung quadrants, and upper lung quadrants hazy opacities; total score = 15. The patient was intubated. The numbers in each quadrant correspond to the score reported by the two radiologists. In this case there was a complete agreement, for each quadrant, between the two evaluators. The highest line passes through the middle of aortic arch. The lowest line passes through the bifurcation of inferior pulmonary arteries. 2 = presence of ground glass opacities; 3 = presence of ground glass plus consolidation with ground glass as the most widespread anomaly. Abbreviations: SRQ, superior right quadrant; MRQ, middle right quadrant; IRQ, inferior right quadrant; SLQ, superior left quadrant; MLQ, middle left quadrant; ILQ, inferior left quadrant. |
The rounded average of the scores assigned by the two evaluators to a patient was referred to as the Radio.Score of that patient. We obtained 301 Radio.Scores.
The agreement between the two radiologists’ scores was measured using Cohen’s kappa.17 Kappa agreements were characterized according to Landis and Koch criteria as slight (kappa= 0.00–0.20), fair (kappa= 0.21–0.40), moderate (kappa = 0.41–0.60), substantial (kappa= 0.61–0.80), and almost perfect (kappa 0.81–1.00).18
Statistical and Artificial Intelligence Analysis
Numeric variables were expressed using their mean, standard error of the mean and their range. When discrete values were treated, the mean was rounded to the nearest integer value. Assessment of the capability of each variable in discriminating between moderate/mild and severe class was performed using one-sided Wilcoxon signed-rank and chi-square test, respectively, as appropriate for numeric or categorical variables. In both cases a 95% confidence level was selected (p-value <0.05).
Before processing, unbiased missing data imputation was performed without considering the patients’ class classification.
In particular, to quantify the “lack of data”, we computed the percentage of missing values on a per-variable basis, by dividing the number of missing values by the number of patients. Two variables, lactate dehydrogenase (LDH) and aspartate amino-transaminase (AST) were removed because they had, respectively, 77% and 67% of missing values, and their imputation would have not been meaningful.
For the other variables, Figure 2 shows that, symptoms, comorbidities, age, sex, and Radio.Score had information for all the patients, while the variables having the highest percentage of missing values were oxygen saturation (SpO2), the ratio of arterial oxygen partial pressure to fractional inspired oxygen (P/F ratio) and alanine amino-transaminase (ALT).
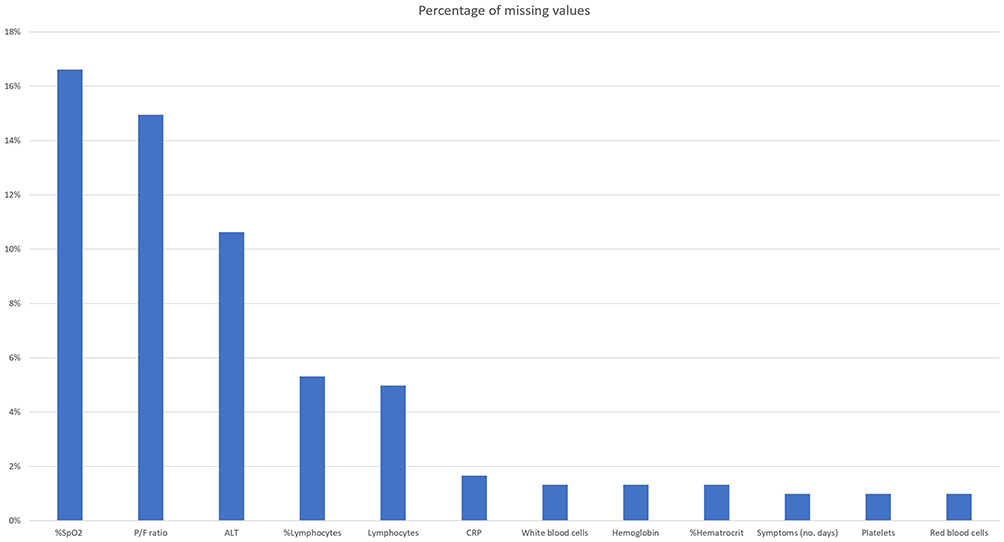 |
Figure 2 Percentage of missing values for variables with missing data. Abbreviations: ALT, alanine amino-transaminase; P/F ratio, the ratio of arterial oxygen partial pressure to fractional inspired oxygen; CRP, C-reactive protein; SpO2, oxygen saturation. |
For estimation of missing data, our study used Multiple Imputation by Chained Equations (mice),19,20 which produces 100 different imputations using a base imputation model.
As base imputation models we used Predictive Mean Matching (PMM)-mice19 and Random Forest classifiers (RF)-mice.21 PMM-mice essentially uses the values of a neighbor, where the neighbor is randomly selected among the k nearest points in bootstrap samples.
RF-mice estimates the missing values by using the samples without missing data to predict the missing ones. The imputations obtained were compared to the 100 imputations computed by missForest,21–23 which applies Random Forests (RF) in a similar way to RF-mice. To choose the best imputation model, as detailed in Casiraghi et al,24 this study used the Wilcoxon rank-sum test (p-value < 0.05) to statistically compare the between-imputation-variances obtained with increasing imputation runs (from 1 to 100). This showed that missForest was the most stable imputer. The final dataset was obtained by averaging the results of missForest.
To obtain an unbiased evaluation,25 a stratified 10-fold cross-validation (10-fold CV) strategy was applied. The dataset was split into 10 stratified folds and an iterative procedure was applied; at each iteration, 9 folds were used for training and the fold that was “left out” was used as the test.
On each training set (Figure 3), the following steps were consecutively applied:
- The best Radio.Score threshold (CXR cut-off point) was computed as the average of the values maximizing the Youden index (measured as sensitivity+specificity-1) on 1000 bootstrapped samples.
- Samples below the CXR cut-off point were considered as moderate/mild patients, while those above the CXR cut-point were further analyzed to select the most important variables for a more precise outcome prediction. To this aim, Boruta algorithm23,26–29 used an internal 5-fold cross-validation as detailed by Casiraghi et al.24
- Selected variables were used to train an RF, which was then pruned and simplified to create a simple associative tree30,31 and to finally estimate the importance of the variables.26
 |
Figure 3 A schematic diagram of the algorithm. Abbreviations: PMM-mice, predictive mean matching-multiple imputation by chained equations; RF-mice, random forest classifiers-multiple imputation by chained equations. |
The test fold was then classified as follows: 1) The best CXR cut-off point was used to identify the moderate/mild class, at the same time 2) the outcome of samples with Radio.Score above the CXR cut-off point was predicted by using the rules in the associative tree.
At the end of the iteration over all the 10-folds, each variable had an associated mean feature relevance and each patient had a classification computed when the patient was not in the training set, which allowed computing an unbiased estimate of the model performance. To obtain a global associative tree to roll out the classification system on the clinical practice, the 10 associative trees (one for each training set) were merged by removing duplicates and by applying logics.30,31
The described pipeline (Figure 4) is being applied to novel patients who access the ED and present RT-PCR positive result for COVID-19 confirmation.
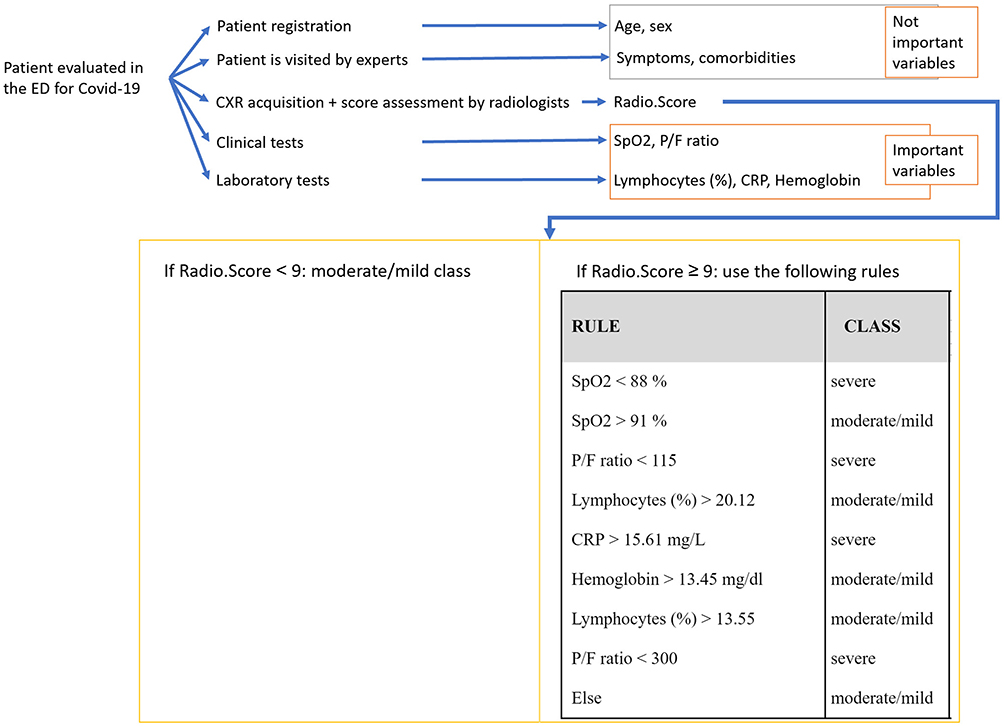 |
Figure 4 Patient classification pipeline. Abbreviations: ED, emergency department; P/F ratio, the ratio of arterial oxygen partial pressure to fractional inspired oxygen; CRP, C-reactive protein; SpO2, oxygen saturation. |
Class prediction results are reported through sensitivity, specificity, accuracy, positive predictive value (PPV), negative predictive value (NPV), F1 score and area under the curve (AUC). The code for the data analysis was implemented in R language,32 by using the following packages: mice, missForest, Boruta, caret, RandomForest, cutpointr, and inTrees, all available from the CRAN repository.
Results
A total of 301 COVID-19 positive adults were included (median age 61 [range 23–95]; 207 men and 94 women). The mean number of days from symptom/sign onset to presentation in the ED was 7. The mean, standard error (s.e.), minimum and maximum number of days from a symptom/sign onset for the two classes were similar: 7 ± 0.36 for patients who did not die or were not intubated (moderate/mild class), 7 ± 0.51 for patients who died or were intubated (severe class).
Patients’ demographic data are presented (Table 1). Both the majority of men (70.1%) and the majority of women (73.4%) were in the moderate/mild class. For men, the outcomes were ranked as follows: hospitalized but recovered without intubation (55.6%), dead (18.8%), not hospitalized (14.5%), intubated (11.1%). For women, the outcomes were ranked as follows: hospitalized but recovered without intubation (45.7%), not hospitalized (27.7%), intubated (13.8%), dead (12.8%).
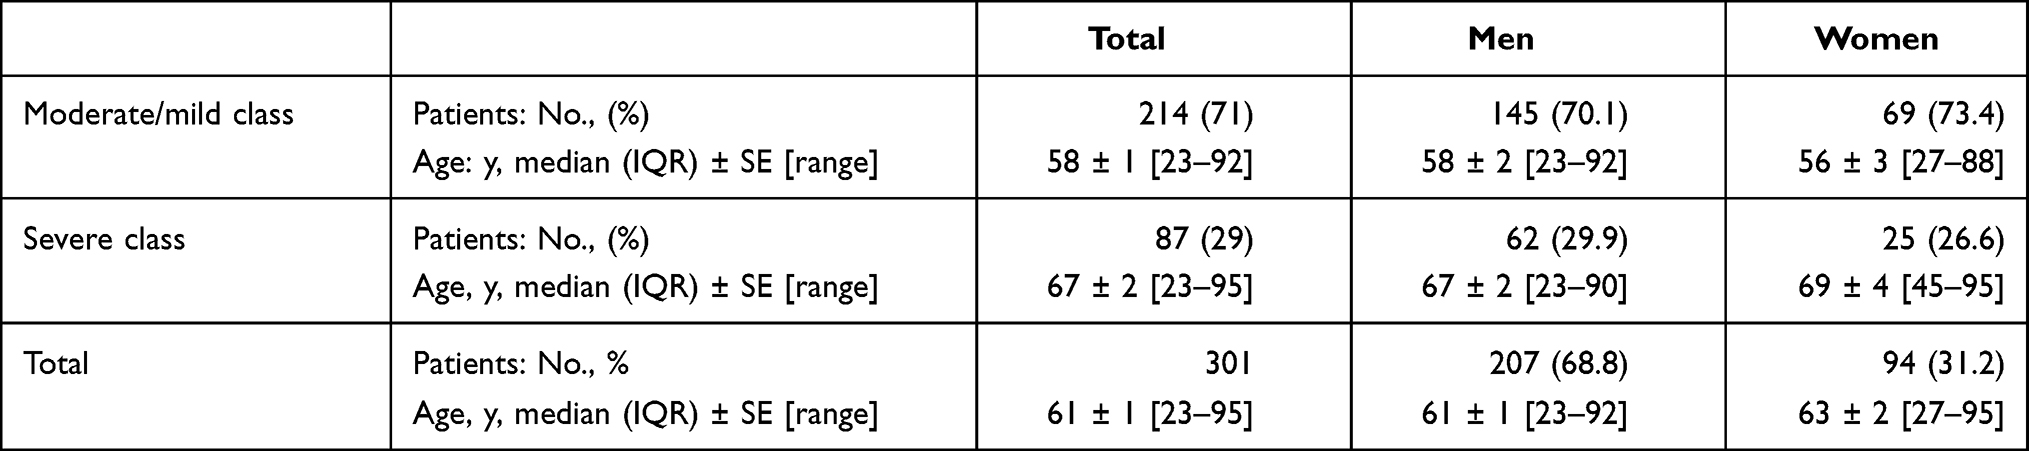 |
Table 1 Number of Patients per Class, Divided for Gender. The Age is Reported with Median, Standard Error of the Median (SE) and Range |
CXR scoring system, clinical findings, comorbidities, laboratory test results are presented for all the admitted patients (Table 2).
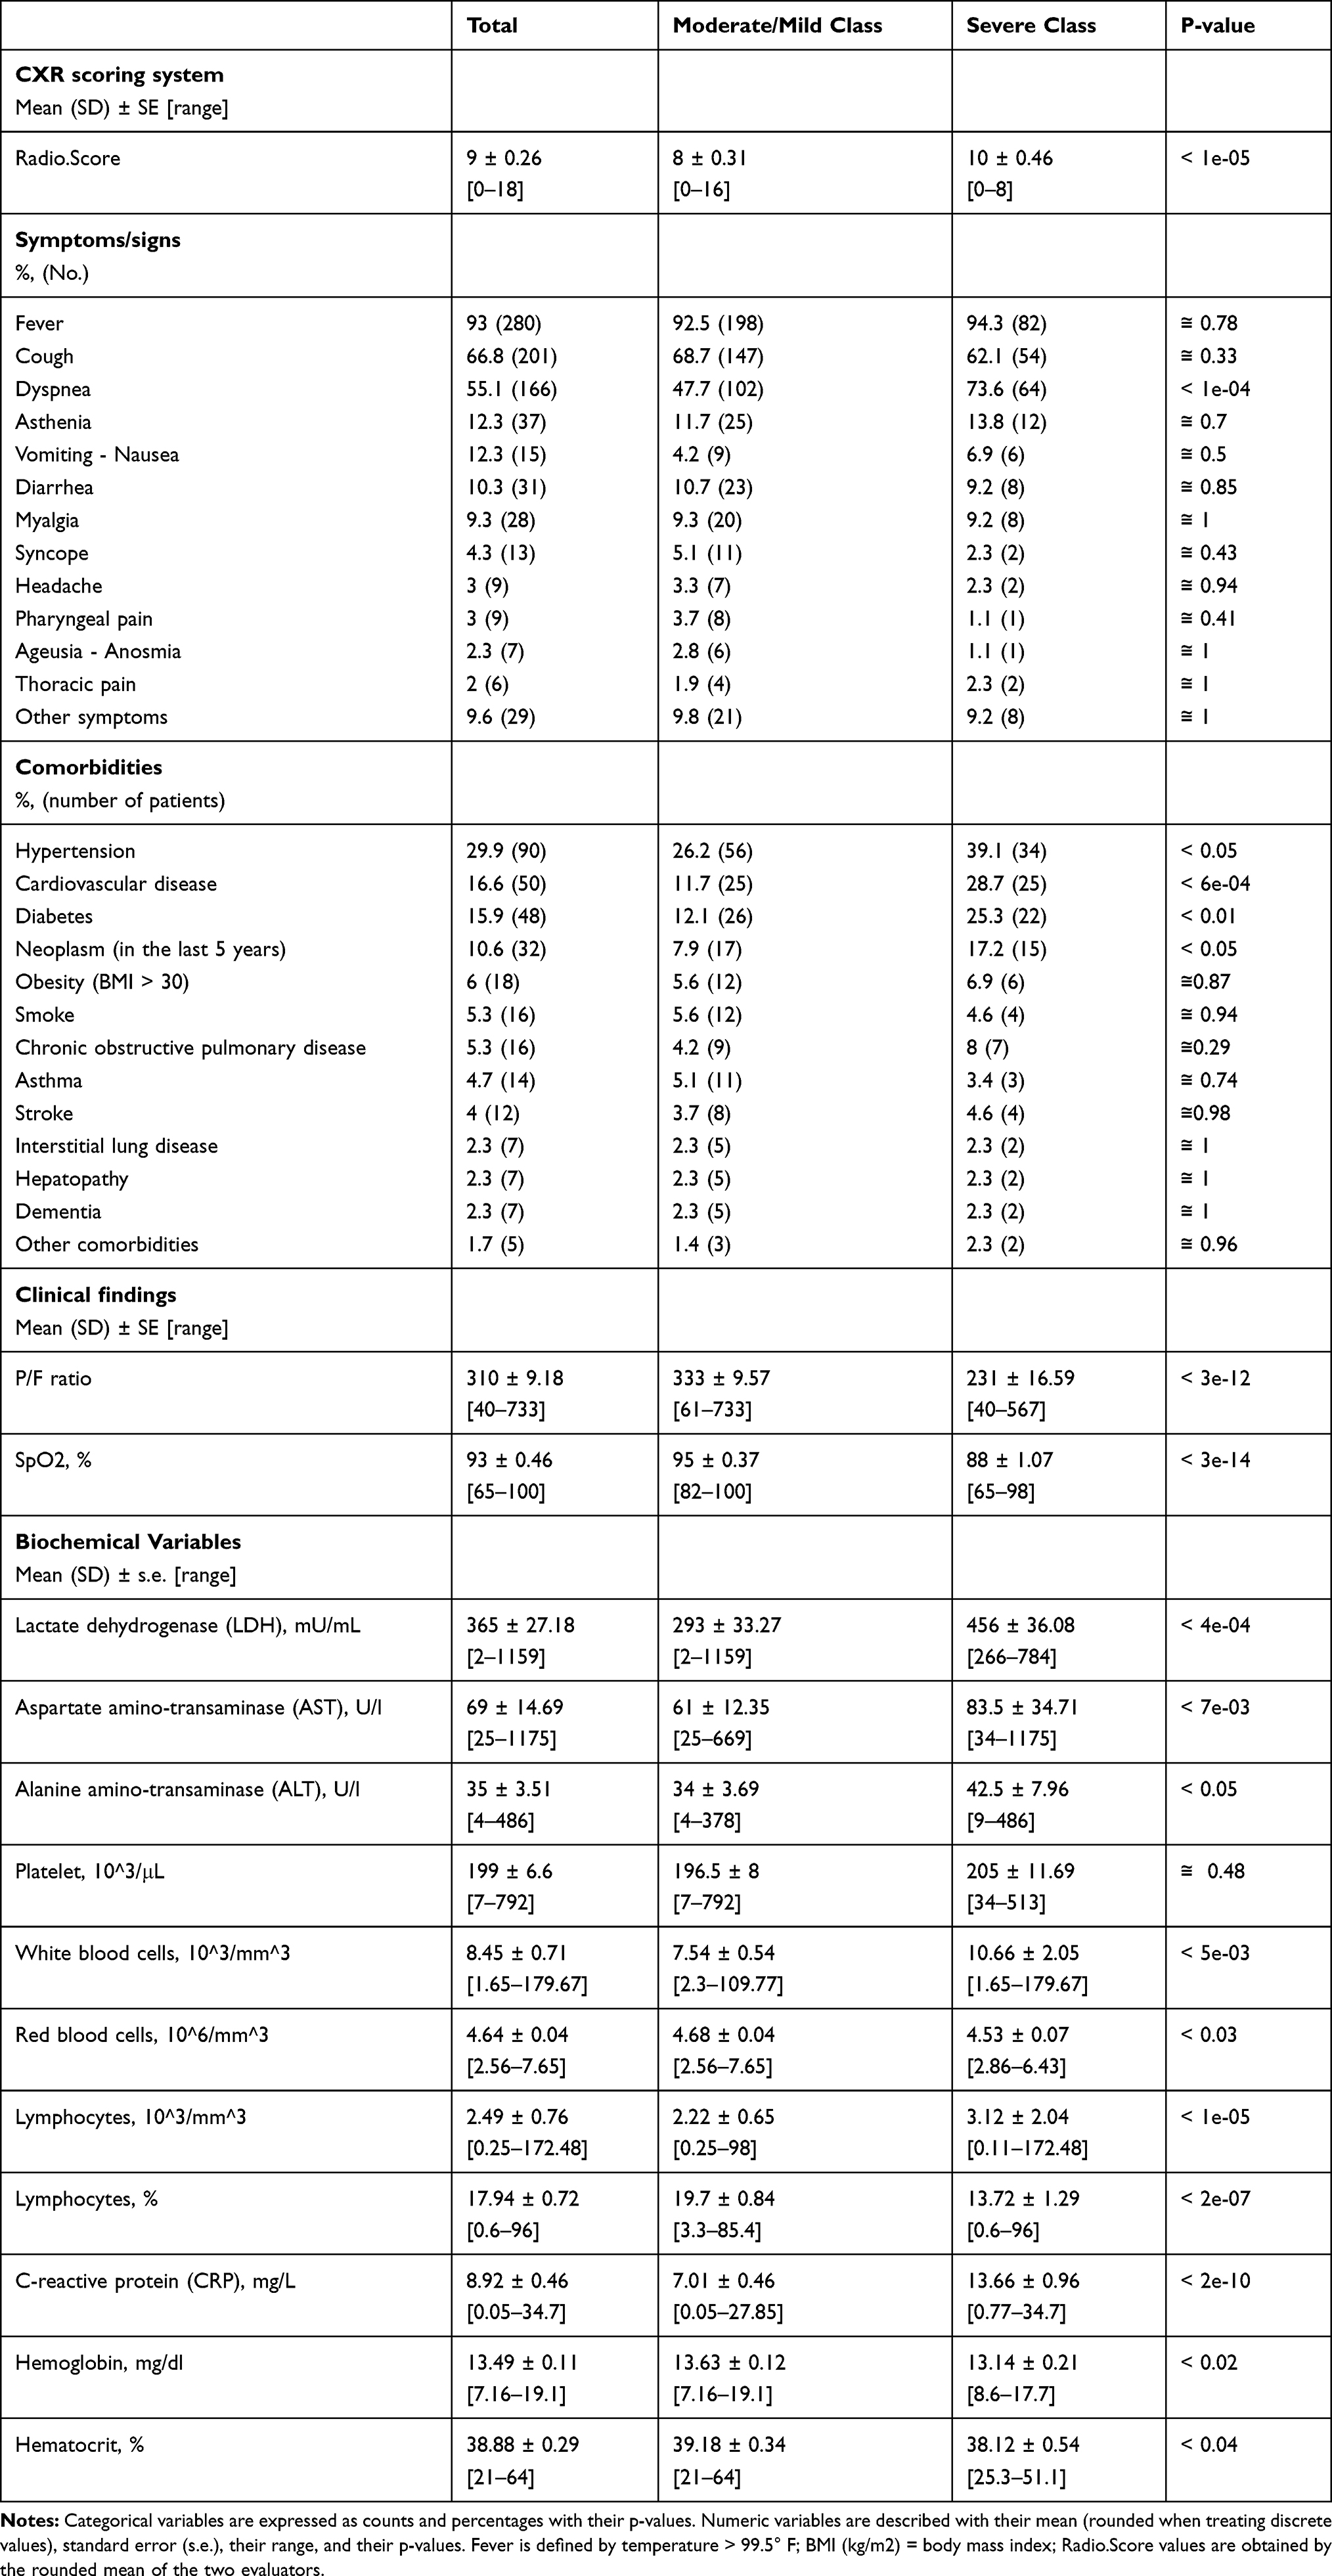 |
Table 2 CXR Scoring System, Symptoms/Signs, Comorbidities, Clinical Findings, and Biochemical Variables at Admission, for 301 Patients in the ED Setting |
The mean value of the radiological scoring system of the two radiologists (Radio.Score) was 9. The agreement between the two radiologist scores was substantial (kappa = 0.76, p-value <0.01) and Radio.Score was considered significant by AI-based analysis to stratify the class of COVID-19 patients. The most represented symptoms/signs were fever (93%), cough (66.8%) and dyspnea (55.1%). Before imputation, lactate dehydrogenase (LDH) and aspartate aminotransferase (AST) were deleted since they had more than 50% of missing values.
The maximization of the Youden index on 1000 bootstrapped samples revealed an optimal CXR cut-off point (Radio.Score threshold) equal to 8.5. Therefore, the moderate/mild class corresponded to Radio.Score ≤ 8, while Radio.Score ≥ 9 predicted the severe class (corresponding to the 63% of patients) with a sensitivity = 0.67, a specificity = 0.58, an accuracy = 0.61, a PPV = 0.40, an NPV = 0.81, a F1 score = 0.50, an AUC = 0.65.
For patients with Radio.Score ≥ 9, the variables considered as most important by the Random Forests classifiers were two clinical variables (Oxygen Saturation [SpO2], the ratio of arterial oxygen partial pressure to fractional inspired oxygen ratio [P/F ratio]) and three laboratory test results (C-reactive protein [CRP], lymphocytes [%], hemoglobin [g/dl]). Table 3 shows the rules computed by Random Forest with the combined aforementioned variables with Radio.Score ≥ 9. Such rules achieved a sensitivity = 0.80, a specificity = 0.86, an accuracy = 0.84, a PPV = 0.73, an NPV = 0.90, a F1 score = 0.76, an AUC=0.82. The best thresholds for the most important variables allowing to improve Radio.Score performance in recognizing patients in the severe class (patients having a Radio.Score ≥ 9) are shown in Table 4.
 |
Table 3 Simplified Random Forest Rules That Improved Radio.Score Performance of the Severe Class, Combining It with the Most Important Variables Selected by Random Forest Classifiers. Patients with a Radio.Score ≥ 9 are Considered in the Severe Class |
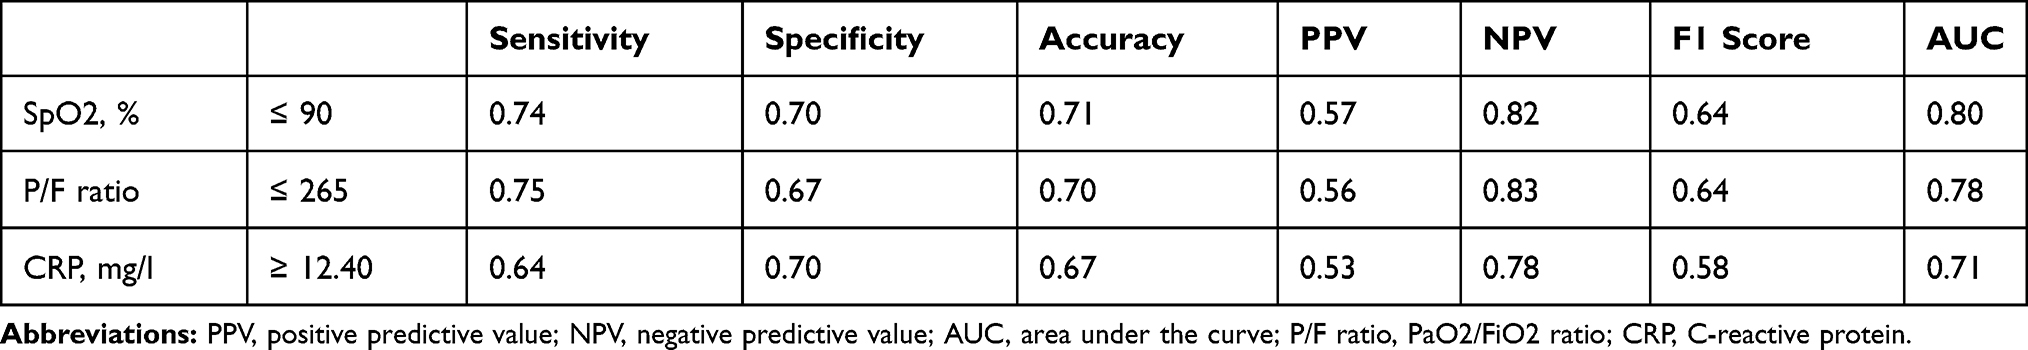 |
Table 4 Best Thresholds of the Variables That Individually Improved Radio.Score Performance in Recognizing Patients in the Severe Class (Radio.Score ≥ 9), with Their Performance |
Discussion
Interest has grown in CXR due to its evolving role in the fight against COVID-19.4,33 In some countries such as UK, Italy, and Spain, CXR has been preferred to CT as the initial imaging modality to confirm or reinforce the suspicion of a COVID-19 pneumonia,4,34,35 but it has also demonstrated a role as a predictive score for COVID-19 diagnosis36 and outcome.8–11 Our study has explored the value of initial CXR in predicting the outcome of patients with COVID-19 in the ED setting.
Even if CT is more sensitive than CXR in detecting early COVID-19 pulmonary changes, CXR has the clear advantage of being easily available, even in medical settings with limited resources and a lack of RT-PCR kits. Furthermore, the use of a portable CXR unit dedicated to COVID-19 suspected patients has reduced the in-hospital transmission. Avoiding COVID-19 patient transfers,37 CXR could contribute to reducing the cross-contamination risk, preventing the in-hospital exposure to a yet undiagnosed SARS-CoV-2 positive patient.38
For the CXR scoring system, our study has focused on three main radiological findings (reticular interstitial thickening, ground glass opacity and consolidation), previously described by other authors, who used part of these patterns for developing a CXR score.33,39–41 The hallmark of COVID-19 is the bilateral presence of patchy ground glass opacities that may coalesce into dense, consolidative lesions, with a predominantly peripheral distribution.41 A reticular interstitial thickening pattern is the third most common finding in COVID-19 after ground glass opacities and consolidations.42
There was a substantial agreement between the scores assigned by the two radiologists (kappa=0.76). The Radio.Score was considered significant by AI software to stratify the outcome of COVID-19 patients. A Radio.Score ≥ 9 has demonstrated its role in predicting a severe class (patients who were intubated or died) with a sensitivity of 67%. Wong et al have reported a sensitivity of 69% regarding CXR in detecting abnormal findings at baseline, which is comparable to our results.4
With the support of a dedicated AI software, this study has also evaluated and integrated anamnestic, clinical and biochemical findings at admission in order to increase the performance of qualitative CXR evaluation in predicting COVID-19 patient outcome. A relationship between COVID-19 patient outcome and chest image data associated with other variables has been noted previously. Borghesi et al in the risk stratification of COVID-19 patients, using a CXR scoring system, considered only comorbidities, age and sex.9 Toussie et al, who assessed clinical and CXR features, made a range of age selection between 18 and 51, with a median age of 39 years.8 No age selection has been performed in our study, which obtained a median age of 61 years, to prevent excluding patients with a bad outcome, such as elderly patients. Liang et al proposed a clinical risk score, which considered both CXR and CT images, but the authors did not explain how they judged imaging and if they used a score, making its clinical application difficult.10 Furthermore, unlike the aforementioned studies, in this paper, an AI-based algorithm was used to select the most significant clinical and laboratory variables and to obtain rules that improved the qualitative CXR scoring system, to elevate its usefulness.
Schalekamp et al showed the usefulness of CXR in developing a risk model to predict critical illness in COVID 19 patients, using AI. In contrast, our score was focused on qualitative CXR pattern evaluation.11 They did not include oxygenation levels at admission, which in our study have been an important parameter. Then, their study population was different as it consisted exclusively of patients with severe disease who required hospital admission, so they had a large proportion of patients who developed a critical illness.
Regarding COVID-19 patients considered in the severe class by Radio.Score, Random Forest classifiers retrieved some clinical and laboratory risk factors able to improve CXR performance. The variables considered as most important were two clinical variables (P/F ratio and SpO2) and three laboratory test results (CRP, lymphocytes [%], hemoglobin [g/dl]). Combining these variables, the rules computed by Random Forest achieved a sensitivity of 0.80 and an accuracy of 0.84. Regarding thresholds, only two clinical variables (P/F ratio and SpO2) and one laboratory test result (CRP) were able to individually improve the performance of Radio.Score on their own. As reported by Levy et al,43 our study has shown that oxygen parameters are important variables, associated with poor prognosis. Warren et al44 have demonstrated, in acute respiratory distress syndrome (ARDS), that a higher CXR severity score was independently associated with a lower P/F ratio and a worse survival. In Covid-19 patients, a significant correlation was found between CT findings and P/F ratio45 and Pan et al46 showed that SpO2 ≤ 89% was an independent risk factor of death.
In some studies, CRP levels were identified as a marker of severity disease, correlated with intensive care unit (ICU) admission.36,47 Furthermore, an association between CRP levels and extension of pulmonary involvement has been reported.48
Patients with severe and fatal diseases had significantly decreased lymphocyte counts compared to non-severe diseases and survivors.49–51 Yamasaki et al have demonstrated lymphocyte count as a predictor of progression to severe COVID-19.52
A recent review53 concluded that several studies proposing models for predicting diagnosis and prognosis of COVID-19 patients, even with the help of AI, were poorly reported, at high risk of bias, and that the reported performance was optimistic. Our study pursued the development of a rigorous risk prediction model by avoiding the weaknesses cited in the review. Each of the relevant steps of the algorithm was critically designed and tested, by comparing the different state-of-the-art AI explainable techniques, to choose the most suited.
Nevertheless, our research has some limitations. First, it is an observational and retrospective study. Second, LDH levels, described in the literature to be associated with a poor outcome and a higher severity of COVID-19 patients,50,54 were not included in the evaluation because these data were not present in at least 50% of the patients of our sample. Third, Radio.Score requires validation and an evaluation of its reproducibility also by other hospitals and by radiologists with different expertise. It was not the scope of our study to compare Radio.Score with the CXR scores of other authors for COVID-19 outcome, but it would be interesting to see the results of these scores applied to our samples, to verify if the entire method would need recalibration. Fourth, the sensitivity of Radio.Score could have been influenced by the image quality, especially regarding CXRs obtained at bedsides, due to the superposition of soft tissues.55 This research may be a precursor study of interventional trials that prospectively assess the role of CXR in the outcome of Covid-19 patients.
Our tool could also be implemented, in future studies, with an automated software for the evaluation of the CXRs, reducing radiologist role, improving the reproducibility of the scores, but to do that, thousands of CXRs are necessary.
Conclusion
Radio.Score, the mean value of the radiological scoring system assigned by the two radiologists who read the CXRs, was considered a reliable tool by AI in the evaluation of COVID-19 patients and it could guide radiologists in CXR reports. AI methods have demonstrated that Radio.Score, especially if combined with clinical and laboratory features, has a relevant role in predicting COVID-19 patients’ outcome.
Abbreviations
SpO2, oxygen saturation; P/F ratio, the ratio of arterial oxygen partial pressure to fractional inspired oxygen; CRP, C-reactive protein; RT-PCR, reverse transcriptase-polymerase chain reaction; CXR, chest radiograph; CT, computed tomography; ED, emergency department; AI, Artificial Intelligence; BMI, body mass index; SRQ, superior right quadrant; MRQ, middle right quadrant; IRQ, inferior right quadrant; SLQ, superior left quadrant; MLQ, middle left quadrant; ILQ, inferior left quadrant; 10-fold CV, 10-fold cross-validation.
Funding
This research did not receive any specific grant from funding agencies in the public, commercial, or not-for-profit sectors.
Disclosure
The authors report no conflicts of interest for this work.
References
1. Huang C, Wang Y, Li X, et al. Clinical features of patients infected with 2019 novel coronavirus in Wuhan, China. Lancet. 2020;395(10223):497–506. doi:10.1016/S0140-6736(20)30183-5
2. Dong E, Du H, Gardner L, et al. An interactive web-based dashboard to track COVID-19 in real time. Lancet Infect Dis. 2020;20(5):533–534. doi:10.1016/S1473-3099(20)30120-1
3. Rubin GD, Ryerson CJ, Haramati LB, et al. The role of chest imaging in patient management during the COVID-19 pandemic: a multinational consensus statement from the Fleischner Society. Radiology. 2020;296(1):201365. doi:10.1148/radiol.2020201365
4. Wong HYF, Lam HYS, Fong AH, et al. Frequency and distribution of chest radiographic findings in COVID-19 positive patients [published online ahead of print March 27, 2019]. Radiology. 2019:201160. doi:10.1148/radiol.2020201160.
5. Kim H, Hong H, Yoon SH. Diagnostic performance of CT and reverse transcriptase polymerase chain reaction for coronavirus disease 2019: a meta-analysis. Radiology. 2020;296:E145–E155. doi:10.1148/radiol.2020201343
6. Chan JF, Yip CC, To KK, et al. Improved molecular diagnosis of COVID-19 by the novel, highly sensitive and specific COVID-19-RdRp/Hel real-time reverse transcription-polymerase chain reaction assay validated in vitro and with clinical specimens. J Clin Microbiol. 2020;58(5):e00310–20. doi:10.1128/JCM.00310-20
7. Joseph NP, Reid NJ, Som A, et al. Racial/ethnic disparities in disease severity on admission chest radiographs among patients admitted with confirmed COVID-19: a retrospective cohort study. Radiology. 2020;16:202602. doi:10.1148/radiol.2020202602.
8. Toussie D, Voutsinas N, Finkelstein M, et al. Clinical and chest radiography features determine patient outcomes in young and middle age adults with COVID-19. Radiology. 2020;297(1):E197–E206. doi:10.1148/radiol.2020201754.
9. Borghesi A, Zigliani A, Golemi S, et al. Chest X-ray severity index as a predictor of in-hospital mortality in coronavirus disease 2019: a study of 302 patients from Italy. Int J Infect Dis. 2020;96:291–293. doi:10.1016/j.ijid.2020.05.021.
10. Liang W, Liang H, Ou L, et al. Development and validation of a clinical risk score to predict the occurrence of critical illness in hospitalized patients with COVID-19. JAMA Intern Med. 2020;180(8):1081–1089. doi:10.1001/jamainternmed.2020.2033.
11. Schalekamp S, Huisman M, van Dijk RA, et al. Model-based prediction of critical illness in hospitalized patients with COVID-19. Radiology. 2020. doi:10.1148/radiol.2020202723.
12. Neri E, Miele V, Coppola F, et al. Use of CT and artificial intelligence in suspected or COVID-19 positive patients: statement of the Italian Society of Medical and Interventional Radiology. Radiol Med. 2020;125(5):505–508. doi:10.1007/s11547-020-01197-9.
13. Wong A, Qiu Lin Z, Wang L, et al. Towards computer-aided severity assessment: training and validation of deep neural networks for geographic extent and opacity extent scoring of chest X-rays for SARS-CoV-2 lung disease severity; 2020. Available from: https://arxiv.org/abs/2005.12855.
14. Iwendi C, Bashir AK, Peshkar A, et al. COVID-19 patient health prediction using boosted random forest algorithm. Front Public Health. 2020. doi:10.3389/fpubh.2020.00357.
15. Kwon JM, Kim KH, Jeon KH, et al. Artificial intelligence algorithm for predicting mortality of patients with acute heart failure. PLoS One. 2019;14(7):e0219302. doi:10.1371/journal.pone.0219302.
16. Li MD, Arun NT, Gidwani M, et al. Automated assessment and tracking of COVID-19 pulmonary disease severity on chest radiographs using convolutional siamese neural networks. Radiol Artif Intell. 2020;2(4):e200079. doi:10.1148/ryai.2020200079.
17. McHugh ML. Interrater reliability: the kappa statistic. Biochem Med. 2012;22(3):276–282. doi:10.11613/bm.2012.031.
18. Landis JR, Koch GG. The measurement of observer agreement for categorical data. Biometrics. 1977;33(1):159–174. PMID 843571. doi:10.2307/2529310
19. Van Buuren S, Groothuis-Oudshoorn K. MICE: multivariate imputation by chained equations in R. J Stat Softw. 2011;45(3):1–67. doi:10.18637/jss.v045.i03.
20. Little RJA. Missing-data adjustments in large surveys. J Bus Econ Stat. 1988;6(3):287–296. doi:10.2307/1391878.
21. Stekhoven DJ, Bühlmann P. MissForest—non-parametric missing value imputation for mixed-type data. Bioinformatics. 2012;28:112–118. doi:10.1093/bioinformatics/btr597
22. Cappelletti L, Fontana T, Di Donato GW, et al. Complex data imputation by auto-encoders and convolutional neural networks—a case study on genome gap-filling. Computers. 2020;9(2):37. doi:10.3390/computers9020037.
23. Strobl C, Boulesteix A-L, Zeileis A, Hothorn T. Bias in random forest variable importance measures: illustrations, sources and a solution. BMC Bioinform. 2007;8:25. doi:10.1186/1471-2105-8-25
24. Casiraghi E, Malchiodi D, Trucco G, et al. Explainable machine learning for early assessment of COVID-19 risk prediction in emergency departments. IEEE Access. 2020;8:196299–196325. doi:10.1109/ACCESS.2020.3034032.
25. Ambroise C, McLachlan CJ. Selection bias in gene extraction on the basis of microarray gene-expression data. Proc Natl Acad Sci. 2002;99(10):6562–6566. doi:10.1073/pnas.102102699
26. Altmann A, Toloşi L, Sander O, Lengauer T. Permutation importance: a corrected feature importance measure. Bioinformatics. 2010;26:1340–1347. doi:10.1093/bioinformatics/btq134
27. Kursa MB, Rudnicki WR. Feature selection with the Boruta package. J Stat Softw. 2010;36:1–13. doi:10.18637/jss.v036.i11
28. Chang JM, Zeng H, Han R, et al. Autism risk classification using placental chorionic surface vascular network features. BMC Med Inform Decis Mak. 2017;17(1):162. doi:10.1186/s12911-017-0564-8
29. Kursa MB, Jankowski A, Rudnicki W. Boruta - a system for feature selection. Fundam Inform. 2010;101:271–285. doi:10.3233/FI-2010-288
30. Deng H Interpreting tree ensembles with inTrees, in CoRR, 1408.5456; 2014. Available from: http://arxiv.org/abs/1408.5456.
31. Deng H, Runger G, Tuv E, Bannister W. Cbc: an associative classifier with a small number of rules. Decis Support Syst. 2014;59:163–170. doi:10.1016/j.dss.2013.11.004
32. R Development Core Team R: a language and environment for statistical computing. R Foundation for Statistical Computing. Vienna, Austria. ISBN 3-900051-07-0; 2012. Available from: http://www.R-project.org/.
33. Wong H, Lam H, Fong A, et al. Portable chest X-ray in coronavirus disease-19 (COVID-19): a pictorial review. Clin Imaging. 2020;64:35–42. ISSN: 0899–7071. doi:10.1016/j.clinimag.2020.04.001
34. Sánchez-Oro R, Torres Nuez J, Martínez-Sanz G. Radiological findings for diagnosis of SARS-CoV-2 pneumonia (COVID-19). Med Clin. 2020;155(1):36–40. doi:10.1016/j.medcle.2020.03.004
35. Tsakok M, Shaw R, Murchison A, et al. Diagnostic accuracy of initial chest radiograph compared to SARS-CoV-2 PCR in patients with suspected COVID-19. BJR Open. 2020;2(1). doi:10.1259/bjro.20200034
36. Vieceli T, de Oliveira Filho CM, Berger M, et al. A predictive score for COVID-19 diagnosis using clinical, laboratory and chest image data. Braz J Infect Dis. 2020;24(4):343–348. doi:10.1016/j.bjid.2020.06.009
37. Wu G, Li X. Mobile X-rays are highly valuable for critically ill COVID patients. Eur Radiol. 2020;30(9):5217–5219. doi:10.1007/s00330-020-06918-2
38. Dennie C, Hague C, Lim RS, et al. Canadian Society of Thoracic Radiology/Canadian Association of Radiologists Consensus Statement Regarding Chest Imaging in Suspected and Confirmed COVID-19. Can Assoc Radiol J. 2020;71(4):470–481. doi:10.1177/0846537120924606
39. Yu Q, Wang Y, Huang S, et al. Multicenter cohort study demonstrates more consolidation in upper lungs on initial CT increases the risk of adverse clinical outcome in COVID-19 patients. Theranostics. 2020;10(12):5641–5648. doi:10.7150/thno.46465
40. Borghesi A, Maroldi R. COVID-19 outbreak in Italy: experimental chest X-ray scoring system for quantifying and monitoring disease progression. Radiol Med. 2020;125(5):509–513. doi:10.1007/s11547-020-01200-3
41. Ye Z, Zhang Y, Wang Y, Huang Z, Song B. Chest CT manifestations of new coronavirus disease 2019 (COVID-19): a pictorial review. Eur Radiol. 2020;30(8):4381–4389. doi:10.1007/s00330-020-06801-0
42. Wu J, Wu X, Zeng W, et al. Chest CT findings in patients with coronavirus disease 2019 and its relationship with clinical features. Invest Radiol. 2020;55(5):257–261. doi:10.1097/RLI.0000000000000670
43. Levy TJ, Richardson S, Coppa K, et al. Development and validation of a survival calculator for hospitalized patients with COVID-19. medRxiv Prepr Serv Health Sci. 2020. doi:10.1101/2020.04.22.20075416
44. Warren MA, Zhao Z, Koyama T, et al. Severity scoring of lung oedema on the chest radiograph is associated with clinical outcomes in ARDS. Thorax. 2018;73(9):840–846. doi:10.1136/thoraxjnl-2017-211280
45. Gaia C, Maria Chiara C, Silvia L, et al. Chest CT for early detection and management of coronavirus disease (COVID-19): a report of 314 patients admitted to Emergency Department with suspected pneumonia. Radiol Med. 2020;125(10):931–942. doi:10.1007/s11547-020-01256-1
46. Pan F, Yang L, Li Y, et al. Factors associated with death outcome in patients with severe coronavirus disease-19 (COVID-19): a case-control study. Int J Med Sci. 2020;17(9):1281–1292. doi:10.7150/ijms.46614
47. Guan W, Ni Z, Hu Y, et al. Clinical characteristics of coronavirus disease 2019 in China. N Engl J Med. 2020;382(18):1708–1720. doi:10.1056/NEJMoa2002032
48. Wang L. C-reactive protein levels in the early stage of COVID-19. Med Mal Infect. 2020;50(4):332–334. doi:10.1016/j.medmal.2020.03.007
49. Henry BM, de Oliveira MHS, Benoit S, Plebani M, Lippi G. Hematologic, biochemical and immune biomarker abnormalities associated with severe illness and mortality in coronavirus disease 2019 (COVID-19): a meta-analysis. Clin Chem Lab Med. 2020;58(7):1021–1028. doi:10.1515/cclm-2020-0369
50. Han Y, Zhang H, Mu S, et al. Lactate dehydrogenase, an independent risk factor of severe COVID-19 patients: a retrospective and observational study. Aging. 2020;12(12):11245–11258. doi:10.18632/aging.103372
51. Wagner J, DuPont A, Larson S, Cash B, Farooq A. Absolute lymphocyte count is a prognostic marker in Covid-19: a retrospective cohort review. Int J Lab Hematol. 2020;42(6):761–765. doi:10.1111/ijlh.13288
52. Yamasaki Y, Ooka S, Tsuchida T, et al. The peripheral lymphocyte count as a predictor of severe COVID-19 and the effect of treatment with ciclesonide. Virus Res. 2020;290:198089. doi:10.1016/j.virusres.2020.198089
53. Wynants L, Van Calster B, Collins GS, et al. Prediction models for diagnosis and prognosis of covid-19: systematic review and critical appraisal. BMJ. 2020:m1328. doi:10.1136/bmj.m1328.
54. Gatti M, Calandri M, Barba M, et al. Baseline chest X-ray in coronavirus disease 19 (COVID-19) patients: association with clinical and laboratory data. Radiol Med. 2020;125(12):1271–1279. doi:10.1007/s11547-020-01272-1
55. Eisenhuber E, Schaefer-Prokop CM, Prosch H, Schima W. Bedside chest radiography. Respir Care. 2012;57(3):427–443. doi:10.4187/respcare.01712
 © 2021 The Author(s). This work is published and licensed by Dove Medical Press Limited. The
full terms of this license are available at https://www.dovepress.com/terms
and incorporate the Creative Commons Attribution
- Non Commercial (unported, 3.0) License.
By accessing the work you hereby accept the Terms. Non-commercial uses of the work are permitted
without any further permission from Dove Medical Press Limited, provided the work is properly
attributed. For permission for commercial use of this work, please see paragraphs 4.2 and 5 of our Terms.
© 2021 The Author(s). This work is published and licensed by Dove Medical Press Limited. The
full terms of this license are available at https://www.dovepress.com/terms
and incorporate the Creative Commons Attribution
- Non Commercial (unported, 3.0) License.
By accessing the work you hereby accept the Terms. Non-commercial uses of the work are permitted
without any further permission from Dove Medical Press Limited, provided the work is properly
attributed. For permission for commercial use of this work, please see paragraphs 4.2 and 5 of our Terms.