Back to Journals » International Journal of Nanomedicine » Volume 10 » Issue 1
Anti-hyperglycemic activity of selenium nanoparticles in streptozotocin-induced diabetic rats
Authors Al-Quraishy S, Dkhil M ![]() , Moneim A
, Moneim A ![]()
Received 29 June 2015
Accepted for publication 12 September 2015
Published 29 October 2015 Volume 2015:10(1) Pages 6741—6756
DOI https://doi.org/10.2147/IJN.S91377
Checked for plagiarism Yes
Review by Single anonymous peer review
Peer reviewer comments 2
Editor who approved publication: Dr Thomas Webster
Saleh Al-Quraishy,1 Mohamed A Dkhil,1,2 Ahmed Esmat Abdel Moneim2
1Department of Zoology, College of Science, King Saud University, Riyadh, Saudi Arabia; 2Department of Zoology and Entomology, Faculty of Science, Helwan University, Cairo, Egypt
Abstract: The study was designed to investigate the anti-hyperglycemic activity of selenium nanoparticles (SeNPs) in streptozotocin-induced diabetic rats. Fifty-five mg/kg of streptozotocin was injected in rats to induce diabetes. Animals either treated with SeNPs alone or with insulin (6 U/kg) showed significantly decreased fasting blood glucose levels after 28 days of treatment. The serum insulin concentration in untreated diabetic animals was also enhanced by SeNPs. The results demonstrated that SeNPs could significantly decrease hepatic and renal function markers, total lipid, total cholesterol, triglyceride and low-density lipoprotein cholesterol levels, and glucose-6-phosphatase activity. At the same time, SeNPs increased malic enzyme, hexokinase and glucose-6-phosphate dehydrogenase activity, liver and kidney glycogen contents, and high-density lipoprotein cholesterol levels. In addition, SeNPs were able to prevent the histological injury in the hepatic and renal tissues of rats. However, insulin injection also exhibited a significant improvement in diabetic animals after 28 days of treatment. This study suggests that SeNPs can alleviate hyperglycemia and hyperlipidemia in streptozotocin-induced diabetic rats, possibly by eliciting insulin-mimetic activity.
Keywords: diabetes, selenium, liver, kidney, toxicity
Introduction
Diabetes mellitus (DM) is a chronic progressive metabolic disorder and a multifactorial disease associated with many pathological alterations including microvascular and macrovascular complications that affect almost every part of the body.1 The International Diabetes Federation have recently indicated that 8.3% of adults worldwide (387 million people) have diabetes and the same organization predicts that by 2035 this figure will rise to nearly 600 million people.2 Observational evidence from experimental and clinical studies indicates that oxidative stress is involved in both the pathogenesis and the complications of DM.3,4 Based on observations of the beneficial effects of overexpression of antioxidant enzymes in transgenic mouse models, catalytic antioxidants such as the family of superoxide dismutase/catalase mimetic compounds are the most logical choice for preventing diabetes-induced reactive oxygen species.4
Streptozotocin (STZ) is well known for its selective destruction of pancreatic β-cells in islets of Langerhans, resulting in insulin deficiency and hyperglycemia and has been extensively used in animals as a model to study the pathology and complications of DM, and the effectiveness of potential interventions.1 STZ induces diabetes by inducing rapid and irreversible necrosis in β-cells, but the induction of both type 1 and 2 diabetes is dependent on the dose of STZ and the animal and species used.5
Elemental selenium (Se) nanoparticles (SeNPs) have received great attention because of their unique biological activities and low toxicity.6 These SeNPs also exhibit high biological activity and good absorptive ability due to the interaction between –NH2, C=O, -COO, and –C–N– groups of proteins and the nanoparticles of Se.7 Se is an essential element for humans and can enhance the activities of the selenoenzymes and antioxidant enzymes, such as glutathione peroxidase (GPx), while also protecting cells and tissues from damage by free radicals in vivo. Its interaction with GPx is particularly important and well-understood, since GPx is known to play a significant role in scavenging various peroxides and protecting membrane lipids and macromolecules from oxidative damage.8,9 In the human diet, Se is particularly associated with the immune system, helping to enhance the immune response in both the innate and acquired immune systems.10 It also stimulates cell cycle progression and prevents cell death.6 Furthermore, McNeill et al11 demonstrated that Se like vanadium appeared to have insulin-like effects when administered in rats and markedly stimulated glucose transport and insulin-sensitive cyclic adenosine monophosphate phosphodiesterase when incubated with rat adipocytes.12
In this study, we designed new therapeutic strategies for DM which combined SeNPs with insulin in order to investigate whether SeNPs can show antidiabetic activity, or even improve the therapeutic effect in vivo. The results obtained have the potential to provide a new type of adjuvant agent for antidiabetic treatment. In addition, we investigated the effect of SeNPs on diabetes-related lesions and on oxidative damage in the hepatic and renal tissues of STZ-diabetic rats.
Materials and methods
Preparation and characterization of SeNPs
SeNPs were purchased from the Institute of High Energy Physics, Beijing, People’s Republic of China by Prof Dr Xueyun Gao. In brief, a suspension of red amorphous SeNPs was synthesized by the reduction of sodium selenite with glutathione in the presence of bovine serum albumin (BSA). This suspension was diluted ten times with deionized water and a drop of the suspension was applied to a formvar-coated copper grid. A Philips CM100 transmission electron microscope (TEM) (FEI, Eindhoven, the Netherlands), operating at 80 kV accelerating voltage was then used to image the size and shape of the SeNPs.13
Animals
Adult male albino rats of the Wistar strain weighing 110–140 g were obtained from the Holding Company for Biological Products and Vaccines (VACSERA, Cairo, Egypt). After acclimatizing for 7 days, the animals were divided into seven groups (with seven rats per group) and housed in wire-bottomed cages in a room kept at 25°C±1°C and under a 12 hour light/12 hour dark cycle. The rats were provided with water and a standard diet ad libitum. The experiment abided by the standards of animal care set out in Egypt and in the European Community Directive (86/609/EEC) and the National Institutes of Health Guidelines for the Care and Use of Laboratory Animals, 8th edition. This study was approved by the Ethical Committee of Zoology and Entomology department, Helwan University, Cairo, Egypt.
Experimental induction of diabetes
Rats were fasted for 18–24 hours. STZ was freshly prepared in a 0.05 M citrate buffer, pH 4.5, and a single intraperitoneal injection of 55 mg/kg (Sigma, St Louis, MO, USA) was used to induce diabetes in each rat, as described previously.14 Blood glucose level was monitored every 3 days using an Accu-Chek® blood glucose meter (Roche Diagnostics, Basel, Switzerland). Stable hyperglycemia was established in the rats (denoted by blood glucose levels ≥200 mg/dL [15 mM]) 7 days after the STZ injection. Fourteen rats were injected with a citrate buffer, which served as a control.
Experimental design
One week after the verification of diabetes, four groups of diabetic rats were established in addition to two control groups as described in Figure 1 (with seven rats in each group). An untreated group received a physiological NaCl solution (STZ group). A STZ-SeNPs group consisted of diabetic rats treated with SeNPs at 0.1 mg of SeNPs/kg administered orally.13 A STZ-insulin (Ins) group consisted of diabetic rats treated with standard drug insulin (6 U/kg, subcutaneous [sc] administration). Finally, a STZ-SeNPs-Ins group consisted of diabetic rats treated with SeNPs and the standard drug insulin. Additionally, the 14 normal rats, which had received the citrate buffer injection as a control, were now divided into two equal groups, with one being administered a physiological NaCl solution (Control ‘Con’ group) and the other daily administered with SeNPs (0.1 mg/kg, oral administration) (SeNPs group).
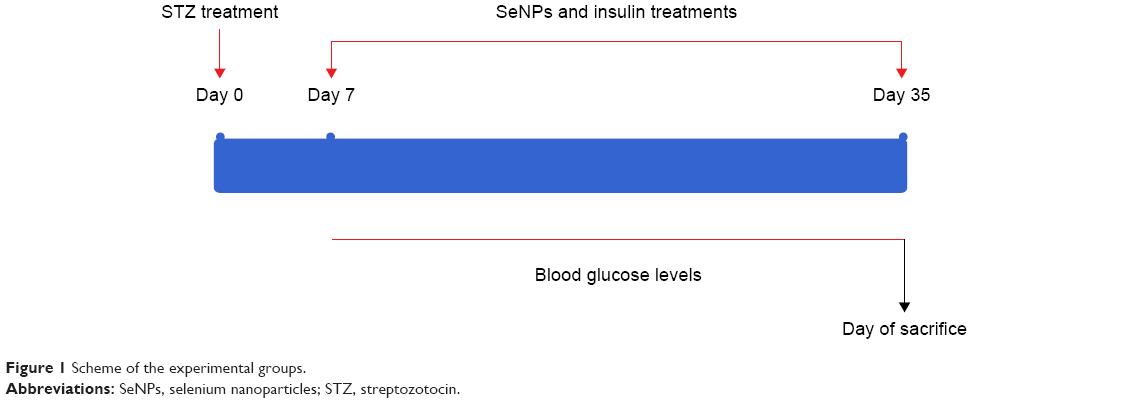 | Figure 1 Scheme of the experimental groups. |
After 28 days of daily administration, overnight fasting animals were euthanized with mild ether anesthesia. Blood was collected from the abdominal aorta, using a syringe puncture, and the serum was isolated. The liver, kidney, and pancreas were promptly excised, washed in chilled saline, blotted, and processed for biochemical and histological investigations. All the animals were weighed both prior to the treatment and prior to sacrifice.
Preparation of tissue homogenate
A known weight of liver and kidney tissues was homogenized in a 50 mM Tris–HCl buffer, pH 7.4 at 4°C. The homogenates were centrifuged at 3,000× g for 10 minutes at 4°C. The total protein content of the homogenized sample was determined using the method by Lowry et al15 with BSA acting as a standard.
Se concentration
The Se concentration in the liver, kidney, and intestine were determined using the standard method. In brief, a mixture of nitric acid, perchloric acid, and sulfuric acid in a ratio of 6:1:1 was used to dissolve the tissues. Se concentration was then measured by means of atomic spectrophotometry at 196.0 nm (Perkin-Elmer model 5000, PerkinElmer Inc., Waltham, MA, USA). The estimated limit of Se detection by this method was 0.002 mg/L.
Glucose and insulin levels
Blood glucose level was determined by the glucose oxidase method.16 Blood serum insulin concentrations were measured by an enzymatic immunoassay method (ELISA ALPCO insulin rat).
Liver and kidney functions and lipid profile tests
The presence of transaminases (alanine aminotransferase [ALT] and aspartate aminotransferase [AST]) in blood serum was estimated by measuring the amount of pyruvate or oxaloacetate produced by forming 2,4-dinitrophenylhydrazine according to the method of Reitman and Frankel,17 the color of which was measured spectrophotometrically at 546 nm. Belfield and Goldberg’s method was used to assay levels of alkaline phosphatase (ALP), making use of kits provided by Randox Laboratories Co. (Crumlin, Antrim, UK),18 Schmidt and Eisenburg’s method was employed to determine the total bilirubin in serum.19 Serum uric acid, urea and creatinine, total lipid, triacylglycerols, total cholesterol, and high-density lipoprotein cholesterol (HDLc) contents were determined with commercially available diagnostic kits (Biodiagnostic, Cairo, Egypt) as per the manufacturer’s instructions.
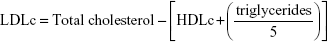
Low-density lipoprotein cholesterol (LDLc) was calculated using the following formula:
|
Biochemical assay of GPx
Paglia and Valentine’s method was used to determine whether or not Se affects the activity of GPx.20 In this method, 900 μL of GPx assay buffer (consisting of 50 mM potassium phosphate buffer pH 8.0, 0.5 mM ethylenediaminetetraacetic acid), 50 μL of nicotinamide adenine dinucleotide phosphate (NADPH) assay reagent (5 mM NADPH, 42 mM reduced glutathione, and 10 units/mL glutathione reductase) and 50 μL of the sample homogenate supernatant were mixed by inversion in a spectrophotometer cuvette. The reaction was then initiated by the addition of hydrogen peroxide, provoking the oxidation of NADPH to NADP+, which is accompanied by a decrease in absorbance at 340 nm.
Biochemical assay of glycogen
Glycogen analysis was performed following the anthrone method as previously described.21 In this method, 0.5 g of wet weight from liver or kidney tissues was isolated and boiled in a 1.5 mL solution of 30% KOH for 20 minutes until the tissue was completely dissolved. Subsequently, the samples were centrifuged, and 2.0 mL 95% ethanol solution and 0.25 mL of saturated Na2SO4 were added to the tube after cooling. The precipitate resulting from centrifuging the sample was resuspended in distilled water and boiled in 0.2% anthrone reagent, and the absorbance at 620 nm was measured after cooling. Glycogen (Sigma) was used for the glycogen standard curve. The glycogen content was expressed per gram wet weight of tissue.
Biochemical assay of hexokinase
Hexokinase (HK) activity in liver and kidney tissues was determined spectrophotometrically.22 Briefly, the assay mixture contained 3.7 mM glucose, 7.5 mM MgCl2, 11 mM thioglycerol, and 45 mM HEPES (4-(2-hydroxyethyl)-1-piperazineethanesulfonic acid) buffer; 0.9 mL of this mixture and 0.03 mL of 0.22 M adenosine triphosphate was mixed well in a cuvette; 0.1 mL of the tissue supernatant was then added into the cuvette and absorbance noted at 340 nm. One unit of HK was expressed as unit/mg protein.
Biochemical assay of glucose-6-phosphate dehydrogenase
The glucose-6-phosphate dehydrogenase (G6PD) activity in the liver and kidney samples was measured spectrophotometrically at 340 nm, using glucose-6-phosphate as a substrate.23 One unit of enzyme activity is defined as the quantity that catalyzes the reduction of 1 μM of glucose-6-phosphate per minute.
Biochemical assay of glucose-6-phosphatase activity
Glucose-6-phosphatase activity in the liver and kidney samples were measured according to the standard protocol;24 0.1 mL of 0.1 M glucose-6-phosphate solution and 0.3 mL of 0.5 M maleic acid buffer (pH 6.5) were combined in a calibrated centrifuge tube, and incubated in a 37°C water bath for 15 minutes. The reaction was stopped by the addition of 1 mL of 10% trichloroacetic acid. The mixture was then chilled in ice and centrifuged at 3,000× g for 10 minutes. The absorbance at 340 nm was recorded and enzyme activity was expressed as mg of inorganic phosphate (K2HPO4) liberated/mg protein.
Real-time polymerase chain reaction
Total RNA was isolated from the liver and kidney tissues using an RNeasy Plus Minikit (Qiagen, Valencia, CA, USA). cDNA synthesis was undertaken using the RevertAid™ H Minus Reverse Transcriptase (Fermentas, Thermo Fisher Scientific Inc., MA, USA) with 1 μg total RNA and random primers. The cDNA samples were run in triplicate for real-time polymerase chain reaction (PCR) analysis. β-Actin (accession number: NM_031144.3; 5′-GGCATCCTGACCCTGAAGTA-3′; antisense: 5′-GGGGTGTTGAAGGTCTCAAA-3′) was used as the reference gene. Real-time PCR reactions were performed using Power SYBR® Green (Life Technologies, Carlsbad, CA, USA) on the Applied Biosystems 7,500 system. The typical thermal profile for the PCR reaction was 95°C for 4 minutes, followed by 40 cycles of 94°C for 60 seconds and 55°C for 60 seconds. For relative quantitation of gene expression, the log 2 of 2−ΔΔCt was used based on the method of Pfaffl,25 where ΔCt was calculated by subtracting the β-actin cycle threshold value (Ct) from each of the target gene Ct. The ΔΔCt value was then calculated from subtraction of the resultant ΔCt values from the mean ΔCt value of the control. The PCR primers for the following genes were synthesized by Jena Bioscience GmbH (Jena, Germany): glucokinase (GK; accession number: NM_001270850.1; sense: 5′-GTGGTGCTTTTGAGACCCGTT-3′; antisense: 5′-TTCGATGAAGGTGATTTCGCA-3′), HK (accession number: NM_012734.1; sense: 5′-AGGGGGATTTCATTGCCCTG-3′; antisense: 5′-TCTTCTCGTGGTTCACCTGC-3′), G6PD (accession number: NM_017006.2; sense: 5′-GTATGTGGGGAACCCCAGTG-3′; antisense: 5′-AGGGACAGACTGATAGGCGT-3′), pyruvate kinase (PK; accession number: NM_012624.3; sense: 5′-CCTCTGCCTTCTGGATACTGACT-3′; antisense: 5′-GCAAGACTCCGGTTCGTATCT-3′), fatty acid synthase (accession number: NM_017332.1; sense: 5′-GCTTGGTGAACTGTCTCCGA-3′; antisense: 5′-GGGTCCAGCTAGAGGGTACA-3′), lipoprotein lipase (accession number: NM_012598.2; sense: 5′-CCAGCTGGGCCTAACTTTGA-3′; antisense: 5′-AACTCAGGCAGAGCCCTTTC-3′), phosphoinositide-3-kinase, regulatory subunit 2 (beta) (PIK3R2; accession number: NM_022185.2; sense: 5′-TACCAGCACGCATCACTTGT-3′; antisense: 5′-ATGGCTTGAAGAACTCGGGG-3′), insulin receptor (IR; accession number: XM_006248753.2; sense: 5′-GTTTTTGTTCCCAGGCCATCC-3′; antisense: 5′-AATGCTTCCGGGAGACACAG-3′), and insulin receptor substrate 1 (accession number: NM_012969.1; sense: 5′-CTGCATAATCGGGCAAAGGC-3′; antisense: 5′-CATCGCTAGGAGAACCGGAC-3′). Primers were designed using the Primer-Blast program from the National Center for Biotechnology Information.
Histological investigations
The liver, kidney, and pancreas were washed in saline and fixed in 10% neutral buffered formalin for 24 hours. Ascending grades of ethyl alcohol were then used to dehydrate the samples, and xylene was used as the clearing agent. The samples were then mounted in molten paraplast at 58°C–62°C; 4–5 μm slices were cut from the prepared blocks and stained with hematoxylin and eosin. The preparations were visualized using a Nikon microscope (Eclipse E200-LED, Tokyo, Japan).
Immunohistochemical procedures
Pancreatic tissue samples were fixed in 10% neutral buffered formalin, embedded in paraffin and cut into 5 μm thick sections. Immunocytochemical reactions were performed using the peroxidase/anti-peroxidase method.26 Nonspecific peroxidase reactions were blocked with methanol containing 0.1% H2O2 and the sections were also incubated with normal goat serum to avoid nonspecific reactions with the background once the samples were incubated with the specific antibody against insulin (dilution, 1:2,000; Santa Cruz Biotechnology, Santa Cruz, CA, USA). The sections were then washed with a phosphate-buffered saline (PBS) buffer and incubated with a secondary antibody (goat anti-rabbit IgG, dilution, 1:2,000; Sigma), before being washed in PBS again and, finally, incubated with the peroxidase/anti-peroxidase complex (dilution, 1:200). The peroxidase reaction was carried out using a solution of 3,3′-diaminobenzidine tetrahydrochloride containing 0.01% H2O2 in Tris–HCl buffer (0.05 M, pH 7.6). After immunostaining, the sections were lightly counterstained with hematoxylin and observed under a light microscope.
Statistical analysis
Results were expressed as means ± standard error of the means (SEM). Data were analyzed using one-way analysis of variance. Duncan’s post hoc test was used as a post hoc test to compare significance between groups, using the Statistical Package for the Social Sciences 20 (Version 20, SPSS Inc., Chicago, IL, USA). All figures were drawn using PRISM 6 (Version 6, GraphPad, San Diego, CA, USA).
Results
SeNP characterization
Figure 2 shows the size distribution of the SeNPs in BSA solution determined by dynamic light scattering. Most of the nanoparticles had a diameter between 10 and 80 nm with a maximum size distribution (mean ± one standard deviation) at 19±1 nm. However, a minority were found as micrometer-sized aggregates that could not be dispersed by ultrasound. TEM (Figure 2) confirmed the determined diameter and showed that the particles had a spherical shape.
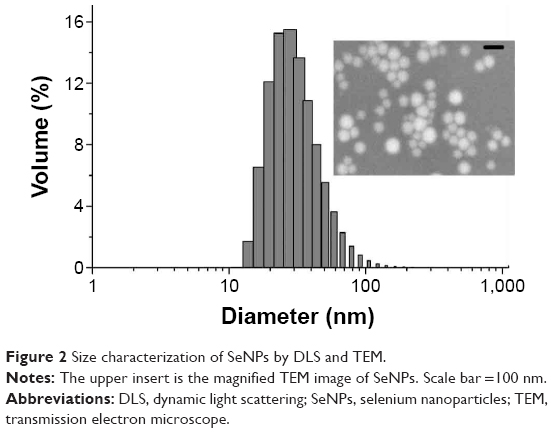 | Figure 2 Size characterization of SeNPs by DLS and TEM. |
Body weight
STZ treatment, the positive treatment control, caused a significant body weight reduction in rats compared with the control rats on day 35 after the injection. Treatment with SeNPs for 28 days, however, significantly (P<0.05) reduced the body weight compared with the control rats observed at 28 days. Moreover, coadministration of SeNPs and insulin injection (6 U/kg, sc) failed to prevent the reduction in body weight and exhibited a significant reduction in body weight of the diabetic animals following 28 days of treatment (Table 1).
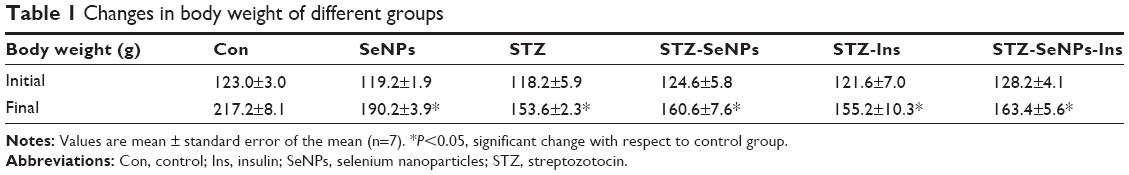 | Table 1 Changes in body weight of different groups |
Se concentrations and GPx activity
Treatment of rats with SeNPs for 28 days significantly increased (P<0.05) the Se content in the liver, kidney, and intestine of the SeNPs, STZ-SeNPs, and STZ-SeNPs-Ins groups. On the other hand, no change in Se content was detected in the STZ group when compared with the control rats (Figure 3A). GPx activity in the liver and kidney tissues of the SeNP-treated groups was markedly increased (Figure 3B), whereas GPx activity in the liver and kidney tissues was significantly inhibited in the STZ-untreated group.
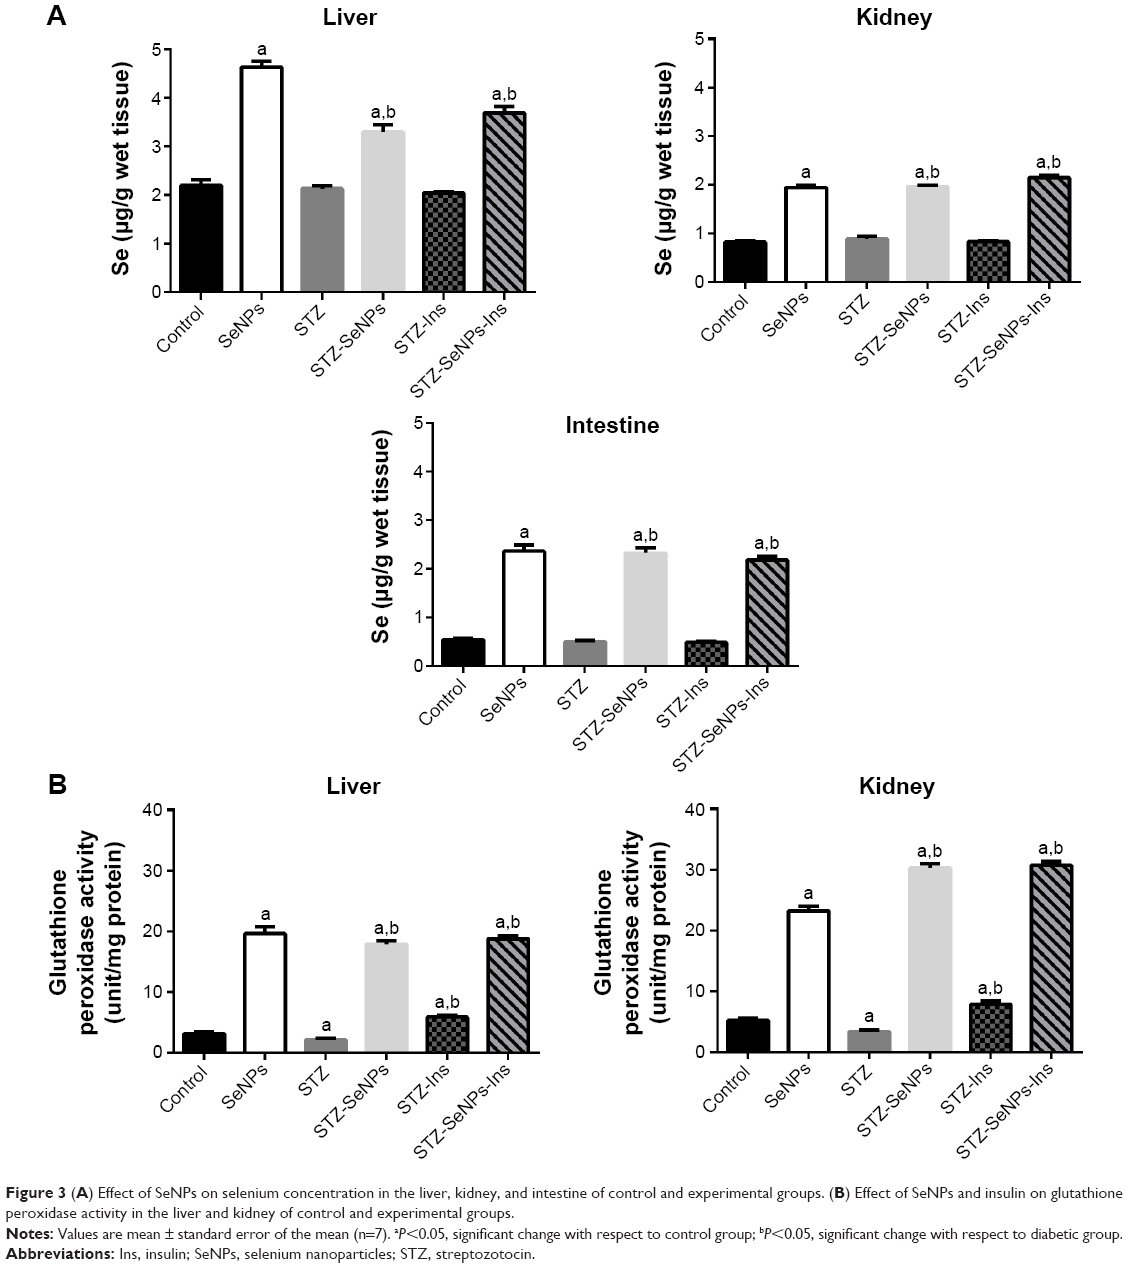 | Figure 3 (A) Effect of SeNPs on selenium concentration in the liver, kidney, and intestine of control and experimental groups. (B) Effect of SeNPs and insulin on glutathione peroxidase activity in the liver and kidney of control and experimental groups. |
Fasting blood glucose level
STZ-induced diabetes resulted in significant elevation (P<0.05) in fasting blood glucose levels (>287 mg/dL) compared with untreated control animals. When diabetic animals were treated with SeNPs for 28 days, a significant reduction (P<0.05) in the fasting blood glucose level was noted compared with the untreated diabetic animals (Figure 4). Indeed, in this case, the blood glucose level returned to the control level after just 18 days of SeNPs treatment. This compares to treatment with standard drug insulin (6 U/kg, sc), which was also associated with a significant (P<0.05) improvement in fasting blood glucose levels in diabetic animals, with levels returning to the control measurements after just 12 days of treatment. Moreover, a combination of SeNPs and standard drug insulin (6 U/kg, sc) exhibited a significant and more potent antidiabetic activity than SeNPs alone, with a maximum percentage reduction of blood glucose compared with the diabetic SeNPs group. In general, the blood glucose values of diabetic rats showed a return to normal levels after 18 days of SeNPs administration.
 | Figure 4 Effect of SeNPs and insulin on the blood glucose levels over 28 days in control and experimental groups. |
Blood serum insulin levels
Figure 5 showed that there was a significant (P<0.05) reduction in insulin levels in diabetic control rats 5 weeks after the STZ injection, but that insulin levels in normal rats treated with SeNPs were significantly elevated. Four weeks of treatment with SeNPs and insulin also increased insulin levels in diabetic rats. The insulin level increased by 5.6% in the STZ-SeNPs group, 18.1% in the STZ-Ins group, and 16.7% in the STZ-SeNPs-Ins treatment group.
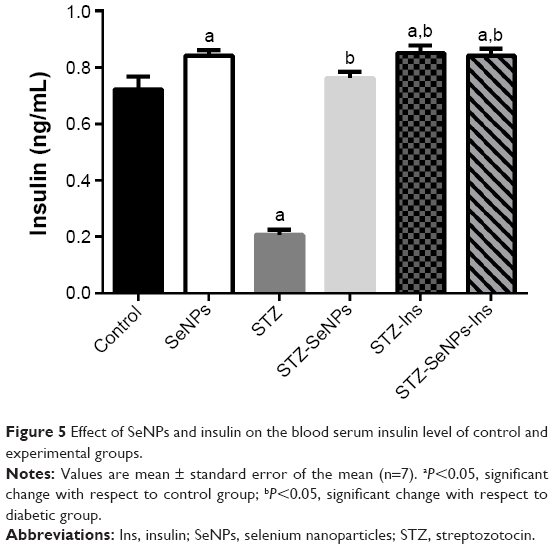 | Figure 5 Effect of SeNPs and insulin on the blood serum insulin level of control and experimental groups. |
Levels of liver and kidney functional markers
Diabetic rats showed elevated activities of hepatic (serum ALT, AST, and ALP) and renal (serum uric acid, urea, and creatinine) functional markers and a reduction in total bilirubin (Table 2). These markers were maintained at close to normal levels in the diabetic SeNP-treated group, although a similar effect was observed with insulin treatment.
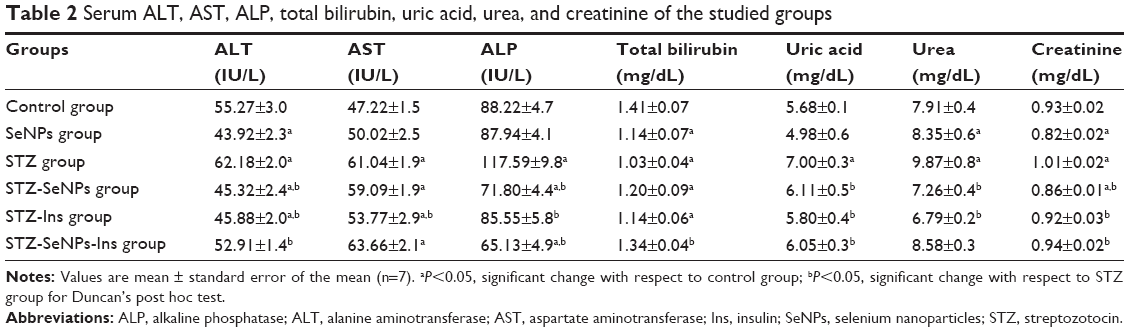 | Table 2 Serum ALT, AST, ALP, total bilirubin, uric acid, urea, and creatinine of the studied groups |
Glycogen and carbohydrate metabolic enzyme activities
A significant reduction (P<0.05) in glycogen contents and in the activities of malic, HK, and G6PD was noted in STZ-induced diabetic animals, along with a significant elevation (P<0.05) in glucose-6-phosphatase activity in hepatic tissue compared with the untreated control. After treatment with SeNPs, the diabetic rats exhibited a significant recovery (P<0.05) in glycogen and the activities of HK, glucose-6-phosphatase, and G6PD compared with the diabetic control (Figure 6).
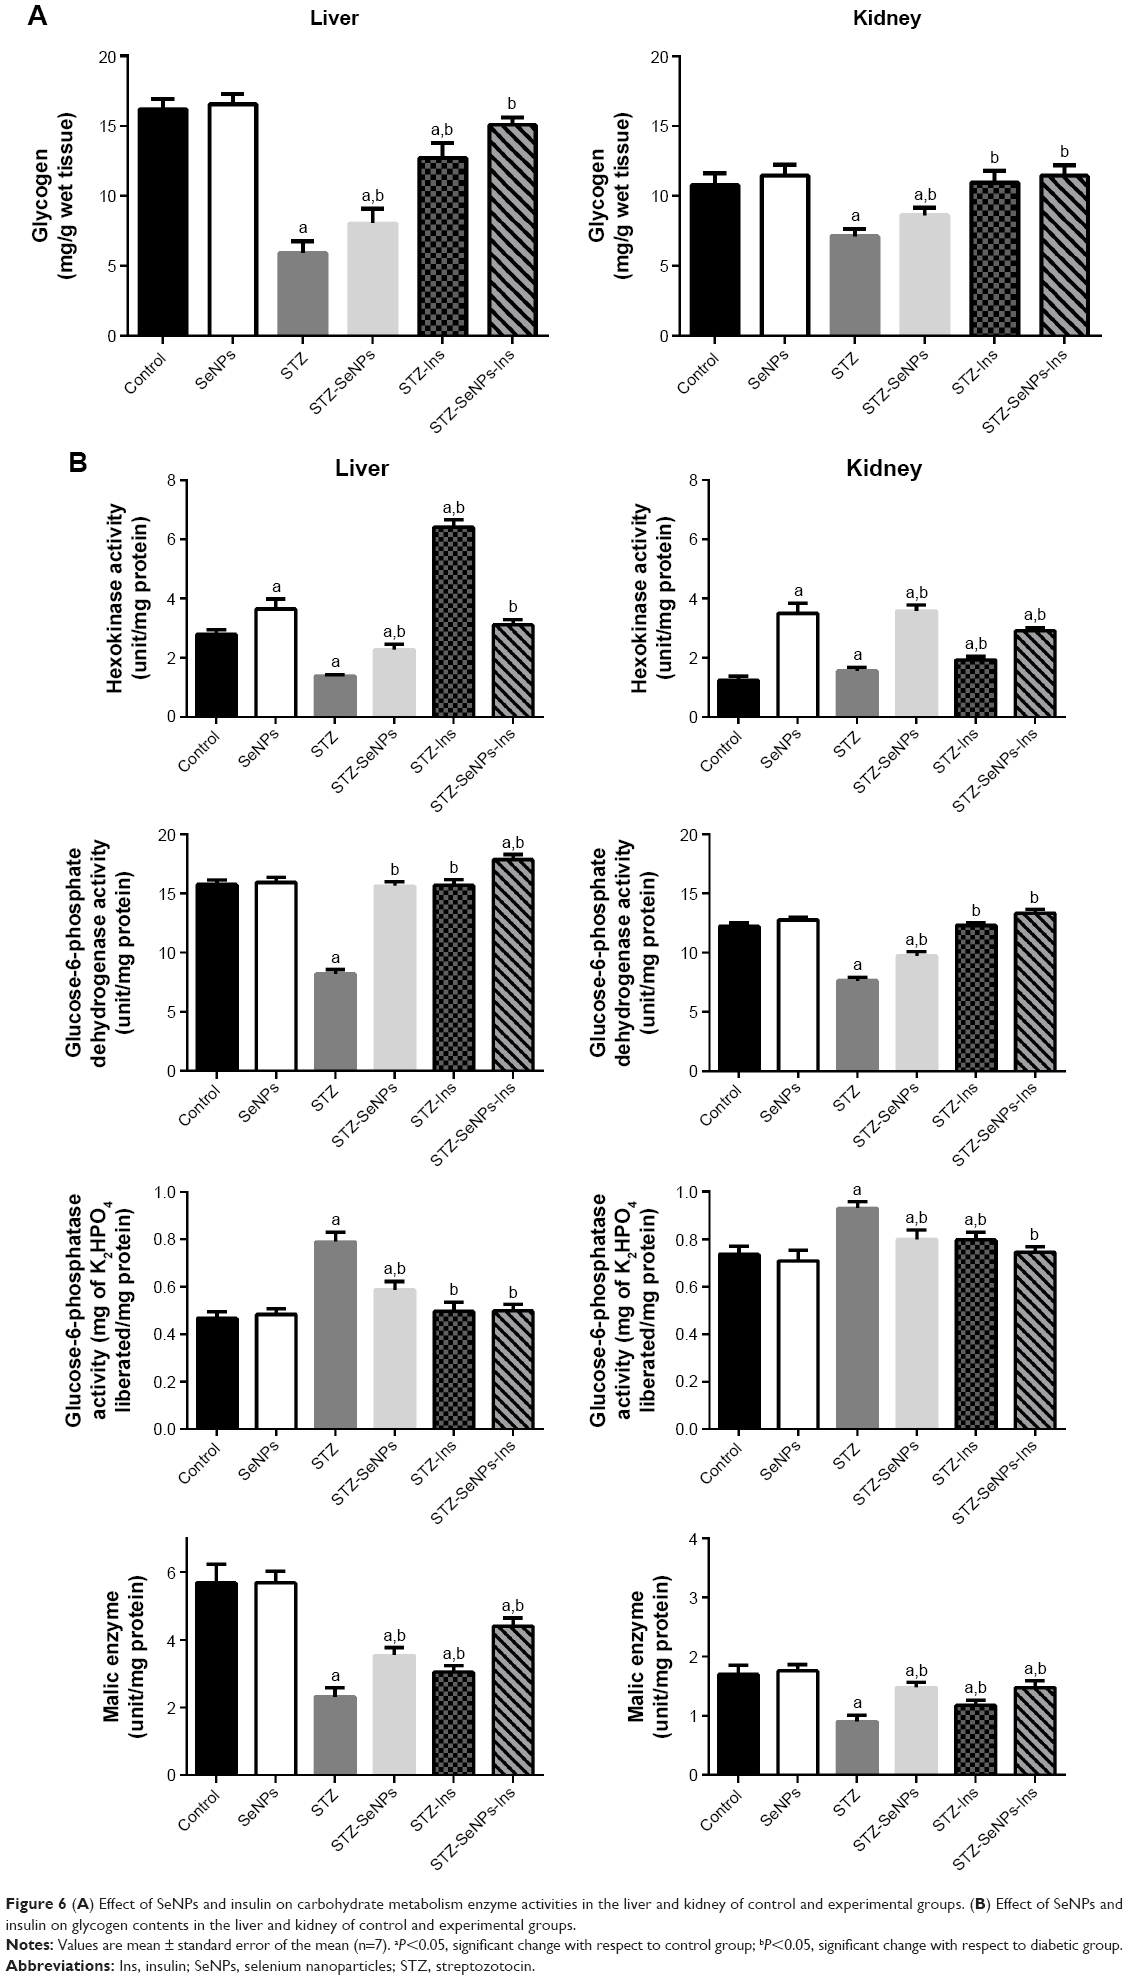 | Figure 6 (A) Effect of SeNPs and insulin on carbohydrate metabolism enzyme activities in the liver and kidney of control and experimental groups. (B) Effect of SeNPs and insulin on glycogen contents in the liver and kidney of control and experimental groups. |
Serum lipid profile
STZ-induced diabetes in rats resulted in a significant increase (P<0.05) in serum total lipid, triacylglycerols, total cholesterol, LDLc, and reduction in HDLc levels compared with the untreated control. As shown in Figure 3, however, if these diabetic animals were treated with SeNPs, a significant recovery (P<0.05) was evident, compared with the control (Table 3), with the exception of serum HDLc level. If SeNPs treatment was combined with standard drug insulin (6 U/kg, sc), the anti-hyperlipidemic activity was significantly more potent than with SeNPs alone, with maximum recovery levels seen in most of the tested parameters compared with the diabetic-untreated group.
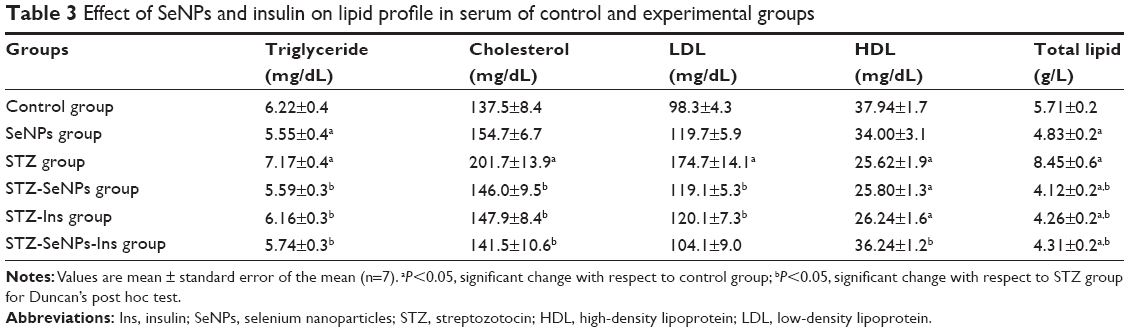 | Table 3 Effect of SeNPs and insulin on lipid profile in serum of control and experimental groups |
Gene expression
The current study was conducted to determine how SeNPs lower blood glucose levels by altering the expression of genes involved in glucose and lipid metabolisms. In hepatic tissue, the expression of GK, fatty acid synthase, and lipoprotein lipase genes in diabetic control rats was significantly lower than that in the overall control rats, whereas the expression of PK, PIK3R2, IR, and insulin receptor substrate 1 genes was significantly higher. In contrast, the expression of PIK3R2 and IR genes in renal tissue was significantly lower. SeNPs also significantly stimulated the mRNA expression of these genes in diabetic rats compared with diabetic control rats (Figures 7 and 8).
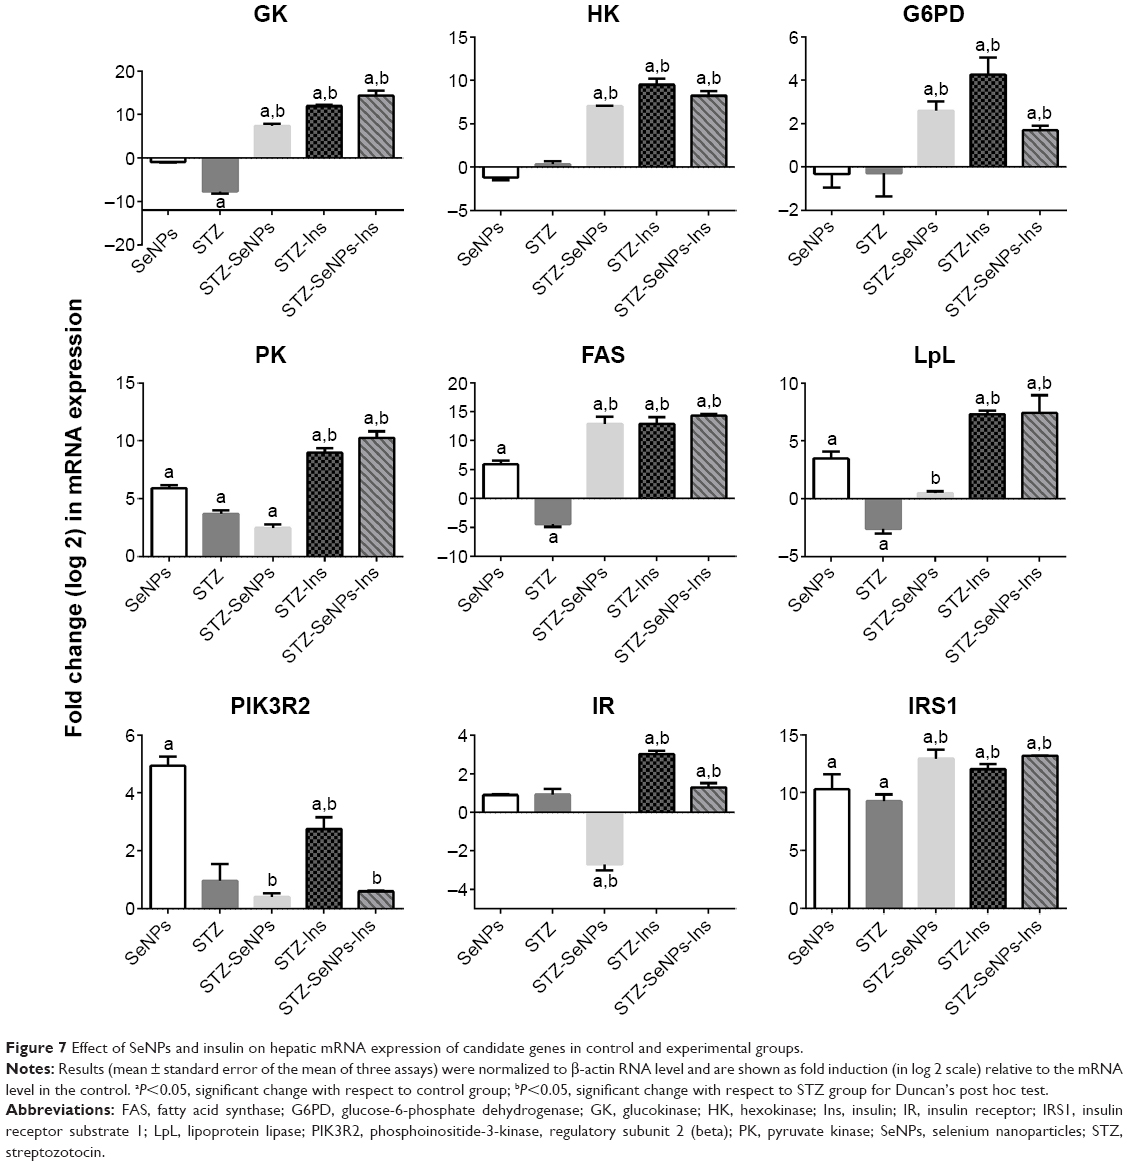 | Figure 7 Effect of SeNPs and insulin on hepatic mRNA expression of candidate genes in control and experimental groups. |
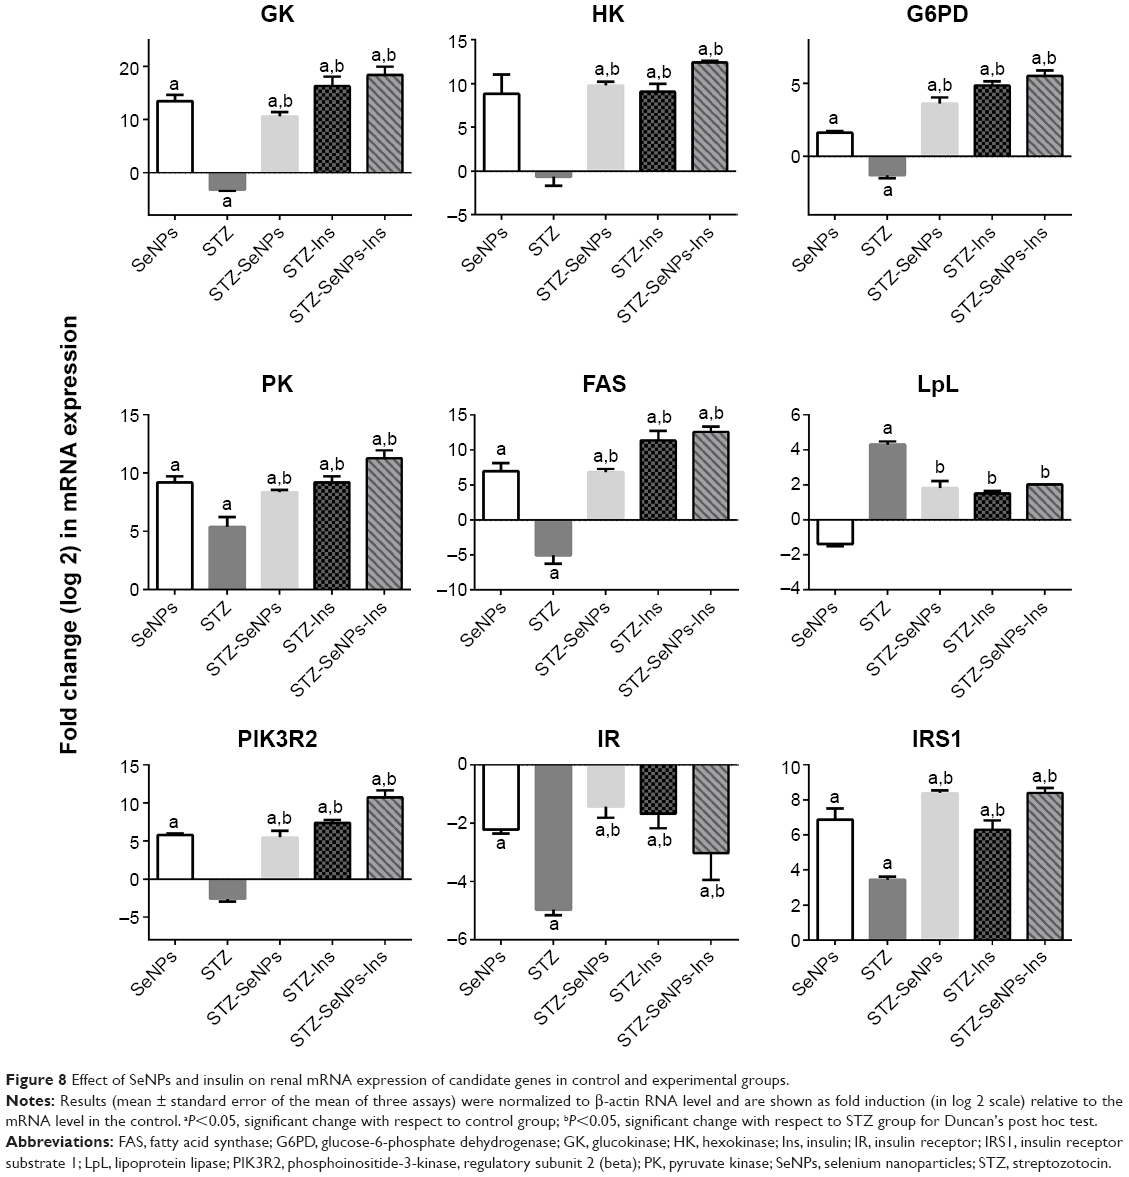 | Figure 8 Effect of SeNPs and insulin on renal mRNA expression of candidate genes in control and experimental groups. |
Histopathological findings
Normal histological architecture is seen in the pancreatic islet of the control group (Figure 9). In untreated diabetic rats, degenerative and necrotic changes were consistently found, such as shrunken islets of Langerhans, hydropic degeneration, and degranulation in the cytoplasm and lymphocyte infiltration. The nucleus of the necrotic cells indicated marginal hyperchromasia or either pyknosis (Figure 9). In the SeNPs, insulin, or SeNPs and insulin treatment groups, however, the majority of the cells of the islets of Langerhans were protected, although some hydropic degeneration, degranulation, and necrosis was still observed, and the diameter of the islets of Langerhans area remained reduced. The rats treated with SeNPs alone, meanwhile, showed normal β-cells, indicating that the Se did not cause any damage to the pancreas.
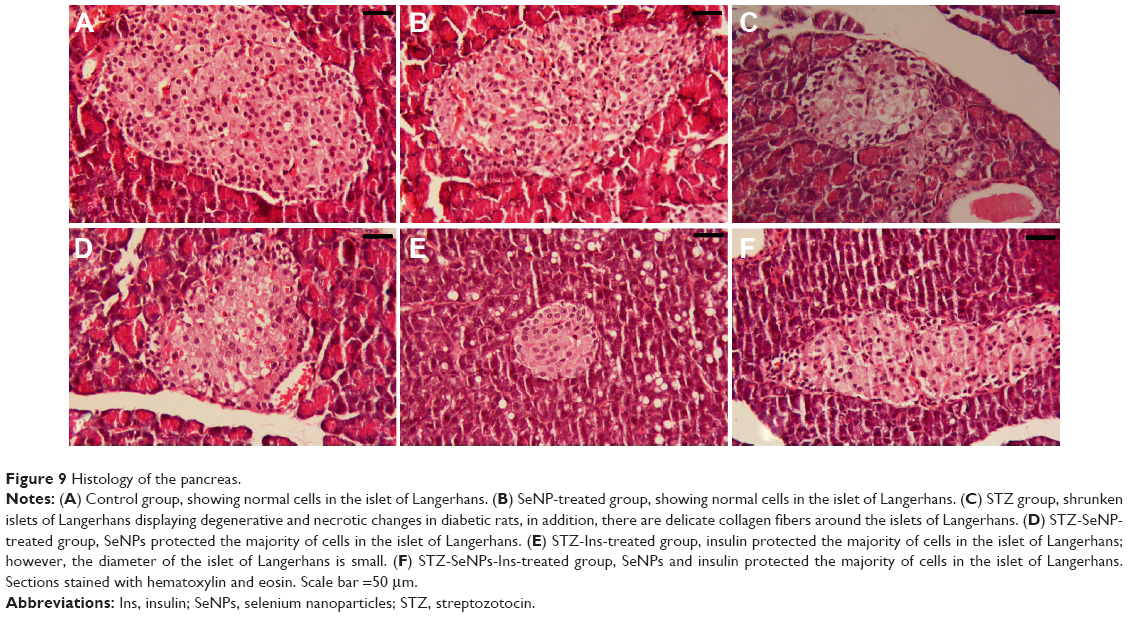 | Figure 9 Histology of the pancreas. |
The liver of the diabetic rats showed evidence of hepatic vein congestion, inflammatory cell invasion, variability in nuclear size, pyknosis, and Karyolysis. In addition, mild fat deposition was also seen in the sections (Figure 10). These pathological alterations were dramatically ameliorated in sections of the liver in diabetic rats treated with SeNPs, insulin, or SeNPs and insulin, where the sections showed hepatic lobules appearing in radiating plates of strands of hepatocytes, and the central vein.
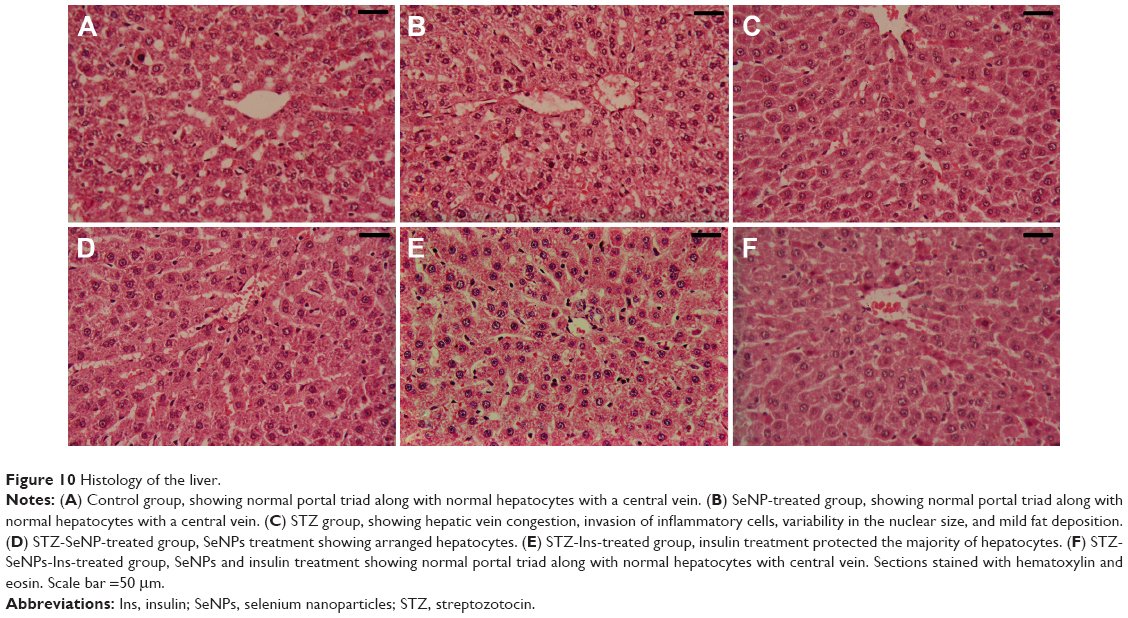 | Figure 10 Histology of the liver. |
Kidney sections from the STZ-treated group appeared with shrunken or completely lost glomeruli, intratubular blood congestion, loss of glomerular lobulation, tubular cytoplasmic vacuolation, and some pyknotic nuclei (Figure 11). Treatment with SeNPs, insulin, or SeNPs and insulin reversed these changes to near normalcy.
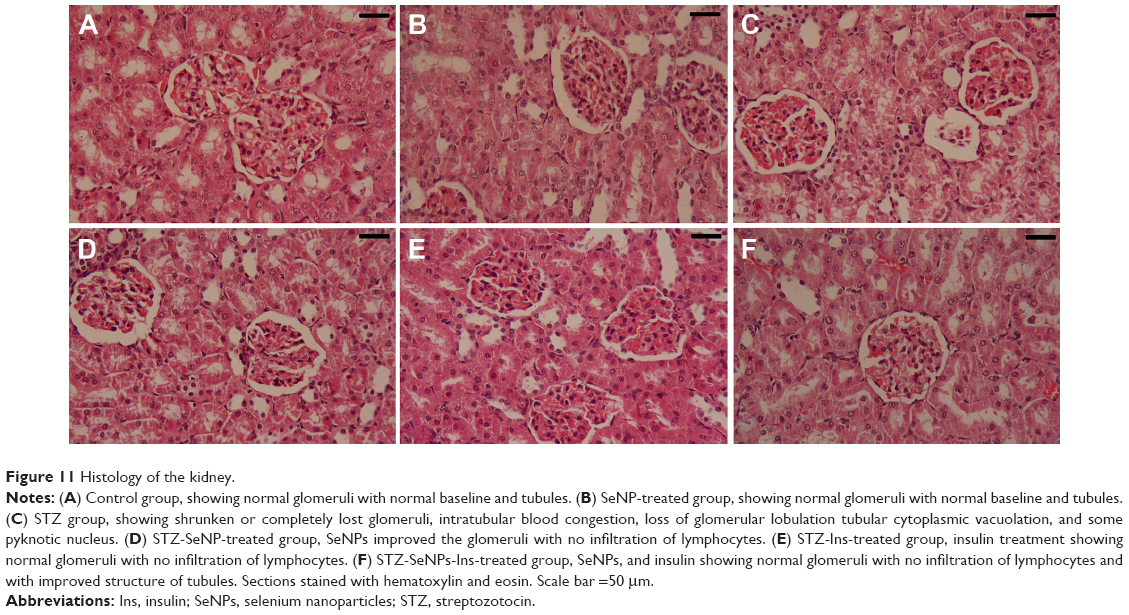 | Figure 11 Histology of the kidney. |
Immunohistological findings
In the control group, β-cells represented the major cell population of the islets, mainly occupying the central zone. Positive insulin expression was seen in the form of moderate brown granules present in the cytoplasm of β-cells (Figure 12A). Interestingly, SeNPs treatment alone caused a marked increase in the number of insulin immunopositive cells (Figure 12B). The immunoreactivity of β-cells from the STZ untreated group showed a markedly weaker staining intensity in insulin secreting cell population (Figure 12C). An apparent increase was observed in the number and size of reactive β-cells in each of the SeNPs-, Ins-, and SeNPs-Ins-treated groups compared with the control diabetic group (Figure 12D–F). In these groups, the islets of the SeNPs- and SeNPs-Ins-treated rats presented increased β-cells populations and size areas, while Ins-treated rats had size areas of β-cells comparable to untreated diabetes group.
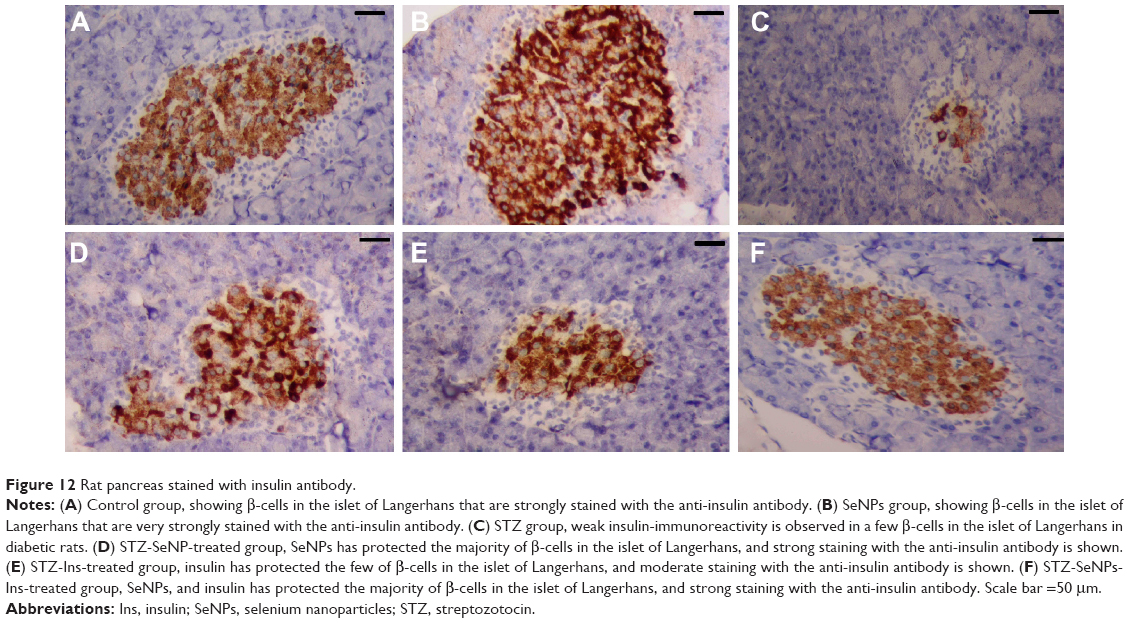 | Figure 12 Rat pancreas stained with insulin antibody. |
Discussion
Since Se has been reported to have properties that mimic insulin, the current study has attempted to elucidate the hyperglycemia and atherogenesis effects of Se in STZ-diabetic rats. The intraperitoneal administration of STZ (55 mg/kg) selectively destroys some of the pancreatic β-cells, resulting in insulin deficiency and thus type 2 diabetes.27 It also causes necrosis of pancreatic β-cells through DNA alkylation and, to a lesser extent, generation of nitric oxide and reactive oxygen species, leading to further insulin deficiency and hyperglycemia.28 Diabetic rats that were left untreated showed a marked reduction in their body weight compared with control rats, and this could be due to poor glycemic control. It has been shown, for example, that the excessive catabolism of protein to provide amino acids for gluconeogenesis during insulin deficiency results in muscle and weight loss in diabetic rats.29 The rise in insulin levels in diabetic rats once they are treated with SeNPs and/or insulin results in improved glycemic control, thereby preventing weight loss. The moderate decrease in body weight observed in the SeNPs group compared with the control group is probably due to a reduction in food intake, similar to the anorexigenic effect experienced by diabetic rats treated with vanadate, a well-established insulin-like agent.30
Se is capable of eliciting insulin-mimetic effects by activation of Akt and other kinases of the insulin signaling cascade such as p70 S6 kinase.31 With regard to the regulation of carbohydrate metabolism, the insulin-mimetic properties of Se compounds bear a close resemblance to the effects of vanadium. The hypoglycemic action of Se could, however, be supported by other mechanisms, such as an inhibition of intestinal glucose transport, which has been observed in vitro in the case of selenate. Se has also been shown to accelerate renal glucose excretion in rats.30 Early studies have been performed in isolated rat adipocytes, finding that sodium selenate stimulated glucose uptake by translocating glucose transporters to the plasma membrane and activating serine/threonine kinases, including the p70 S6 kinase.12,32 In addition, whole-body insulin sensitivity has been shown to improve in type 2 diabetic db/db mice in receipt of supranutritional sodium selenate doses.33 Moreover, sodium selenate improved glucose homeostasis in STZ-treated rodents.30 The antidiabetic effects of selenate in STZ-treated rats have been attributed to partial reversal of abnormal expression and the activity of glycolytic and gluconeogenic liver enzymes, whereas plasma insulin levels did not increase upon selenate administration.30
Another mechanism attributed to the hypoglycemic action of Se is GPx-1 expression. Among the selenoproteins, GPx-1 was the first identified and the most abundant and GPx-1 overexpression in wild-type animals afforded protection from STZ treatment. For example, mice that overexpressed GPx-1 were protected from STZ-induced β-cell damage. GPx-1 overexpression in db/db mice, a model of increased genetic diabetes susceptibility, led to initial amelioration and then reversal of hyperglycemia without the use of hypoglycemic agents. Moreover, reducing oxidative stress in the β-cell with GPx-1 preserves intranuclear musculoaponeurotic fibrosarcoma oncogene homolog A, enabling it to transactivate the insulin gene. Musculoaponeurotic fibrosarcoma oncogene homolog A has been shown to be a critical transcription factor in the regulation of the insulin gene. This outcome was accompanied by significant increases in β-cell volume, as well as increased insulin staining and granulation in SeNP-treated groups.34
Insulin regulates metabolism by controlling the uptake and consumption of glucose in organs such as the liver and kidney and in adipose tissue and skeletal muscle. This regulation is achieved by controlling the actions of various metabolic enzymes. A reduction, or even total absence of insulin secretion, causes a disruption in carbohydrate metabolism, thereby diminishing the activity of a number of key enzymes including HK, G6PD, and PK.35 The HK enzyme is involved in the glucose phosphorylation step in glycolysis by converting glucose to glucose-6-phosphate. Since diabetes is associated with a significant reduction in its activity, this decrease in glucose utilization may explain the increased blood glucose level.36 Glucose-6-phosphatase is also an important enzyme in regulating the gluconeogenic pathway and its activity has been shown to increase in diabetic rats.37 Therefore, the hypoglycemic action of SeNPs is evidenced by the effects in the liver, where treatment with SeNPs partially restored mRNA levels and the activities of key glycolytic enzymes.
Glycogen serves as a primary intracellular storage form of glucose in various tissues, with its deposition depending on insulin. In normal physiological conditions, insulin activates glycogen synthase and suppresses glycogen phosphorylase, thus promoting its deposition.38 In this study, it is shown that the SeNP-treated rats exhibited enhanced glycogen contents in the liver and kidney through the stimulation of glycogen synthase activity.
The liver is the main effector organ for maintaining blood glucose levels within narrow limits, in addition to its vital function in metabolism, detoxification, storage, and excretion of xenobiotics and their metabolites. Transaminases (ALT and AST) are highly sensitive biomarkers and have been closely linked to hepatic damage and toxicity.39 Maiti et al36 have proposed that such increases in the activities of ALT, AST, and ALP in the serum of diabetic rats may be mainly due to leakage of these enzymes from liver cytosol into the bloodstream as a consequence of hepatic injury associated with STZ.36 The increased levels of ALT and AST associated with insulin deficiency has been related to increased gluconeogenesis during diabetes.40 This study, however, has shown that treatment with SeNPs restored the activities of ALT, AST, and ALP toward normal levels. This finding could be explained due to the radical scavenging property of Se and the importance of Se in protecting the integrity and the functions of tissues.41
The kidney has been the focus of much of the study regarding the common complications associated with diabetes, since many of the same factors are involved in the development of diabetic nephropathy, microvascular disease, and retinopathy. In our study, elevated levels of serum uric acid, urea, and creatinine were observed in untreated diabetic rats, which are clear indicators of renal dysfunction.40 Such dysfunction of the kidney are also reflected in the histological characteristics of early diabetic nephropathy, including mesangial expansion, diffuse glomerular basement membrane thickening, and increased mesangial cellularity.42 In the present study, renal dysfunction in STZ rats occurring at the end of 4 weeks was reversed by treatment with SeNPs. The hypoglycemic effect of SeNPs may at least partially explain the ameliorated renal function in the SeNP-treated diabetic rats. Furthermore, supplementing diabetic rats with Se-rich diet for 6 months could help in delaying the onset of diabetic nephropathy by modulating the endogenous antioxidants and activating several selenoproteins.43
In conclusion, the findings of the present work indicate that DM-induced severe biochemical and histochemical changes in the liver and kidney and SeNPs have a protective effect and minimize the risk of diabetic complications. This protection may be due to the free radical scavenging effect of this metal and/or its insulin-mimetic effect. However, further studies are needed to get a deep insight into the hypoglycemic activity of SeNPs and/or the possible toxicity increases after SeNPs are administered for a long time before starting any clinical trials.
Acknowledgments
We thank Prof Dr H Sies and Dr H Steinbrenner for their expert advice on selenium treatment and experimental design. The authors appreciate the Distinguished Scientist Fellowship Program, King Saud University, Saudi Arabia for funding this work.
Disclosure
The authors report no conflicts of interest in this work.
References
Kumar S, Singh R, Vasudeva N, Sharma S. Acute and chronic animal models for the evaluation of anti-diabetic agents. Cardiovasc Diabetol. 2012;11:9. | ||
Dharmalingam M. Efficacy and tolerability of GLP-1 agonists in patients with type 2 diabetes mellitus: an Indian perspective. Ther Adv Endocrinol Metab. 2014;5(6):159–165. | ||
de Cavanagh EM, Inserra F, Toblli J, Stella I, Fraga CG, Ferder L. Enalapril attenuates oxidative stress in diabetic rats. Hypertension. 2001;38(5):1130–1136. | ||
Giacco F, Brownlee M. Oxidative stress and diabetic complications. Circ Res. 2010;107(9):1058–1070. | ||
de la Garza-Rodea AS, Knaan-Shanzer S, den Hartigh JD, Verhaegen AP, van Bekkum DW. Anomer-equilibrated streptozotocin solution for the induction of experimental diabetes in mice (Mus musculus). J Am Assoc Lab Anim Sci. 2010;49(1):40–44. | ||
Srivastava P, Braganca JM, Kowshik M. In vivo synthesis of selenium nanoparticles by Halococcus salifodinae BK18 and their anti-proliferative properties against HeLa cell line. Biotechnol Prog. 2014;30(6):1480–1487. | ||
Hassanin KM, Abd El-Kawi SH, Hashem KS. The prospective protective effect of selenium nanoparticles against chromium-induced oxidative and cellular damage in rat thyroid. Int J Nanomedicine. 2013;8:1713–1720. | ||
Jozanov-Stankov O, Demajo M, Djujic I, Mandic M. Selenium intake as a modulator of responsiveness to oxidative stress. J Environ Pathol Toxicol Oncol. 1998;17(3–4):251–257. | ||
Jia X, Liu Q, Zou S, Xu X, Zhang L. Construction of selenium nanoparticles/beta-glucan composites for enhancement of the antitumor activity. Carbohydr Polym. 2015;117:434–442. | ||
Arthur JR, McKenzie RC, Beckett GJ. Selenium in the immune system. J Nutr. 2003;133(5 Suppl 1):1457S–1459S. | ||
McNeill JH, Delgatty HLM, Battell ML. Insulinlike effects of sodium selenate in streptozocin-induced diabetic rats. Diabetes. 1991;40(12):1675–1678. | ||
Ezaki O. The insulin-like effects of selenate in rat adipocytes. J Biol Chem. 1990;265(2):1124–1128. | ||
Loeschner K, Hadrup N, Hansen M, et al. Absorption, distribution, metabolism and excretion of selenium following oral administration of elemental selenium nanoparticles or selenite in rats. Metallomics. 2014;6(2):330–337. | ||
Wei M, Ong L, Smith MT, et al. The streptozotocin-diabetic rat as a model of the chronic complications of human diabetes. Heart Lung Circ. 2003;12(1):44–50. | ||
Lowry OH, Rosebrough NJ, Farr AL, Randall RJ. Protein measurement with the Folin phenol reagent. J Biol Chem. 1951;193(1):265–275. | ||
Trinder P. Determination of blood glucose using an oxidase-peroxidase system with a non-carcinogenic chromogen. J Clin Pathol. 1969;22(2):158–161. | ||
Reitman S, Frankel S. A colorimetric method for the determination of serum glutamic oxalacetic and glutamic pyruvic transaminases. Am J Clin Pathol. 1957;28(1):56–63. | ||
Belfield A, Goldberg DM. Revised assay for serum phenyl phosphatase activity using 4-amino-antipyrine. Enzyme. 1971;12(5):561–573. | ||
Schmidt M, Eisenburg J. Serum bilirubin determination in newborn infants. A new micromethod for the determination of serum of plasma bilirubin in newborn infants. Fortschr Med. 1975;93(30):1461–1466. | ||
Paglia DE, Valentine WN. Studies on the quantitative and qualitative characterization of erythrocyte glutathione peroxidase. J Lab Clin Med. 1967;70(1):158–169. | ||
Seifter S, Dayton S, Novic B, Muntwyler E. The estimation of glycogen with the anthrone reagent. Arch Biochem. 1950;25(1):191–200. | ||
Chou AC, Wilson JE. Carbohydrate Metabolism. New York: Academic Press; 1975. | ||
Langdon RG. Glucose-6-phosphate Dehydrogenase from Erythrocytes. Vol 9. New York: Academic Press; 1966. | ||
Swanson MA. Glucose-6-phosphatase from Liver. Vol 2. New York: Academic Press; 1955. | ||
Pfaffl MW. A new mathematical model for relative quantification in real-time RT-PCR. Nucleic Acids Res. 2001;29(9):e45. | ||
Sternberger LA. Immunocytochemistry. 2d ed. New York: Wiley; 1979. | ||
Sunil C, Agastian P, Kumarappan C, Ignacimuthu S. In vitro antioxidant, antidiabetic and antilipidemic activities of Symplocos cochinchinensis (Lour.) S. Moore bark. Food Chem Toxicol. 2012;50(5):1547–1553. | ||
Lenzen S. The mechanisms of alloxan- and streptozotocin-induced diabetes. Diabetologia. 2008;51(2):216–226. | ||
Kasetti RB, Rajasekhar MD, Kondeti VK, et al. Antihyperglycemic and antihyperlipidemic activities of methanol:water (4:1) fraction isolated from aqueous extract of Syzygium alternifolium seeds in streptozotocin induced diabetic rats. Food Chem Toxicol. 2010;48(4):1078–1084. | ||
Becker DJ, Reul B, Ozcelikay AT, Buchet JP, Henquin JC, Brichard SM. Oral selenate improves glucose homeostasis and partly reverses abnormal expression of liver glycolytic and gluconeogenic enzymes in diabetic rats. Diabetologia. 1996;39(1):3–11. | ||
Steinbrenner H, Speckmann B, Pinto A, Sies H. High selenium intake and increased diabetes risk: experimental evidence for interplay between selenium and carbohydrate metabolism. J Clin Biochem Nutr. 2011;48(1):40–45. | ||
Hei YJ, Farahbakhshian S, Chen X, Battell ML, McNeill JH. Stimulation of MAP kinase and S6 kinase by vanadium and selenium in rat adipocytes. Mol Cell Biochem. 1998;178(1–2):367–375. | ||
Mueller AS, Pallauf J. Compendium of the antidiabetic effects of supranutritional selenate doses. In vivo and in vitro investigations with type II diabetic db/db mice. J Nutr Biochem. 2006;17(8):548–560. | ||
Harmon JS, Bogdani M, Parazzoli SD, et al. beta-Cell-specific overexpression of glutathione peroxidase preserves intranuclear MafA and reverses diabetes in db/db mice. Endocrinology. 2009;150(11):4855–4862. | ||
Sheikh BA, Pari L, Rathinam A, Chandramohan R. Trans-anethole, a terpenoid ameliorates hyperglycemia by regulating key enzymes of carbohydrate metabolism in streptozotocin induced diabetic rats. Biochimie. 2015;112:57–65. | ||
Maiti S, Ali KM, Jana K, Chatterjee K, De D, Ghosh D. Ameliorating effect of mother tincture of Syzygium jambolanum on carbohydrate and lipid metabolic disorders in streptozotocin-induced diabetic rat: Homeopathic remedy. J Nat Sci Biol Med. 2013;4(1):68–73. | ||
Kim HK, Kim MJ, Lyu ES, Shin DH. Improvement of diabetic complication by hydrangea dulcis folium in streptozotocin-induced diabetic rats. Biol Pharm Bull. 2009;32(1):153–156. | ||
Sharma BR, Rhyu DY. Lespedeza davurica (Lax.) Schindl. extract protects against cytokine-induced beta-cell damage and streptozotocin-induced diabetes. Biomed Res Int. 2015;2015:169256. | ||
Dkhil MA, Al-Quraishy S, Diab MM, Othman MS, Aref AM, Abdel Moneim AE. The potential protective role of Physalis peruviana L. fruit in cadmium-induced hepatotoxicity and nephrotoxicity. Food Chem Toxicol. 2014;74:98–106. | ||
Nabi SA, Kasetti RB, Sirasanagandla S, Tilak TK, Kumar MV, Rao CA. Antidiabetic and antihyperlipidemic activity of Piper longum root aqueous extract in STZ induced diabetic rats. BMC Complement Altern Med. 2013;13:37. | ||
Messarah M, Klibet F, Boumendjel A, et al. Hepatoprotective role and antioxidant capacity of selenium on arsenic-induced liver injury in rats. Exp Toxicol Pathol. 2012;64(3):167–174. | ||
Huang SS, Yan YH, Ko CH, Chen KM, Lee SC, Liu CT. A comparison of food-grade Folium mori (Sang Ye) extract and 1-Deoxynojirimycin for glycemic control and renal function in streptozotocin-induced diabetic rats. J Tradit Complement Med. 2014;4(3):162–170. | ||
Douillet C, Tabib A, Bost M, Accominotti M, Borson-Chazot F, Ciavatti M. Selenium in diabetes: effects of selenium on nephropathy in type I streptozotocin-induced diabetic rats. J Trace Elements Exp Med. 1999;12(4):379–392. |
 © 2015 The Author(s). This work is published and licensed by Dove Medical Press Limited. The
full terms of this license are available at https://www.dovepress.com/terms
and incorporate the Creative Commons Attribution
- Non Commercial (unported, 3.0) License.
By accessing the work you hereby accept the Terms. Non-commercial uses of the work are permitted
without any further permission from Dove Medical Press Limited, provided the work is properly
attributed. For permission for commercial use of this work, please see paragraphs 4.2 and 5 of our Terms.
© 2015 The Author(s). This work is published and licensed by Dove Medical Press Limited. The
full terms of this license are available at https://www.dovepress.com/terms
and incorporate the Creative Commons Attribution
- Non Commercial (unported, 3.0) License.
By accessing the work you hereby accept the Terms. Non-commercial uses of the work are permitted
without any further permission from Dove Medical Press Limited, provided the work is properly
attributed. For permission for commercial use of this work, please see paragraphs 4.2 and 5 of our Terms.