Back to Journals » International Journal of Nanomedicine » Volume 14
An organic NIR-II nanofluorophore with aggregation-induced emission characteristics for in vivo fluorescence imaging
Authors Wu W ![]() , Yang YQ, Yang Y, Yang YM, Wang H, Zhang KY, Guo L, Ge HF
, Yang YQ, Yang Y, Yang YM, Wang H, Zhang KY, Guo L, Ge HF ![]() , Liu J
, Liu J ![]() , Feng H
, Feng H ![]()
Received 17 December 2018
Accepted for publication 20 March 2019
Published 23 May 2019 Volume 2019:14 Pages 3571—3582
DOI https://doi.org/10.2147/IJN.S198587
Checked for plagiarism Yes
Review by Single anonymous peer review
Peer reviewer comments 3
Editor who approved publication: Dr Mian Wang
Supplementary video S1 shows L1013 NPs allowed NIR-II dynamic imaging with a fast video rate of 11.3 frames per second.
Views: 284
Wei Wu,1,* Yan-Qing Yang,2,* Yang Yang,1,* Yu-Ming Yang,2 Hong Wang,2 Kai-Yuan Zhang,1 Li Guo,3 Hong-Fei Ge,1 Jie Liu,2 Hua Feng1
1Department of Neurosurgery, Southwest Hospital, Third Military Medical University (Army Medical University), Chongqing 400038, People’s Republic of China; 2Key Laboratory of Flexible Electronics (KLOFE) Institute of Advanced Materials (IAM), Nanjing Tech University, Nanjing 211800, People’s Republic of China; 3Department of Endocrinology, Southwest Hospital, Third Military Medical University (Army Medical University), Chongqing 400038, People’s Republic of China
*These authors contributed equally to this work
Background: In vivo fluorescence imaging in the second near-infrared (NIR-II, 1000–1700 nm) window using organic fluorophores has great advantages, but generally suffers from a relatively low fluorescence quantum yield (mostly less than 2%). In this study, organic nanoparticles (L1013 NPs) with a high fluorescence quantum yield (9.9%) were systhesized for in vivo imaging.
Methods: A molecule (BTPPA) with donor-acceptor-donor structure and aggregation-induced emission enabling moieties was prepared. BTPPA molecules were then encapsulated into nanoparticles (L1013 NPs) using a nanoprecipitation method. The L1013 NPs were intravenously injected into the mice (including normal, stroke and tumor models) for vascular and tumor imaging.
Results: L1013 NPs excited at 808 nm exhibit NIR-II emission with a peak at 1013 nm and an emission tail extending to 1400 nm. They have a quantum yield of 9.9% and also show excellent photo/colloidal stabilities and negligible in vitro and in vivo toxicity. We use L1013 NPs for noninvasive real-time visualization of mouse hindlimb and cerebral vessels (including stroke pathology) under a very low power density (4.6–40 mW cm‒2) and short exposure time (40–100 ms). Moreover, L1013 NPs are able to localize tumor pathology, with a tumor-to-normal tissue ratio of 11.7±1.3, which is unusually high for NIR-II fluorescent imaging through passive targeting strategy.
Conclusion: L1013 NPs demonstrate the potential for a range of clinical applications, especially for tumor surgery.
Keywords: fluorescence NIR-II imaging, aggregation-induced emission, organic nanoparticle, vascular imaging, tumor imaging
Introduction
Compared to imaging in the visible and traditional near-infrared region (NIR-I, 650–900 nm), in vivo fluorescence imaging in the second near-infrared (NIR-II, 1000–1700 nm) region exhibits lower photon scattering and tissue autofluorescence.1–3 NIR-II imaging can therefore provide a higher spatial resolution (micrometer-scale) at sub-centimeter depths and has the potential for tumor identification,4–6 vascular visualization7,8 and molecular imaging.9,10 Various inorganic NIR-II fluorescent agents, including single-walled carbon nanotubes,11,12 semiconducting quantum dots,13–16 and rare-earth doped nanoparticles (NPs),17,18 have been extensively investigated for NIR-II fluorescence imaging in vivo. However, these agents have potential long-term toxicity concerns (eg, caused by heavy metal ion leaching). Organic NIR-II fluorophores are not associated with these long-term toxicity concerns, and they are therefore considered more suitable for clinical use. Existing organic NIR-II fluorophores include organic dyes,19 conjugated polymer nanoparticles,20 and donor-acceptor-donor (D-A-D)-structured small molecules.21–27 However, their use for in vivo imaging is dominantly limited by their low fluorescence quantum yield (QY, mostly less than 2%) in aqueous media.19–23,25,28 The low QY is mainly caused by strong intramolecular charge transfer effect21,22,28 and aggregation-caused quenching (ACQ) effect.19,25,29
Opposite to ACQ effect, aggregation-induced emission (AIE) is a unique phenomenon that AIE fluorophores have increased fluorescence upon aggregate formation, because of the restriction of intramolecular rotation arising from physical constraint.30 AIE nanoparticles (AIE NPs) are nanostructures that incorporate tightly packed AIE molecules as active components.31,32 The unique AIE characteristics enable AIE NPs with a high QY. AIE NPs could be readily prepared through nanoprecipitation with tunable NP size, fluorescence wavelength, and surface chemistry. Brightness can be adjusted in proportion to the number of AIE molecules within the NPs. AIE NPs also possess good stability, high absorption coefficient, and excellent biocompatibility. These features make AIE NPs ideal for in vivo fluorescence imaging. However, to date, most reported AIE NPs are emissive in the visible and far-red/NIR bands,33–38 which cannot provide much biological information about deep tissues, due to severe photon interference. Recently, long wavelength excitable (~740 nm) NIR-II AIE NPs have been reported for imaging of brain tumors.39 However, only a small part of their emission profile was located in the NIR-II region, and the QY in NIR-II region was estimated to be around 2.7%. Thus, development of NIR-II AIE NPs with improved properties is still challenging.
Here, we report a novel organic AIE fluorophore, BTPPA, and its formulation into NPs, named L1013 NPs. Using an in vivo mouse model, we then demonstrate the utility of L1013 NPs for imaging a variety of biological tissues and their sensitivity for detecting stroke and neoplastic disease.
Material and methods
Materials
1,2-Distearoyl-sn-glycero-3-phosphoetanolamine-N-[methoxy(polyethylene glycol)-2000] (DSPE-PEG2000) was obtained from Laysan Bio, Inc. Milli-Q water (18.2 MΩ) was supplied by a Milli-Q Plus System (Millipore Corporation, Bedford, USA) and used for all the experiments requiring an aqueous medium. All other Chemicals were purchased from Sigma-Aldrich or Energy Chemical (China) and used as received unless specified otherwise.
Characterization
Nuclear magnetic resonance (NMR) spectra were recorded on a Bruker Avance III 400 MHz NMR spectrometer (400 MHz for 1H, referenced to TMS at δ =0.00 ppm and 100 MHz for 13C, referenced to CDCl3 at 77.0 ppm). The hydrodynamic diameter and zeta potential of L1013 NPs were recorded on Micromeritics Nanoplus-3 (US). Transmission electron microscopy (TEM) images were obtained on a JEOL JEM-2100 electron microscope with an accelerating voltage of 200 KV. UV-vis-NIR spectra were measured on a Shimadzu UV-1750 spectrometer. Photoluminescence (PL) spectra were recorded on an Edinburgh instruments FLS980, using Xe lamp as the excitation source and a liquid nitrogen cooled InGaAs diode detector for signal detection. Fluorescence quantum yield was determined using IR26 in 1,2-dichloroethane (0.5%) as the standard. The absorbance of solutions was controlled below 0.1 to avoid internal filter effect.
Preparation of nanoaggregates
Stock solution of BTPPA in tetrahydrofuran (THF) was prepared with a concentration of 1 mg mL‒1. Aliquots of the stock solution were added to 1 mL tube and diluted with appreciate amounts of THF, and then water was added in one portion under vigorous stirring to afford 10 μg mL‒1 solutions with different water fractions (0‒90 vol%). The PL measurements of the resultant mixture solutions were performed immediately upon excitation at 750 nm. The fluorescence images of the resultant solution were also captured by a two-dimensional InGaAs array (Suzhou Optics, China) upon excitation at 808 nm (power density: 4.6 mW cm‒2) with a 1000 long-pass (LP) filter for signal collection.
Preparation of L1013 NPs
A mixture of BTPPA molecule (10 mg) and DSPE-PEG2000 (20 mg) in THF (10 mL) was vigorously stirred at room temperature for 3 hrs, followed by filtration using a 0.45 μm syringe driven filter. The filtrate was added to Milli-Q water (100 mL) under sonication for 4 mins using a microtip sonicator at 390 W output. The obtained mixture was stirred vigorously at room temperature in fumehood to remove THF solvent, and then filtration was carried out using a 0.2 μm syringe driven filter to afford L1013 NPs. The obtained NPs were concentrated to a concentration of 3.7 mg mL‒1 in 1×PBS for further use.
Ethics statement
All procedures involving animals were performed under the approval of the Institutional Review Board of the Southwest Hospital, Third Military Medical University (Army Medical University), and conformed to the NIH guidelines on the ethical use of animals.
Pharmacokinetics and excretion of L1013 NPs
After the healthy C57Bl/6 mice (postnatal week 8, n=3) were anesthetized using a mixture of 10 mg kg‒1 ketamine (Sigma-Aldrich, St. Louis, MO, USA) and 1 mg kg‒1 xylazine (Sigma-Aldrich), 200 μL of L1013 NPs (3.7 mg mL‒1) were intravenously injected into the mice. At time point of 2, 6, 12, 24, 36, 48, and 72 hrs postinjection, we drew blood (10 μL every time) and collected urine and feces from the mice. To prevent clotting, the 10 μL of blood was lysed in the 90 μL of lysis buffer (R1010, Solarbio, China) before imaging. The L1013 NPs were diluted into 50, 10, 5, 2, and 1 μg mL‒1 to obtain a standard curve of florescence intensity vs concentration. Finally, florescence imaging of the lysed blood, urine, and feces were achieved to calculate the florescence intensity and concentration of L1013 NPs.
Ex vivo distribution of L1013 NPs
The C57Bl/6 mice (postnatal week 8, n=3) were sacrificed with cervical dislocation 72 hrs postintravenous injection of L1013 NPs (200 μL, 3.7 mg mL‒1). Then the vital organs including heart, liver, spleen, lung, kidney, stomach, and gut were harvested and imaged in bright field and NIR-II window (excitation: 4.6 mW cm‒2 808 nm diode laser; filter: 1250 nm LP; exposure time: 100 ms).
High-magnification microscopic imaging of cerebral and hindlimb vessels
After the C57Bl/6 mice (postnatal week 8, n=3 for each group) were anesthetized as described before, we carefully removed the hair over the scalp and hindlimb skin. Afterwards, 200 μL of L1013 NPs (3.7 mg mL‒1) were intravenously injected into the healthy mice or mice models of stroke. When the mice were mounted on the imaging stage, 808 nm diode laser (40 mW cm‒2) coupled with a 1000 nm LP filter was used for NIR-II fluorescence imaging, which were collected by a two-dimensional InGaAs array (Suzhou Optics, China). The exposure time for all the images was 40 ms.
Low-magnification microscopic imaging of lymphatic drainage and whole body
After nude mice (postnatal week 8, n=3 for each group) were anesthetized as described before, 10 μL of L1013 NPs (3.7 mg mL‒1) were intradermally injected into both footpads for lymphatic imaging. Then, the mice were mounted on the imaging stage in the prone position and were excited under 808 nm diode laser (14 mW cm‒2) coupled with a 1250 nm LP filter to collect NIR-II fluorescence signals. To study the biodistribution of L1013 NPs, nude mice (postnatal week 8, n=3) were anesthetized by a 2 L min‒1 oxygen flow with 2% isoflurane. Then, 200 μL of L1013 NPs (3.7 mg mL‒1) were intravenously injected into the mice. Under the excitation of 808 nm diode laser (7.9 mW cm‒2), time-course NIR-II fluorescence imaging were achieved through 1250 nm LP filter. The exposure time for all the images was 100 ms.
Middle cerebral artery occlusion (MCAO)
Induction of MCAO in C57Bl/6 mice (postnatal week 8, n=3) was performed as described previously.40,41 Briefly, mice were induced anesthesia with 3% (vol/vol) isoflurane in 67:30% (vol/vol) N2O/O2 and maintained anesthesia with a nose cone blowing 1.5% (vol/vol) isoflurane. A filament was then introduced from the common carotid artery of the mice into the internal carotid and advanced into the arterial circle to occlude the middle cerebral artery. Rectal temperature was maintained at 37.0±0.5°C during the surgery through a temperature-controlled heating pad.
Hemorrhagic stroke
Three C57Bl/6 mice (postnatal week 8) were used to surgically induce hemorrhagic stroke according to the previous protocol with a few modifications.42 In brief, the mice were anesthetized as described before and followed with an intravenous injection of 200 μL of L1013 NPs (3.7 mg mL‒1). We carefully removed the temporal scalp to expose the skull, and made a small cranial burr hole. Then, 10 μL of autologous blood collected from tail blood vessels was injected into the right subcortex (bregma coordinates: 2 mm posterior and 3 mm lateral to the midline, and 1 mm in depth) at a rate of 2 μL min‒1 using a microinfusion pump (Harvard Apparatus, Holliston, MA) under stereotactic guidance. Afterwards, the mice were subjected to NIR-II imaging immediately. After the NIR-II imaging, the mice were sacrificed and the whole brain was removed from the skull. The brain was post-fixed by formalin and dehydrated with 30% sucrose solution for 2 days at 4°C. Then the brain was embedded in optimal cutting temperature compound (O.C.T.; Sakura Finetek USA, Inc., Torrance, CA) and cut into 30-µm-thick sections. Finally, the brain slices were observed under microscope.
Tumor model
The U87MG cells (1×10⁶ in 100 μL of PBS) were mixed with 10 μL Matrigel (354277, BD Biosciences, USA) and then subcutaneously injected into the hindlimb of nude mice (postnatal week 8, n=6). Then, the mice were kept in specific pathogen-free conditions for 7 days before imaging study.
Tumor imaging
After the U87MG tumor-bearing mice were anesthetized as described before, 200 μL of L1013 NPs (3.7 mg mL‒1) were intravenously injected into the mice for tumor imaging. With the aid of tumor imaging, the subcutaneous U87MG tumor was resected 72 hrs postinjection of contrast agents. Afterwards, the resected tumor and postoperative mice were subjected to fluorescence imaging as before. All the fluorescence images were excited by 4.6 mW cm‒2 808 nm diode laser with a 1250 nm LP for signal collection. The exposure time was 100 ms. Finally, the resected tumor was fixed with 4% paraformaldehyde in PBS for 24 hrs and embedded in paraffin. Sections (5 μm) were stained with HE.
Results and discussion
Design, synthesis, and characterization of BTPPA molecules
The chemical structure of the BTPPA molecule is shown in Figure 1A. Details of the synthesis and characterization of BTPPA are described in the
 | Figure 1 Characterization of BTPPA molecule and L1013 NPs. (A) Chemical structure of BTPPA molecule. (B) PL spectral of BTPPA molecule in THF/water mixtures with different water fractions (fw) at a concentration of 10 μg mL‒1. (C) Plot of PL peak intensity of BTPPA versus fw of THF/water mixture. I0 and I are the PL peak intensity in pure THF (fw =0) and THF/water mixture with specific fw. (D) Schematic illustration of L1013 NP. (E) DLS and TEM (inset) measurement results. (F) Normalized UV-vis-NIR spectrum and PL spectrum of L1013 NPs in water. Inset: Fluorescence imaging of L1013 NPs under different LP filters (excitation at 808 nm with a power density of 4.6 mW cm‒2). |
To confirm the AIE characteristics of BTPPA molecule, we measured its photoluminescence spectra in a mixture of tetrahydrofuran (THF) and water (Figure 1B), where the fraction of water (fw) was varied to fine-tune solvent polarity and the extent of BTPPA aggregation. Fluorescence intensity decreased with increasing fw (up to 40%) (Figure 1C) because the increasing polarity of the solvent caused a transformation to a twisted intramolecular charge transfer (TICT) state. The presence of TICT was confirmed using a density functional theory calculation (
Preparation and characterization of L1013 NPs
BTPPA molecules were encapsulated into NPs using a nanoprecipitation method, with 1,2-distearoyl-sn-glycero-3-phosphoetanolamine-N-[methoxy(polyethylene glycol)-2000] (DSPE-PEG2000) as a matrix, to form L1013 NPs (Figure 1D). TEM revealed that L1013 NPs had a spherical shape with an average diameter of 38 nm, which was consistent with the results of dynamic light scattering (~57 nm) (Figure 1E). The zeta potential of L1013 NPs in PBS (pH =7.4) was −36 mV, suggesting a high stability under physiological conditions. Consistent with this, we found that NP size did not change when L1013 NPs were kept at room temperature for 2 weeks (
L1013 NPs had an absorption peak at 761 nm with a mass extinction coefficient of 9.6 mL cm‒1·mg‒1 and exhibited an emission peak at 1013 nm with a tail extending to 1400 nm, allowing the measurement of fluorescence signals in the NIR-II region upon excitation at NIR-I region (Figure 1F). The NIR-II fluorescence signals were still strong even under a 1250 nm long-pass (LP) filter (inset of Figure 1F). The QY of L1013 NPs in water was determined to be 9.9% (
Evaluation of in vitro and in vivo toxicity of L1013 NPs
We next studied the cytotoxicity of L1013 NPs, using a water-soluble tetrazolium (WST-8) assay. The metabolic viability of LO2 cells (normal hepatic cells) remained higher than 91.5% after incubation for 72 hrs, even at an ultrahigh concentration of 250 μg mL‒1, revealing neglectable cytotoxicity (
Pharmacokinetics and biodistribution of L1013 NPs
We studied the pharmacokinetics of L1013 NPs by performing intravenous injection into nude mice. The blood vessels and liver were immediately visualized after the injection of L1013 NPs, and these signals persisted for at least 1 hr (Figure 2A). Afterward, fluorescence signals gradually disappeared from the blood vessels and accumulated in the liver (Figure 2A). Ex vivo biodistribution studies at 72 hrs postinjection showed that L1013 NPs mainly accumulated in the reticuloendothelial system, primarily in liver, spleen, and gut (Figure 2B and C). According to the previous studies,47,48 the L1013 NPs might be gradually degradated by the enzymes in the endosomes/lysosomes of the Kupffer cells, endothelial cells, B cells, and macrophages.
 | Figure 2 Biodistribution and pharmacokinetics of L1013 NPs. (A) Time course of fluorescence images of L1013 NPs administrated nude mice under the excitation of 7.9 mW cm‒2 808 nm diode laser (1000 nm LP). (B–C) Ex biodistribution of L1013 NPs in the spleen, liver, kidney, stomach, heart, lung ,and gut 72 hrs postinjection. (D) Concentration of L1013 NPs in the blood (black line) and feces (red line) at different time points. Bars show mean ± SD, n=3. |
To study excretion kinetics, we performed intravenous injection of 740 µg L1013 NPs into C57Bl/6 mice (n=3) and collected blood, urine, and feces over the following 72 hrs. We found that the concentration of L1013 NPs in the blood reached 267.7±6.4 μg mL‒1 at 6 hrs postinjection and the blood half-life time (t1/2) was determined to be 13.3±1.2 hrs (Figure 2D), which was much longer than most previously reported NIR-II fluorophores.2,7,21,22,26 Using the NIR-II imaging system, the signals of L1013 NPs could not be detected under the concentration of 1.0 µg mL‒1 (
NIR-II imaging for cerebral vessels, hindlimb vessels, and lymph vessels
To investigate the NIR-II imaging performance of L1013 NPs, we firstly performed intravenous injection of L1013 NPs into C57Bl/6 mice and attempted to visualize the cerebral vasculature. Two minutes postinjection of L1013 NPs, under the excitation of an 808 nm diode laser (40 mW cm‒2, 1000 nm LP), we were able to clearly and sharply visualize the cerebral vessels, including the inferior cerebral veins, the superior sagittal sinus (SSS), and the transverse sinus, through the intact scalp and skull (Figure 3A). The cross-sectional intensity profiles of the SSS vessel with L1013 NP imaging exhibited narrow and sharp characteristics. The signal/background (S/B) ratio with L1013 NPs–based imaging was 6.56 (Figure 3B). We next fitted Gaussian functions to the intensity curves. The full-width half maximum (FWHM) of the Gaussian was used to represent the measured diameter of the vessel,8 and for L1013 NPs was 368 µm (Figure 3B). Notably, using L1013 NP imaging, we were able to measure vessels with diameters as small as 33.5 μm, which is comparable to the previous report (
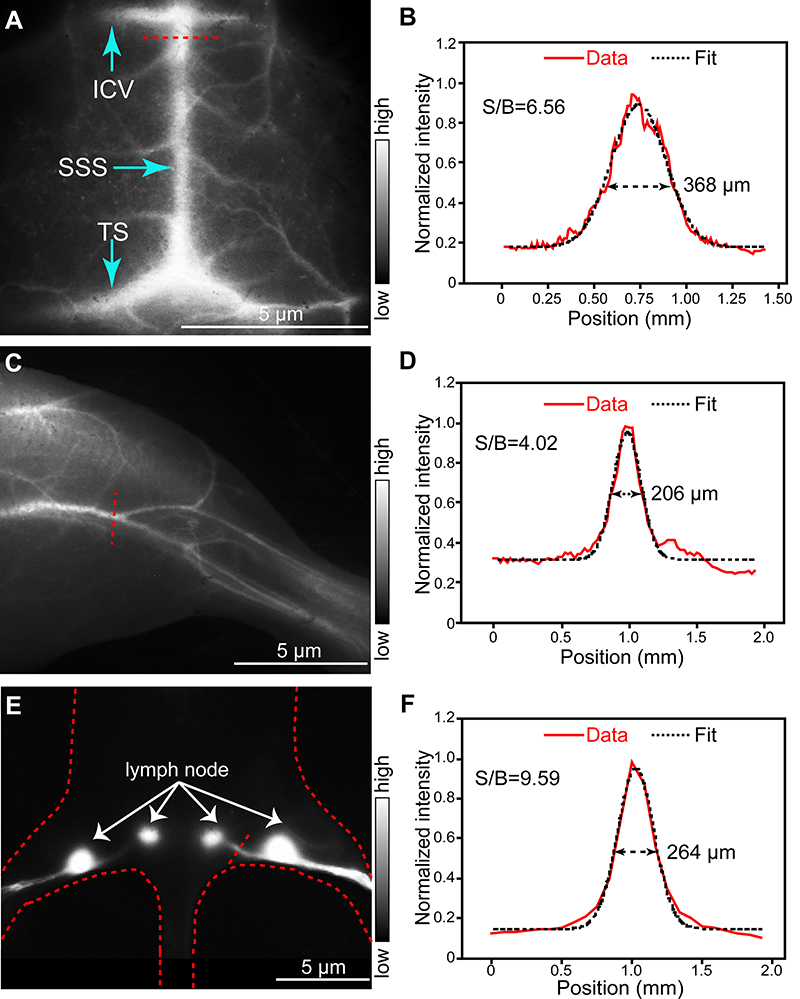 | Figure 3 Fluorescence images of cerebral vessels, hindlimb vasculature, and lymphatic drainage using L1013 NPs. (A) Transcranial fluorescence images of cerebral vessels 2 mins following intravenous injection of L1013 NPs. Red dotted lines indicate positions where cross-sectional intensity width was measured, across superior sagittal sinus (SSS). (B) Cross-sectional intensity (red solid line) and Gaussian fit fluorescence intensity profiles (black dotted line) with L1013 NPs imaging. (C–D) Same as (A–B), but for hindlimb vessels. (E–F) Same as (A–B), but for the groin lymphatic system. All fluorescence images were excited by a diode laser at 808 nm (cerebral and hindlimb imaging: 40 mW cm‒2; lymphatic imaging: 14 mW cm‒2). A filter of 1000 nm LP was used for cerebral and hindlimb imaging and 1250 nm LP was used for lymphatic imaging. Abbreviation: S/B, signal/background ratio. |
Secondly, we found that the hindlimb vessel was also clearly identified using L1013 NPs–based imaging (Figure 3C). L1013 NP imaging provided a diameter measurement (Gaussian FWHM) of 206 μm and S/B of 4.02 (Figure 3D). Furthermore, L1013 NPs allowed NIR-II dynamic imaging with a fast video rate of 11.3 frames per second (
Thirdly, lymphatic imaging was assessed by intradermal injection of L1013 NPs into both footpads of nude mice. Under irradiation with an 808 nm diode laser (14 mW cm‒2), the popliteal and sacral lymph nodes and the lymphatic ducts between the two lymph nodes were unequivocally visualized 1 min following injection of L1013 NPs (Figure 3E). The S/B of the lymphatic duct was 9.59 while the diameter was 264 μm (Figure 3F). Taken together, these results suggest that L1013 NPs–based NIR-II imaging has considerable potential for vascular and lymphatic imaging.
NIR-II imaging for cerebrovascular disease
Encouraged by the high-quality imaging of cerebral vessels, we tested the use of L1013 NP imaging for diagnosis of cerebrovascular disease in two mouse models of stroke. We surgically induced middle cerebral artery occlusion (MCAO) in the left cerebral hemisphere of C57Bl/6 mice as a model of cerebral ischemic stroke, while the right cerebral hemisphere was used as a control. After intravenous injection of L1013 NPs into the MCAO mice (n=3), noninvasive NIR-II imaging showed a clear reduction in visible cerebral vasculature in the left cerebral hemisphere, compared to the right cerebral hemisphere (Figure 4A), reflecting the reduced perfusion and ischemia in the left hemisphere. For comparison, healthy mice exhibited almost identical blood perfusion patterns in both cerebral hemispheres under L1013 NP imaging (
 | Figure 4 L1013 NPs-based NIR-II fluorescence imaging in two mouse models of stroke. (A) NIR-II fluorescence imaging of cerebral vessels in C57Bl/6 mice with MCAO. (B) Normalized fluorescence intensity of areas outlined in red in (A). (C–D) Same as (A–B), but for the hemorrhagic stroke model. Red asterisk indicates the craniotomy point. Bars show mean ± SD; n=3, *p<0.05.Abbreviation: MCAO, middle cerebral artery occlusion. |
Additionally, we established a mouse model of hemorrhagic stroke, by injecting autologous blood (10 µL of blood drawn post-L1013 NPs injection) into the subcortical parenchyma of the right cerebral hemisphere. As expected, we observed NIR-II hyperfluorescence in the right cerebral hemisphere (Figure 4C), and the relative fluorescence intensity ratio of right/left cerebral hemisphere was determined to be 1.9±0.5 (n=3, Figure 4D). Observation of postmortem brain tissue slices under the microscope also confirmed the hemorrhagic stroke model (
NIR-II imaging for tumor
To further demonstrate the utility of L1013 NPs for in vivo imaging, we performed noninvasive imaging of tumors in mice. We injected L1013 NPs into U87MG tumor-bearing nude mice (n=3), and performed NIR-II fluorescence imaging under excitation by an 808 nm diode laser (4.6 mW cm‒2, 1250 nm LP) over 72 hrs. At 2 hrs postinjection, U87MG tumors and surrounding vessels were clearly resolved (Figure 5A). Afterwards, the fluorescence signals of L1013 NPs gradually reduced in the blood vessels, but increased in the tumors, due to the accumulation of L1013 NPs, which can be attributed to the enhanced permeability and retention effect.51 Over the period of 24–72 hrs postinjection, the fluorescence signals from the tumors became even more enhanced, indicating accumulation of L1013 NPs in the tumors. The clearly demarcated boundaries provided by such imaging are vital for successful image-guided tumor resection surgery.
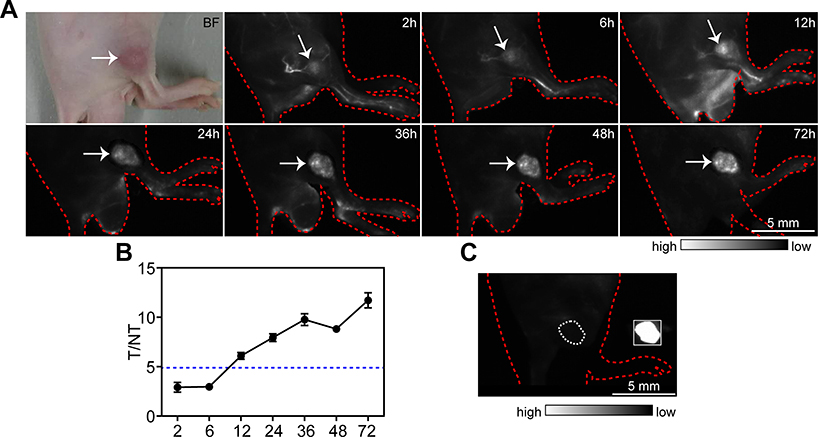 | Figure 5 Tumor imaging using L1013 NPs as NIR-II fluorophore. (A) Tumor imaging in U87MG tumor-bearing nude mice using L1013 NPs over 72 hrs. All fluorescence images were obtained using a 1250 nm LP filter for signal collection (excitation at 808 nm with a power density of 4.6 mW cm‒2). Arrows indicate the subcutaneous U87MG tumor. (B) Tumor-to-normal tissue (T/NT) imaging ratios in L1013 NPs-based tumor imaging over 72 hrs. Data are plotted as mean ± SD; n=3. (C) Fluorescence image of an example U87MG tumor-bearing mouse following L1013 NPs (NIR-II) imaging-guided tumorectomy. Inset shows the resected tumor. |
The tumor/normal tissue (T/NT) ratio of L1013 NPs imaging gradually increased and finally reached 11.7±1.3, surpassing the Rose criterion of 5, which is the threshold at which it is considered possible to allow exact identification of a tumor (Figure 5B). It is worth pointing out that the power density of the excitation diode laser used for tumor imaging in this study (4.6 mW cm‒2) was more than an order of magnitude lower than that used in previous reports (~100 mW cm‒2).4,5,12
With the aid of sharply demarcated tumor imaging at 72 hrs postinjection of L1013 NPs, we were able to precisely resect subcutaneous U87MG tumors (Figure 5C). Post-resection histology also validated the exact identification of tumor boundary (
Conclusion
In conclusion, we have presented the preparation of L1013 NPs: organic NPs with NIR-II emission and AIE characteristics, and we have demonstrated their capabilities for noninvasive fluorescence imaging in mice. L1013 NPs possess an absorption maximum at 761 nm, with a NIR-II emission spectrum extending to 1400 nm. They exhibit a high QY of 9.9% for full spectrum, and a QY of 6% in the NIR-II region (>1000 nm), which is higher than most reported NIR-II nanofluorophores so far. L1013 NPs also have excellent photostability and negligible toxicity in vitro or in vivo. We have demonstrated the utility of L1013 NPs for several noninvasive fluorescence imaging roles, including cerebral vessels, hindlimb vessels, lymphatics, stroke, and tumors. L1013 NPs–based imaging provides an unusually high T/NT ratio of 11.7±1.3. Also, as we have shown here, imaging can be achieved using a very low laser density (4.6‒40 mW cm‒2) and short exposure time (40‒100 ms). Together, these results demonstrate the potential of L1013 NPs for clinical application. These tools may be particularly useful for localization and resection of superficial tumors, since fluorescence can be visualized “under the scalpel” and in real time during surgery, providing surgeons with an additional and rich dimension of information with which to optimize their resection margins. In the future, we aim to develop AIE-based NIR-II NPs with even longer wavelengths of absorption and emission, in order to obtain higher penetration depth and higher signal to noise ratio.
Acknowledgments
The authors are grateful to the National Natural Science Foundation of China (21402219 and 81700880), NanjingTech Startup Grant (38274017115), China Postdoctoral Science Foundation (2018M643859), Chongqing Research Program of Basic Research and Frontier Technology (cstc2017jcyjAX0424) and Foundation of Southwest Hospital (SWH2016ZDCX1011) for financial support.
Disclosure
The authors report no conflicts of interest in this work.
References
1. Hong G, Antaris AL, Dai H. Near-infrared fluorophores for biomedical imaging. Nat Biomed Eng. 2017;1:0010. doi:10.1038/s41551-016-0010
2. Welsher K, Sherlock SP, Dai H. Deep-tissue anatomical imaging of mice using carbon nanotube fluorophores in the second near-infrared window. Proc Natl Acad Sci U S A. 2011;108(22):8943–8948. doi:10.1073/pnas.1014501108
3. Diao S, Hong G, Antaris AL, et al. Biological imaging without autofluorescence in the second near-infrared region. Nano Res. 2015;8(9):3027–3034. doi:10.1007/s12274-015-0808-9
4. Robinson JT, Hong G, Liang Y, Zhang B, Yaghi OK, Dai H. In vivo fluorescence imaging in the second near-infrared window with long circulating carbon nanotubes capable of ultrahigh tumor uptake. J Am Chem Soc. 2012;134(25):10664–10669. doi:10.1021/ja303737a
5. Hong G, Robinson JT, Zhang Y, et al. In vivo fluorescence imaging with Ag2S quantum dots in the second near-infrared region. Angew Chem Int Ed. 2012;51(39):9818–9821. doi:10.1002/anie.201206059
6. Xu G, Yan Q, Lv X, et al. Imaging of colorectal cancers using activatable nanoprobes with second near-infrared window emission. Angew Chem Int Ed. 2018;130(14):3688–3692. doi:10.1002/ange.201712528
7. Hong G, Lee JC, Robinson JT, et al. Multifunctional in vivo vascular imaging using near-infrared II fluorescence. Nat Med. 2012;18:1841–1846. doi: 10.1038/nm.2995
8. Hong G, Diao S, Chang J, et al. Through-skull fluorescence imaging of the brain in a new near-infrared window. Nat Photonics. 2014;8:723–730. doi:10.1038/nphoton.2014.166
9. Ghosh D, Bagley AF, Na YJ, Birrer MJ, Bhatia SN, Belcher AM. Deep, noninvasive imaging and surgical guidance of submillimeter tumors using targeted M13-stabilized single-walled carbon nanotubes. Proc Natl Acad Sci U S A. 2014;111(38):13948–13953. doi:10.1073/pnas.1400821111
10. Wang W, Ma Z, Zhu S, et al. Molecular cancer imaging in the second near-infrared window using a renal-excreted NIR-II fluorophore-peptide probe. Adv Mater. 2018;30(22):1800106. doi:10.1002/adma.201800106
11. Welsher K, Liu Z, Sherlock SP, et al. A route to brightly fluorescent carbon nanotubes for near-infrared imaging in mice. Nat Nanotechnol. 2009;4:773–780. doi:10.1038/nnano.2009.294
12. Yi H, Ghosh D, Ham M-H, et al. M13 phage-functionalized single-walled carbon nanotubes as nanoprobes for second near-infrared window fluorescence imaging of targeted tumors. Nano Lett. 2012;12(3):1176–1183. doi:10.1021/nl2031663
13. Zhang Y, Hong G, Zhang Y, et al. Ag2S quantum dot: a bright and biocompatible fluorescent nanoprobe in the second near-infrared window. ACS Nano. 2012;6(5):3695–3702. doi:10.1021/nn301218z
14. Dong B, Li C, Chen G, et al. Facile synthesis of highly photoluminescent Ag2Se quantum dots as a new fluorescent probe in the second near-infrared window for in vivo imaging. Chem Mater. 2013;25(12):2503–2509. doi:10.1021/cm400812v
15. Nakane Y, Tsukasaki Y, Sakata T, Yasuda H, Jin T. Aqueous synthesis of glutathione-coated PbS quantum dots with tunable emission for non-invasive fluorescence imaging in the second near-infrared biological window (1000–1400 nm). Chem Commun. 2013;49(69):7584–7586. doi:10.1039/c3cc44000a
16. Zebibula A, Alifu N, Xia L, et al. Ultrastable and biocompatible NIR-II quantum dots for functional bioimaging. Adv Funct Mater. 2018;28(9):1703451. doi:10.1002/adfm.201703451
17. Shao W, Chen G, Kuzmin A, et al. Tunable narrow band emissions from dye-sensitized core/shell/shell nanocrystals in the second near-infrared biological window. J Am Chem Soc. 2016;138(50):16192–16195. doi:10.1021/jacs.6b08973
18. Liu L, Wang S, Zhao B, et al. Er3+ sensitized 1530 nm to 1180 nm second near-infrared window upconversion nanocrystals for in vivo biosensing. Angew Chem Int Ed. 2018;57(25):7518–7522. doi:10.1002/anie.201802889
19. Tao Z, Hong G, Shinji C, et al. Biological imaging using nanoparticles of small organic molecules with fluorescence emission at wavelengths longer than 1000 nm. Angew Chem Int Ed. 2013;52(49):13002–13006. doi:10.1002/anie.201307346
20. Hong G, Zou Y, Antaris AL, et al. Ultrafast fluorescence imaging in vivo with conjugated polymer fluorophores in the second near-infrared window. Nat Commun. 2014;5:4206. doi:10.1038/ncomms5972
21. Antaris AL, Chen H, Cheng K, et al. A small-molecule dye for NIR-II imaging. Nat Mater. 2016;15(2):235–242. doi:10.1038/nmat4476
22. Zhang X-D, Wang H, Antaris AL, et al. Traumatic brain injury imaging in the second near-infrared window with a molecular fluorophore. Adv Mater. 2016;28(32):6872–6879. doi:10.1002/adma.201600706
23. Sun Y, Qu C, Chen H, et al. Novel benzo-bis(1,2,5-thiadiazole) fluorophores for in vivo NIR-II imaging of cancer. Chem Sci. 2016;7(9):6203–6207. doi:10.1039/c6sc01561a
24. Cheng K, Chen H, Jenkins C, et al. Synthesis, characterization, and biomedical applications of a targeted dual-modal near-infrared-II fluorescence and photoacoustic imaging nanoprobe. ACS Nano. 2017;11(12):12276–12291. doi:10.1021/acsnano.7b05966
25. Shou K, Qu C, Sun Y, et al. Multifunctional biomedical imaging in physiological and pathological conditions using a NIR‐II Probe. Adv Funct Mater. 2017;27(23):1700995. doi:10.1002/adfm.201700995
26. Wan H, Yue J, Zhu S, et al. A bright organic NIR-II nanofluorophore for three-dimensional imaging into biological tissues. Nat Commun. 2018;9(1):1171. doi:10.1038/s41467-018-03505-4
27. Yang Q, Hu Z, Zhu S, et al. Donor engineering for NIR-II molecular fluorophores with enhanced fluorescent performance. J Am Chem Soc. 2018;140(5):1715–1724. doi:10.1021/jacs.7b10334
28. Yang Q, Ma Z, Wang H, et al. Rational design of molecular fluorophores for biological imaging in the NIR-II window. Adv Mater. 2017;29(12):1605497. doi:10.1002/adma.201700681
29. Shou K, Tang Y, Chen H, et al. Diketopyrrolopyrrole-based semiconducting polymer nanoparticles for in vivo second near-infrared window imaging and image-guided tumor surgery. Chem Sci. 2018;9(12):3105–3110. doi:10.1039/c8sc00206a
30. Mei J, Leung NLC, Kwok RTK, Lam JWY, Tang BZ. Aggregation-induced emission: together we shine, united we soar! Chem Rev. 2015;115(21):11718–11940. doi:10.1021/acs.chemrev.5b00263
31. Ding D, Li K, Liu B, Tang BZ. Bioprobes based on AIE fluorogens. Accounts Chem Res. 2013;46(11):2441–2453. doi:10.1021/ar3003464.
32. Mei J, Hong Y, Lam JWY, Qin A, Tang Y, Tang BZ. Aggregation-induced emission: the whole is more brilliant than the parts. Adv Mater. 2014;26(31):5429–5479. doi:10.1002/adma.201401356
33. Qin W, Ding D, Liu Jet al. Biocompatible nanoparticles with aggregation-induced emission characteristics as far-red/near-infrared fluorescent bioprobes for in vitro and in vivo imaging applications. Adv Funct Mater. 2012;22(4):771–779. doi:10.1002/adfm.201102191.
34. Li K, Qin W, Ding D, et al. Photostable fluorescent organic dots with aggregation-induced emission (AIE dots) for noninvasive long-term cell tracing. Sci Rep. 2013;3:1150. doi:10.1038/srep01150.
35. Gao Y, Feng G, Jiang T, et al. Biocompatible nanoparticles based on diketo-pyrrolo-pyrrole (DPP) with aggregation-induced red/NIR emission for in vivo two-photon fluorescence imaging. Adv Funct Mater. 2015;25(19):2857–2866. doi:10.1002/adfm.201500010
36. Wu W, Mao D, Hu F, et al. A highly efficient and photostable photosensitizer with near-infrared aggregation-induced emission for image-guided photodynamic anticancer therapy. Adv Mater. 2017;29(33):1700548. doi:10.1002/adma.201700681
37. Wang Y, Chen M, Alifu N, et al. Aggregation-induced emission luminogen with deep-red emission for through-skull three-photon fluorescence imaging of mouse. ACS Nano. 2017;11(10):10452–10461. doi:10.1021/acsnano.7b05645
38. Qi J, Chen C, Zhang X, et al. Light-driven transformable optical agent with adaptive functions for boosting cancer surgery outcomes. Nat Commun. 2018;9(1):1848. doi:10.1038/s41467-018-04222-8
39. Sheng Z, Guo B, Hu D, et al. Bright aggregation-induced-emission dots for targeted synergetic NIR-II fluorescence and NIR-I photoacoustic imaging of orthotopic brain tumors. Adv Mater;2018. e1800766. doi:10.1002/adma.201800766.
40. Shi Y, Jiang X, Zhang L, et al. Endothelium-targeted overexpression of heat shock protein 27 ameliorates blood–brain barrier disruption after ischemic brain injury. Proc Natl Acad Sci U S A. 2017;114(7):e1243. doi:10.1073/pnas.1621174114
41. Borsello T, Clarke PGH, Hirt L, et al. A peptide inhibitor of c-Jun N-terminal kinase protects against excitotoxicity and cerebral ischemia. Nat Med. 2003;9:1180–1186. doi:10.1038/nm911
42. Xiong XY, Liu L, Wang FX, et al. Toll-like receptor 4/MyD88–mediated signaling of hepcidin expression causing brain iron accumulation, oxidative injury, and cognitive impairment after intracerebral hemorrhage. Circulation. 2016;134(14):1025–1038. doi:10.1161/CIRCULATIONAHA.116.021881
43. Liu J, Chen C, Ji S, et al. Long wavelength excitable near-infrared fluorescent nanoparticles with aggregation-induced emission characteristics for image-guided tumor resection. Chem Sci. 2017;8(4):2782–2789. doi:10.1039/c6sc04384d
44. Murphy J, Beard M, Norman A, et al. PbTe colloidal nanocrystals: synthesis, characterization, and multiple exciton generation. J Am Chem Soc. 2006;128(10):3241–3247. doi:10.1021/ja0574973
45. Ji Q, Chaowei S, Abudureheman Z, et al. Real-time and high-resolution bioimaging with bright aggregation-induced emission dots in short-wave infrared region. Adv Mater. 2018;30(12):1706856. doi:10.1002/adma.201706856
46. Li B, Lu L, Zhao M, Lei Z, Zhang F. An efficient 1064 nm NIR-II excitation fluorescent molecular dye for deep-tissue high-resolution dynamic bioimaging. Angew Chem Int Ed. 2018;57(25):7483–7487. doi:10.1002/anie.201801226
47. Feliu N, Docter D, Heine M, et al. In vivo degeneration and the fate of inorganic nanoparticles. Chem Soc Rev. 2016;45(9):2440–2457. doi:10.1039/c5cs00699f
48. Tsoi KM, MacParland SA, Ma XZ, et al. Mechanism of hard-nanomaterial clearance by the liver. Nat Mater. 2016;15(11):1212–1221. doi:10.1038/nmat4718
49. Soo Choi H, Liu W, Misra P, et al. Renal clearance of quantum dots. Nat Biotechnol. 2007;25:1165–1170. doi:10.1038/nbt1340
50. Chinen AB, Guan CM, Ferrer JR, Barnaby SN, Merkel TJ, Mirkin CA. Nanoparticle probes for the detection of cancer biomarkers, cells, and tissues by fluorescence. Chem Rev. 2015;115(19):10530–10574. doi:10.1021/acs.chemrev.5b00321
51. Gao X, Cui Y, Levenson RM, Chung LWK, Nie S. In vivo cancer targeting and imaging with semiconductor quantum dots. Nat Biotechnol. 2004;22:969–976. doi:10.1038/nbt994
 © 2019 The Author(s). This work is published and licensed by Dove Medical Press Limited. The
full terms of this license are available at https://www.dovepress.com/terms
and incorporate the Creative Commons Attribution
- Non Commercial (unported, 3.0) License.
By accessing the work you hereby accept the Terms. Non-commercial uses of the work are permitted
without any further permission from Dove Medical Press Limited, provided the work is properly
attributed. For permission for commercial use of this work, please see paragraphs 4.2 and 5 of our Terms.
© 2019 The Author(s). This work is published and licensed by Dove Medical Press Limited. The
full terms of this license are available at https://www.dovepress.com/terms
and incorporate the Creative Commons Attribution
- Non Commercial (unported, 3.0) License.
By accessing the work you hereby accept the Terms. Non-commercial uses of the work are permitted
without any further permission from Dove Medical Press Limited, provided the work is properly
attributed. For permission for commercial use of this work, please see paragraphs 4.2 and 5 of our Terms.