Back to Journals » Local and Regional Anesthesia » Volume 8
A retrospective study to correlate breech presentation and enhanced risk of postspinal hypotension during cesarean delivery
Authors Jain A, Pandey S, Kumar R, Sethi C, Sharma S
Received 8 July 2015
Accepted for publication 23 October 2015
Published 16 December 2015 Volume 2015:8 Pages 129—134
DOI https://doi.org/10.2147/LRA.S91991
Checked for plagiarism Yes
Review by Single anonymous peer review
Peer reviewer comments 3
Editor who approved publication: Dr Stefan Wirz
Anshul Jain,1 Shivali Pandey,1 Roopesh Kumar,1 Chavi Sethi,1 Sanjya Sharma2
1Department of Anaesthesiology, 2Department of Gynecology and Obstetrics, Maharani Laxmi Bai Medical College, Jhansi, India
Background: Subarachnoid blockade for cesarean section still poses a threat of profound hypotension and can result in unstable maternal and fetal hemodynamics. The correlation of fetal breech and vertex presentation with the occurrence of hypotension under spinal anesthesia is reviewed in this retrospective, double-blind study.
Patients and methods: The study was conducted on pregnant females scheduled for a lower segment cesarean section between January 2014 and December 2014. After applying inclusion criteria, 568 patients were recruited in the study out of which 363 had vertex and 184 patients had breech presentation. They were divided into two groups, Group I and Group II. The monitoring and therapeutic data (blood pressure, heart rate, arterial oxygen saturation, and dose of vasopressor/atropine) recovered from automated data analysis were analyzed retrospectively for prevalence of hypotension, bradycardia, and hypotension with bradycardia and nausea ± vomiting.
Results: Among Group I, prevalence of hypotension, bradycardia, and hypotension together with bradycardia was 152 (41.83%) patients, eight (2.20%) patients, and seven (1.92%) patients, respectively. In Group II, the prevalence of hypotension, bradycardia, and hypotension with bradycardia was 93 (50.5%) patients, five (2.71%) patients, and six (3.2%) patients, respectively. The difference between the two groups was statistically significant for hypotension. For Group I, 152 patients (41.87%) experienced one, 23 patients (6.33%) experienced two, and three patients (0.82%) experienced three episodes of hypotension. In Group II, 93 (50.5%), 19 (7.89%), and two (1.08%) patients experienced such episodes. The difference was significant with respect of one and two episodes. The prevalence of intraoperative nausea was 11.01% (40 patients) in Group I, whereas 11.41% (21 patients) in Group II. Intraoperative vomiting occurred in 19 patients (5.23%) of Group I and 14 patients (7.60%) of Group II. The height of the block was comparable in both the groups for T6, and the difference was significant in respect to T4 level.
Conclusion: Incidence of hypotension is more in pregnant females with breech fetal presentation.
Keywords: breech, cesarean section, spinal anesthesia, hypotension
Introduction
Spinal anesthesia is the most commonly employed technique for lower segment cesarean section nowadays, though being safe, the commonest problem associated with this technique, however, remains the onset of profound hypotension just after administration of the block,1,2 and this adverse effect clearly correlates with the maternal and fetal mortality.3
Identification of major risk factors for hypotension helps in timely therapeutic intervention. Earlier studies have identified extremes of age, table tilt, use of intrathecal morphine, uterine displacement, estimated blood loss >500 mL, analgesia level > T4, as risk factors for intraoperative hypotension during cesarean section,2,4 but none of the studies conducted so far have co-related fetal factors with maternal hypotension. Fetal malpresentation is one of the important factors and may itself be the indication of cesarean delivery. Breech presentation is the commonest form of malpresentation of the fetus in which the buttocks or lower extremities occupy or are in direct relationship with the maternal pelvic inlet. It accounts for 3%–4% of infants born at term.5 Many patients with breech presentation are managed through cesarean delivery as it decreases perinatal mortality and morbidity by two-third without much increase in maternal morbidity.6,7
In breech presentation, the largest and densest part that is fetal head, remains intrauterine and thus can produce accentuated compression of inferior vena cava and aorta leading to reduced preload and cardiac output. We propose a hypothesis that “breech presentation enhances the risk of hypotension in spinal anesthesia during cesarean section”. To prove or deny this hypothesis, we conducted a retrospective study in our institution using data from the automated record keeping system.
Patients and methods
After the approval of the institutional ethical committee affiliated to Maharani Laxmi Bai Medical College and Hospital, Jhansi, and obtaining written informed consent from all of the patients, this retrospective double-blind study was conducted in the Maharani Laxmi Bai Medical College Hospital, a 1,500-bed government hospital. The population studied consisted of pregnant females who were posted for cesarean section between January 2014 and December 2014.
The medical records of these patients were reviewed for age, weight, height, parity, indication of cesarean section, technique of anesthesia, fetal presentation, the presence of fetal distress, American Society of Anesthesiologists (ASA) categorization, and any other associated abnormality. For ASA categorization, we adopted G modifier as suggested by Barbeito et al for pregnancy to the current ASA categorization.8 The ASA 1G patients in whom cesarean section was performed under single shot spinal anesthesia in left lateral position using hyperbaric bupivacaine 0.5% were included in the study, who fulfilled following inclusion criteria:
- Age group between 25 and 35 years
- Height ≥150 cm <180 cm
- Weight >50 kg <100 kg (50–100 kg)
- Labor stage ≤1
- Fetal heart rate ≥120 beats per minute
- Fetal weight ≤3,500 g
- Lower segment cesarean section
- Preloading with 500 mL of ringer lactate before administration of spinal anesthesia
- Site of administering intrathecal block L3–L4
- Volume of hyperbaric bupivacaine 0.5% administered 2.0 mL.
Patients who met the inclusion criteria were divided into two groups according to fetal presentation. Group I: pregnant females posted for cesarean section with vertex fetal presentation and Group II: pregnant females posted for cesarean section with breech fetal presentation. After group allocation, the names were given to the researcher to analyze their perioperative monitoring variables using data from the automated record keeping system. The analyst had no knowledge about the allocation of these groups.
Our institution uses NarkoData version 3.0 (IMESCO, Giessen, Germany),9 software for recording and storing perioperative data. It collects all relevant clinical data throughout the procedure and also includes biometrical data, drugs administered, laboratory results, and data from vital parameters. The quality assurance of this software is as per the German Society of Anesthesiology and Intensive Care Medicine.10
As a departmental protocol, measuring of blood pressure was done at baseline, immediately after administration of subarachnoid block, every 3 minutes until delivery and every 5 minutes thereafter, hemoglobin oxygen saturation (SpO2) and an electrocardiogram are also monitored continuously in whole perioperative period. Blood pressure was monitored by automated noninvasive blood pressure monitor (Dräger, Infinity Vista XL; Dräger Medical, GmbH, Lu″beck, Germany) based on oscillometry. Any episode of hypotension was treated by injection ephedrine 6 mg/IV and bradycardia was treated with atropine 0.6 mg IV. Criteria for defining hypotension was either systolic blood pressure <90 mmHg or a 10% decrease from the baseline in patients with baseline blood pressure <90 mmHg and heart rate <60 beats per minute defined bradycardia.
All the relevant patient data was collected and analyzed. The following data were used for statistical analysis: perioperative blood pressure and heart rate, SpO2, dose of vasopressor/atropine administered, and episodes of nausea ± vomiting. Total operating time and maximum height of block were also analyzed for both groups.
For statistical analysis, we used statistics program SPSS version 11.5; IBM, Bengaluru, India. The dichotomous variables “hypotension” and “bradycardia” after spinal anesthesia (yes/no) were used as a target criterion. For analysis, we used Student’s t-test, z-test, and chi-square test.
Results
Overall, 908 patients underwent cesarean section between January and December out of which 96 were given general anesthesia, whereas spinal anesthesia was the initial anesthetic technique in 812 patients. On the basis of inclusion criteria, 568 patients were recruited in the study in which 363 have vertex presentation and 184 have breech presentation. Twenty-one patients with fetal presentation as face/footling/cord were later on excluded from the study. The baseline and demographic data of parturient receiving spinal anesthesia are shown in Table 1. The data were statistically comparable in both groups.
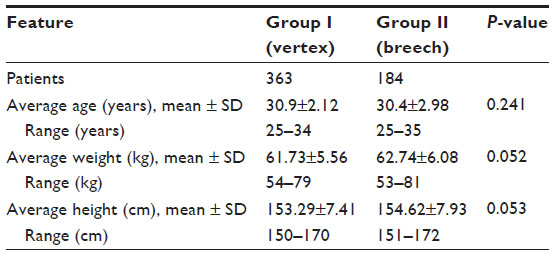 | Table 1 Demographic details |
Table 2 represents baseline hemodynamic variables, total surgical time, and neonatal birth weight in both groups. The preoperative heart rate was 89.8±9.76 beats per minute in Group I and 90.2±11.21 beats per minute in Group II. They were statistically comparable. The preoperative blood pressure, systolic, and diastolic in Group I were 118.2±9.2 mmHg and 82.3±7.6 mm Hg, respectively, and in Group II, it was 117.2±10.1 mmHg for systolic and 80.9±8.9 for diastolic. The difference was statistically insignificant.
 | Table 2 Characteristics of baseline hemodynamic variables and duration of surgery |
The time between administrations of spinal to delivery was 12.1±2.1 minute in Group I and 13.8±2.6 minute in Group II; the difference was statistically highly significant. Time between delivery and end of surgery was statistically equivalent in both groups. However, the total duration of surgery was more in Group I and the difference was statistically significant. Neonatal birth weight was 2,604.8±298.8 g in Group I and 2,575.2±284.1 g in Group II. They were statistically comparable.
Table 3 represents the prevalence of perioperative side effects. Hypotension was seen in 245 patients (44.78%), bradycardia was seen in 13 (2.37%) patients, and hypotension with bradycardia was present in 13 (2.37%) patients. Among Group I, prevalence of hypotension, bradycardia, and hypotension together with bradycardia were 152 (41.87%) patients, eight (2.20%) patients, and seven (1.92%) patients, respectively. In Group II, 93 (50.5%) patients, five (2.71%) patients, and six (3.2%) patients sustained hypotension, bradycardia, and hypotension with bradycardia, respectively. On statistical comparison, the difference was significant with respect to the prevalence of hypotension.
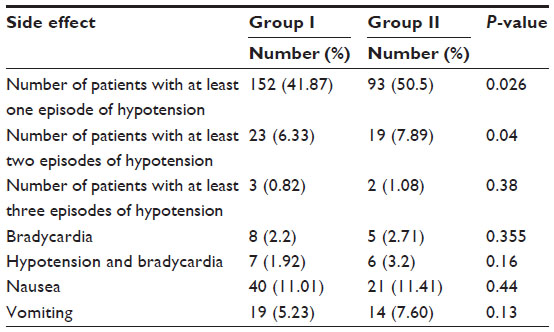 | Table 3 Represent prevalence of side effects |
Among Group I, 152 (41.87%) patients experience single episode, 23 (6.33%) patients experienced two episodes and three (0.82%) patients had three episodes of hypotension. In Group II, 93 (50.5%) patients, 19 (7.89%) patients, and two (1.08%) patients experienced such episodes. The difference was significant with respect to one and two episodes. The onset of the first episode of hypotension was 6.93±2.21 minute in Group I and 7.20±2.82 minute in Group 2, and the difference was insignificant. In Group I, the average dose of ephedrine required was 3.56 mg, and in Group II, it was 4.42 mg.
The prevalence of intraoperative nausea was 11.01% (40 patients) in Group I and 11.41% (21 patients) in Group II. Intraoperative vomiting occurred in 19 patients (5.23%) of Group I and 14 patients (7.60%) of Group II.
Table 4 shows the highest somatic level of the block at 40 minutes after the administration of spinal anesthesia. Blockade level of T4 and T6 dermatome (Table 4) segment occurred in 432 patients (280 [77.13%] in Group I; 152 [82.60%] in Group II), and 221 patients (145 [39.94%] in Group I; 76 [41.30%] in Group II), respectively. The difference is significant with respect to T4 level.
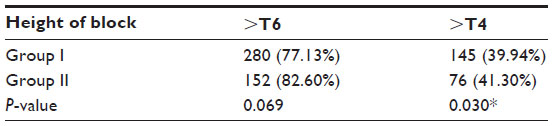 | Table 4 Number of patients achieving signified level of block |
Discussion
Pregnancy produces considerable physiological changes,11 which causes a major alteration in central hemodynamics and as it progresses the enlarging uterus begins to compress vena cava and aorta leading to reduced blood flow in supine position.12 These effects predispose the pregnant patient for accentuated hypotension after spinal anesthesia. In pregnant patients, some conditions further aggravate this risk.
We adopted a retrospective study to evaluate the association of breech presentation with enhanced chances of perioperative hypotension as it is easy to perform and data for many patients can be evaluated, with the application of automated data monitoring and effective application of departmental protocols individual bias can be effectively removed. We adopted strict inclusion criteria of using hyperbaric bupivacaine 0.5% 2 mL in third and fourth interspace of lumbar vertebra. Only those patients who had been preloaded with 500 mL of ringer lactate were included. The purpose was to exclude the bias resulting from the factors known to affect perioperative blood pressure under spinal anesthesia.13
In vertex presentation, the included patients were mainly of cephalopelvic disproportion, earlier lower segment caesarean section (LSCS), cord around neck, occipito-posterior position, polyhydroaminos, and oligohydroaminos. Among breech presentation, breech itself was the major indication where LSCS was performed for safe confinement. Cephalopelvic disproportion and earlier LSCS were the second and third commonest indication, respectively.
Hypotension is said to be the subnormal arterial blood pressure which is not clearly defined so far. Our criteria for defining hypotension that is systolic blood pressure <90 mmHg or a 10% decrease from the baseline in patients with baseline blood pressure <90 mmHg matches with an earlier study.14 For bradycardia, we adopted a documented definition that is heart rate <60 beats per minute.
In our study, the incidence of hypotension was 44.76% and of bradycardia was 2.5% which are comparable with earlier reports.15 Both groups were comparable with respect to demographic parameters, and preoperative readings. Comparative analysis in both groups reveals significant differences in the prevalence of hypotension, and number of episodes of hypotension. There was no difference in the prevalence of bradycardia, nausea, and vomiting in both groups.
In earlier studies: block height > T4, use of intrathecal morphine, uterine displacement, estimated blood loss >500 mL have been identified as the factors contributing to a higher incidence of hypotension perioperatively. Maternal variables that are associated with enhanced risk are presence of pre-eclamsia, twin pregnancy, polyhydroaminos, and extremes of age.4
Several mechanisms have been proposed to explain the pathogenesis of hypotension. Holmes proposed that hypotension after spinal anesthesia is attributed to reduced venous return and cardiac output secondary to compression of IVC by the gravid uterus.16 Preloading before giving spinal anesthesia is recommended all over the world, in accordance with the acute hydration theory given by Marx to compensate the trapping of blood in the legs.17 Lees et al inferred that the cardiac output was 12% less in supine as compared to the lateral position. They measured cardiac output by dye dilution method, and their study provided the basis for the theory of caval compression and supine hypotension.18 However, Sharwood-Smith and Drummond have questioned this theory in a recent editorial, which implies that the main mechanism behind hypotension under spinal anesthesia is more likely a decrease in sympathetic arterial tone.19 The subsequent studies which used continuous cardiac output monitoring during spinal anesthesia also support their work.20,21
Accentuated hypotension in breech presentation can be explained by any of the earlier theories. In breech presentation, the fetal head remains in utero at the level of thoracic vertebra and being the largest and densest part it is more likely to compress venae cavae or aorta or both. Another rationale is that the delivery of the fetus often takes longer in comparison to the cesarean vertex delivery. This study also shows that the time taken from incision to delivery was significantly longer in the patients with breech presentation.
The possible explanation of the slightly higher number of patients with a blockade level >T4 in Group II is that the gravid uterus compresses subarachnoid cavity and the fetal head resides at the thoracic level causes a reduction in cerebrospinal fluid that lasts for a longer time due to prolonged delivery period. The higher the level of the block (<T6), the higher the risk of hypotension; this effect subsequently results from sympathetic nervous system blockade and when the height of blockade is (<T4) compensatory mechanism of vasoconstriction in upper extremities compensates for fall in blood pressure.2 However, this mechanism does not work for the level higher than (>T4) ensued by the blockade of cardio-accelerator fibers. High level of block also tends to explain accentuated hypotension in breech presentation.
The etiology of perioperative nausea is still unknown. Some authors have attributed it to the unopposed vagal activity,22 due to sympathetic blockade during spinal anesthesia while some authors have suggested cerebral hypoxia,23,24 to be the predominant factor causing nausea during spinal anesthesia owing to the decrease in blood pressure, hampering the blood supply to the brain. In the present study, the prevalence of nausea is comparable in both groups that can be supported by multifactorial etiology of nausea and vomiting.
Though, we were able to prove the hypothesis, it has to be kept in mind that a prospective study with complete and uniform data, is more objective than a retrospective analysis. This factor has to be considered before interpreting the results of our study.
Conclusion
In summary, the results indicate that there is a higher incidence of hypotension in pregnant females with breech fetal presentation, or in other words, breech presentation is one of the risk factors for hypotension after spinal anesthesia.
Author contributions
Dr Anshul Jain, Dr Shivali Pandey, Dr Roopesh Kumar, Dr Chavi Sethi, and Dr Sanjya Sharma helped design the study, conduct the study, analyze the data, and write the manuscript. All the authors have seen the original study data, reviewed the analysis of the data, approved the final manuscript, and are responsible for archiving the study files.
Disclosure
The authors report no conflicts of interest in this work.
References
Tarkkila P, Isola J. A regression model for identifying patients at high risk of hypotension, bradycardia and nausea during spinal anesthesia. Acta Anaesthesiol Scand. 1992;36:554–558. | |
Carpenter RL, Caplan RA, Brown DL, Stephenson C, Wu R. Incidence and risk factors for side effects of spinal anesthesia. Anesthesiology. 1992;76:906–916. | |
Sanborn KV, Castro J, Kuroda M, Thys DM. Detection of intraoperative incidents by electronicscanning of computerized anesthesia records. Comparison with voluntary reporting. Anesthesiology. 1996;85:977–987. | |
Somboonviboon W, Kyokong O, Charuluxananan S, Narasethakamol A. Incidence and Risk Factors of Hypotension and Bradycardia after Spinal Anesthesia for Cesarean Section. J Med Assoc Thai. 2008;91(2):181–187. | |
Hickok DE, Gordon DC, Milberg JA, Williams MA, Daling JR. The frequency of breech presentation by gestational age at birth: a large population-based study. Am J Obstet Gynecol. 1992;166(3):851–852. | |
Aisen AO, Lawson O. Outcome of term singleton breech delivery in a tertiary health care centre. Trop J Obstet Gynaecol. 2003;20(2):129–133. | |
Villar J, Carroli G, Zavaleta N, et al. Maternal and neonatal individual risks and benefits associated with cesarean delivery: multicentre prospective study. BMJ. 2007;335(7628):1025. | |
Barbeito A, Muir HA, Gan TJ, et al. Use of a modifier reduces inconsistency in the American Society of Anesthesiologists physical status classification in parturients. Anesth Analg. 2006;102:1231–1233. | |
Benson M, Junger A, Quinzio L, et al. Clinical and practical requirements of online software for anesthesia documentation an experience report. Int J Med Inform. 2000;57(2–3):155–164. | |
DGAI-Kommission. “Qualitätssicherung und Datenverarbeitung in der Anästhesie”: Kerndatensatz Qualitätssicherung in der Anästhesie. [DGAI Commission quality assurance and data processing in anesthesia, core data set quality assurance in anesthesia]. Anästh Intensivmed. 1993;34:331–335. German. | |
Clark SL, Cotton DB, Lee W, et al. Central hemodynamic assessment of normal term pregnancy. Am J Obstet Gynecol. 1989;161(6 Pt 1):1439–1442. | |
Ueland K, Hansen JM. Maternal cardiovascular dynamics. II. Posture and uterine contractions. Am J Obstet Gynecol. 1969;103:1–7. | |
Norris MC: Height, weight and the spread of subarachnoid hyperbaric bupivacaine in the term parturient. Anesth Analg. 1988;67:555. | |
Klöhr S, Roth R, Hofmann T, Rossaint R, Heesen M. Definitions of hypotension after spinal anaesthesia for caesarean section: literature search and application to parturients. Acta Anaesthesiol Scand. 2010; 54(8):909–921. | |
Kyokong O, Charuluxananan S, Sriprajittichai P, Poomseetong T, Naksin P. The incidence and risk factors of hypotension and bradycardia associated with spinal anesthesia. J Med Assoc Thai. 2006;89(Suppl 3):S58–S64. | |
Holmes F. Spinal analgesia and caesarean section; maternal mortality. J Obstet Gynaecol Br Emp. 1957;64:229–232. | |
Marx GF. Supine hypotension syndrome during cesarean section. J Am Med Assoc. 1969;7:1903–1905. | |
Lees MM, Scott DB, Kerr MG, Taylor SH. The circulatory effects of recumbent postural change in late pregnancy. Clin Sci. 1967;32(3):453–465. | |
Sharwood-Smith G, Drummond GB. Hypotension in obstetric spinal anaesthesia: a lesson from pre-eclampsia. Br J Anaesth. 2009;102:291–294. | |
Langesæter E, Rosseland LA, Stubhaug A. Continuous invasive blood pressure and cardiac output monitoring during cesarean delivery. Anesthesiology. 2008;109:856–863. | |
Dyer RA, Reed AR, van Dyk D, et al. Hemodynamic effects of ephedrine, phenylephrine, and the coadministration of phenylephrine with oxytocin during spinal anesthesia for elective cesarean delivery. Anesthesiology. 2009;111(4):753–765. | |
Kestin IG. Spinal anaesthesia in obstetrics. Br J Anaesth. 1991;66:839–842. | |
García-Miguel FJ, Montaño E, Martín-Vicente V, Fuentes AL, Alsina FJ, San José JA. Prophylaxis against intraoperative nausea and vomiting during spinal anaesthesia for caesarean section: a comparative study of ondansetron versus metclopropamide. Int J Anaesth. 2000;4(2). | |
Kety SS, King BD, Horvath SM, Jeffers WA, Hafkenschiel JH. The effects of an acute reduction in blood pressure by means of differential spinal sympathetic block on cerebral circulation of hypertensive patients. J Clin Invest. 1950;29:402–403. |
 © 2015 The Author(s). This work is published and licensed by Dove Medical Press Limited. The
full terms of this license are available at https://www.dovepress.com/terms
and incorporate the Creative Commons Attribution
- Non Commercial (unported, 3.0) License.
By accessing the work you hereby accept the Terms. Non-commercial uses of the work are permitted
without any further permission from Dove Medical Press Limited, provided the work is properly
attributed. For permission for commercial use of this work, please see paragraphs 4.2 and 5 of our Terms.
© 2015 The Author(s). This work is published and licensed by Dove Medical Press Limited. The
full terms of this license are available at https://www.dovepress.com/terms
and incorporate the Creative Commons Attribution
- Non Commercial (unported, 3.0) License.
By accessing the work you hereby accept the Terms. Non-commercial uses of the work are permitted
without any further permission from Dove Medical Press Limited, provided the work is properly
attributed. For permission for commercial use of this work, please see paragraphs 4.2 and 5 of our Terms.