Back to Journals » International Journal of Nanomedicine » Volume 15
A Radio-Nano-Platform for T1/T2 Dual-Mode PET-MR Imaging
Authors Gholami YH ![]() , Yuan H, Wilks MQ, Maschmeyer R
, Yuan H, Wilks MQ, Maschmeyer R ![]() , Normandin MD
, Normandin MD ![]() , Josephson L
, Josephson L ![]() , El Fakhri G, Kuncic Z
, El Fakhri G, Kuncic Z ![]()
Received 11 December 2019
Accepted for publication 9 February 2020
Published 24 February 2020 Volume 2020:15 Pages 1253—1266
DOI https://doi.org/10.2147/IJN.S241971
Checked for plagiarism Yes
Review by Single anonymous peer review
Peer reviewer comments 2
Editor who approved publication: Dr Phong A Tran
Video abstract of 'A radio-nano-platform for PET-MRI' [ID 241971]
Views: 1115
Yaser Hadi Gholami, 1–3 Hushan Yuan, 4 Moses Q Wilks, 4 Richard Maschmeyer, 1 Marc D Normandin, 4 Lee Josephson, 4 Georges El Fakhri, 4 Zdenka Kuncic 1, 2, 5
1Faculty of Science, School of Physics, The University of Sydney, Sydney, NSW, Australia; 2Sydney Vital Translational Cancer Research Centre, St Leonards, NSW, Australia; 3Bill Walsh Translational Cancer Research Laboratory, The Kolling Institute, Northern Sydney Local Health District, Sydney, NSW, Australia; 4Gordon Center for Medical Imaging, Massachusetts General Hospital, Harvard Medical School, Boston, MA, USA; 5The University of Sydney Nano Institute, Sydney, NSW, Australia
Correspondence: Zdenka Kuncic; Yaser Hadi Gholami
School of Physics A28, The University of Sydney, Sydney, NSW 2006, Australia
Tel +61 2 9351 3162
Fax +61 2 9351 7726
Email [email protected]; [email protected]
Purpose: This study aimed to develop a chelate-free radiolabeled nanoparticle platform for simultaneous positron emission tomography (PET) and magnetic resonance (MR) imaging that provides contrast-enhanced diagnostic imaging and significant image quality gain by integrating the high spatial resolution of MR with the high sensitivity of PET.
Methods: A commercially available super-paramagnetic iron oxide nanoparticle (SPION) (Feraheme®, FH) was labeled with the [ 89Zr]Zr using a novel chelate-free radiolabeling technique, heat-induced radiolabeling (HIR). Radiochemical yield (RCY) and purity (RCP) were measured using size exclusion chromatography (SEC) and radio-thin layer chromatography (radio-TLC). Characterization of the non-radioactive isotope 90Zr-labeled FH was performed by transmission electron microscopy (TEM). Simultaneous PET-MR phantom imaging was performed with different 89Zr-FH concentrations. The MR quantitative image analysis determined the contrast-enhancing properties of FH. The signal-to-noise ratio (SNR) and full-width half-maximum (FWHM) of the line spread function (LSF) were calculated before and after co-registering the PET and MR image data.
Results: High RCY (92%) and RCP (98%) of the [ 89Zr]Zr-FH product was achieved. TEM analysis confirmed the 90Zr atoms adsorption onto the SPION surface (≈ 10% average radial increase). Simultaneous PET-MR scans confirmed the capability of the [ 89Zr]Zr-FH nano-platform for this multi-modal imaging technique. Relative contrast image analysis showed that [ 89Zr]Zr-FH can act as a dual-mode T1/T2 contrast agent. For co-registered PET-MR images, higher spatial resolution (FWHM enhancement ≈ 3) and SNR (enhancement ≈ 8) was achieved at a clinical dose of radio-isotope and Fe.
Conclusion: Our results demonstrate FH is a highly suitable SPION-based platform for chelate-free labeling of PET tracers for hybrid PET-MR. The high RCY and RCP confirmed the robustness of the chelate-free HIR technique. An overall image quality gain was achieved compared to PET- or MR-alone imaging with a relatively low dosage of [ 89Zr]Zr-FH. Additionally, FH is suitable as a dual-mode T1/T2 MR image contrast agent.
Keywords: SPIONs, HIR, radiolabeling, MRI, PET, multimodal imaging
Introduction
Superparamagnetic iron oxide nanoparticles (SPIONs) represent a class of nanoparticles with arguably the most promising potential for clinical translation. Their strong magnetic susceptibility, attributable to their nanoscale geometric confinement, enhances contrast in magnetic resonance (MR) imaging, which is an essential diagnostic clinical imaging modality. Indeed, a number of SPION-based nanoparticles have already demonstrated valuable clinical applications in oncology, neurology and cardiology.1–3 SPIONs thus represent an attractive nanoparticle platform for versatile clinical nanomedicine applications.
Feraheme® (Ferumoxytol, AMAG Pharmaceuticals, Waltham, MA, USA) is a nanoparticle comprised of an ultra-small (≈5 nm diameter) SPION core and a carboxymethyl dextran polymer coating, giving an effective hydrodynamic diameter of ≈30 nm. Since being FDA-approved for treating iron-deficiency anemia, Feraheme has attracted considerable attention and is increasingly being used off-label as an MR imaging contrast agent, not only as an alternative to conventional gadolinium-based agents but also because of its unique and favorable pharmacologic, metabolic and imaging properties.4 In particular, FH has proven to be an effective biological marker of inflammation, as a result of being uptaken from the blood pool by immune cells (see Figure 1). Thus, FH-enhanced MR imaging can be used to non-invasively detect monocyte/macrophage trafficking and localize inflammatory lesions.5,6
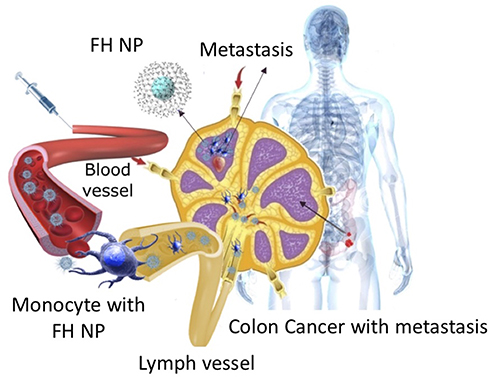 |
Figure 1 Following intravenous injection, FH SPIONs slowly extravasate from vascular space to interstitial space, from where they can be taken up by immune cells (monocytes/macrophages) and delivered via lymphatic vessels to lymph nodes. The FH SPIONs remain in normal nodal tissue and reduce MRI signal intensity, thereby enhancing contrast against any metastatic lesions in the node. Abbreviations: FH, Feraheme; SPIONs, superparamagnetic iron oxide nanoparticles. |
In our ongoing studies,7–9 Feraheme was used as a nanoparticle platform to label a number of radio-isotopes commonly used in nuclear medicine, particularly Positron Emission Tomography (PET). Importantly, radiolabeling was achieved using a recently developed technique, heat-induced radiolabeling (HIR).7,10 The technique is chelate-free and is thus more favorable for clinical applications than conventional labeling methods that rely on different chemical chelators unstable and/or alter nanoparticle biodistribution in vivo.11,12
The motivation for radiolabeling FH with PET tracers is to take advantage of multi-modal PET-MR imaging technology, which is proving invaluable in a growing number of clinical imaging applications.13–15 Other chelate-free approaches have been demonstrated in previous studies16,17 where 64Cu and 68Ga are introduced during microwave-assisted iron oxide nanoparticle synthesis (with radiolabeling yields of 33% and 87%, respectively). Using this doping method, Pellico et al17 demonstrated biodistribution measurements based on sequential PET and MR imaging (single T1 modality). Simultaneously acquired PET-MR integrates the high sensitivity of PET with the spatial resolution and soft tissue contrast provided by MR imaging. FH is most often used to enhance dark contrast against tissue, by virtue of its ability to quench the MR signal by shortening the transverse (spin-spin) relaxation time, T2. However, dark contrast can be difficult to discern in a clinical setting, especially for some applications such as detection and diagnosis of metastases in the lymph nodes, which are typically only ≈1-2 cm in diameter and display intra-nodal contrast variations in FH-enhanced MR imaging when metastases is present.18,19 Furthermore, increasing the FH Fe dose is not desirable because FH aggregation can affect the MR-derived attenuation maps needed by PET in simultaneous PET-MR.20 FH radiolabeled with a PET tracer can thus take advantage of the high sensitivity bright signal from PET to readily detect the presence of FH in regions where the MR contrast is too low and/or the signal too noisy. Conversely, anatomical features, such as a lymph node, can be identified with MR, which has a spatial resolution (≈1 mm in standard clinical scanners) that is typically an order of magnitude better than PET.
To date, relatively few studies have investigated the potential for hybrid PET-MR imaging of radiolabeled SPIONs.21–24 Here we used the PET tracer [89Zr]Zr-FH and focus our attention on acquiring, for the first time, simultaneous PET-MR images using phantoms to demonstrate proof-of-principle of how [89Zr]Zr-FH, a radio-nano-platform, are useful for hybrid PET-MR enabling a gain in image quality that would otherwise not be possible with either image modality alone.
Materials and Methods
General
Feraheme® (FH, AMAG Pharmaceuticals, Waltham, MA, USA) has the non-stoichiometric formula Fe5874 O8752:C11719 H18682 O9933 Na414. A single 17 mL vial of FH containing 510 mg elemental iron (30 mg Fe/mL) was used in this study. [89Zr]Zr4+ (half-life 78.41 hrs) was obtained from Perkin-Elmer (batch number ZIRM0581) in its oxalate form shipped in 1 M oxalic acid with a specific activity of ≈ 993.5 MBq/mL (34.7 MBq/0.035 mL). Chelex-treated water (CTW) with pH = 10 was prepared according to the online batch protocol (Sigma-95621-100G-F) and purified by using a 0.2 µm filter (Thermo Scientific, Nalgene Disposable filter Unit, 4500–0020). Na2CO3 (1 M in CTW, Sigma-S7795-500G) was used for [89Zr]Zr-oxalate neutralization and pH adjustment of reaction mixtures. Deferoxamine mesylate salt (DFO, Sigma-D9533) (20 mM) was prepared in CTW and used to quench the reactions. Size exclusion chromatography (SEC), PD-10 columns (GE Healthcare, cat # 17085101) and 0.9% saline (cat V00410) were used for sample purification and radiochemical analysis. Volume fractions were counted on a Wizard 2480 (Perkin-Elmer) gamma counter. Purified radiolabeled samples were concentrated using an Amicon 30 kDa MC centrifugal filter (Sigma-Z717185). A strong cation exchange radio-thin layer chromatography (radio-TLC) plate was used (Sorbent Technologies, Cat#: 1224026). The TLC plates were pre-soaked at the origin section by chelexed water and dried by a small fan immediately before use. A silicon monoxide (SiO) grid was used for transmission electron microscopy (TEM). TEM micrographs were acquired using a 200 keV JEOL-2100 electron microscope. Glass vials (1.8 mL with diameter and length of 11.6 and 32 mm, respectively) were used as phantoms. All phantom images were acquired using a simultaneous pre-clinical PET-MR scanner (MR Solutions 3T). A standard whole mouse body protocol was used for the PET scan and a T1-weighted (T1W) and T2-weighted (T2W) fast spin echo sequence was used for the MR scans.
Experimental Methods
Heat-Induced Radiolabeling (HIR)
HIR was carried out according to the published protocol.7,10 Briefly, three identical FH samples were prepared, two for radiochemical analysis and one for phantom imaging. For each sample, the reaction mixture was prepared by adding 20 µL [89Zr]Zr (mZr ≈ 0.0125 nmol, Natoms ≈ 7.5×10¹², with A0≈18.5 MBq) and 50 µL CTW into a 0.3 mL glass vial. The pH was adjusted to ≈ 8–9 by gradually adding 20 µL Na2CO3 (1 M). Next, 33.3 µL FH (1 mg, mFe ≈ 17.9 µM, NFe atoms ≈ 107×1017, NFH ≈ 184 ×1013) was added to the reaction mixture and the total volume was brought up to 200 µL by adding CTW (96.7 µL). The final pH was measured to be ≈ 8.5–9. A magnetic stirrer bar was fitted within the glass vial, which was then placed in a silicon oil bath and the reaction mixture was heated for 2 hrs at 120°C. Next, the reaction mixture was cooled in an ice bath for 15 mins under stirring. Finally, DFO (5 µL, pH ≈ 7.5, 20mM) was added to quench the reaction by reacting with remaining free [89Zr]Zr ions and dissociating any loosely bound [89Zr]Zr ions from the FH nanoparticles. The quenching process was performed for 15 mins under room temperature incubation and magnetic stirring. A summary of the experimental procedure is shown in supplementary Figure S1.
Radiochemical Analysis
Size exclusion chromatography (SEC) and radio-thin layer chromatography (radio-TLC) were performed according to our previous published protocol7 to obtain the radiochemical yield and purity (RCY and RCP).
The reaction mixtures were loaded on PD-10 columns and isotonic saline solution (made by Na2CO3 neutralization from pH 5–6 to pH 7.4) was used for volume elution. After the reaction mixture was loaded on a PD-10 column, about 2.3 mL of saline was the void volume which allowed the separation of the 89Zr-FH from 89Zr-DFO within the column (Figure S2A). Next, by loading ≈ 9.7 mL saline, 40 volume fractions were collected at 200 µL (for the first 35 fractions) and 540 µL (for the last 5 fractions) (Figure S2B). The 89Zr-FH was collected from  2.3–4.3 mL and the activity of each eluted volume was measured by gamma counter and an elution activity curve was plotted. Next, to concentrate the [89Zr]Zr-FH product, the purified sample plus 2 mL saline was loaded on to a 50 kDa MC Amicon filter for centrifugation (at 370 g (rcf) under room temperature). The final purified product was then collected at 200 µL saline (Figure S2B). Finally, an SEC RCP analysis was performed on a PD-10 column for the purified product. The RCY and RCP were further confirmed by radio-TLC analysis as [89Zr]Zr-FH solutions (2 µL, the reaction mixture for RCY and final purified product for RCP) was visually located at the origin of the radio-TLC plates. After the TLC plates were developed by CTW, each radio-TLC plate was then cut into 1 cm pieces, each of which was readout using the gamma counter. The radio-TLC activities were plotted as a function of distance.
Transmission Electron Microscopy (TEM)
A separate non-radioactive [90Zr]Zr-FH sample was prepared using [90Zr]Zr-chloride solution (nZr ≈ 8.2 µmol, NZr ≈ 493 ×1016 atoms) and 33.3 µL FH (nFH ≈ 3.0 nmol, NFH ≈ 184 ×1013 nanoparticles, nFe ≈ 17.9 µmol, NFe ≈ 107×1017 atoms) using a similar HIR and purification method. This provided a 90Zr-to-FH molar ratio of ≈ 2700 (or 1 Zr atom to ≈2 Fe atoms), which is more than 5 orders of magnitude higher than the 89Zr-to-FH molar ratio (≈ 0.0042) for the radioactive labeling procedure. The final product was diluted with deionized water (DIW) (at 0.001 w/w%) before TEM imaging using the JEOL-2100 at 200 keV. Images were analyzed using ImageJ and MATLAB software to determine the change in signal intensity in [90Zr]Zr-labeled FH particles compared to unlabeled FH samples. The change in average radial transmission profile between unlabeled and labeled FH was then calculated and the corresponding change in volume, (1) , was used to calculate the labeling yield (LY):

where  is the total mass of labeled Zr and
  ≈ 750 μg is the total initial mass of Zr (nZr ≈ 8.2 µmol).
Phantom Imaging
Six vials were prepared at the dimension of diameter: 11.6 mm, height: 32 mm, and volume: 1.8 mL (Figure 2). A series of dilutions of [89Zr]Zr-FH samples were prepared in these 6 separate phantom vials with DIW at sample solution volume of 2 mL. A control phantom vial was made with DIW only. All the vials were placed into a round holder used for simultaneous PET-MR imaging. Table 1 summarizes the phantom vial [89Zr]Zr-FH dilutions. As the MR scans for the two highest FH [Fe] samples were too short for T2W images and also produced insufficient contrast in T1W images, only the FH [Fe] = 0.70, 1.05 and 1.59 mM samples were used for analysis.
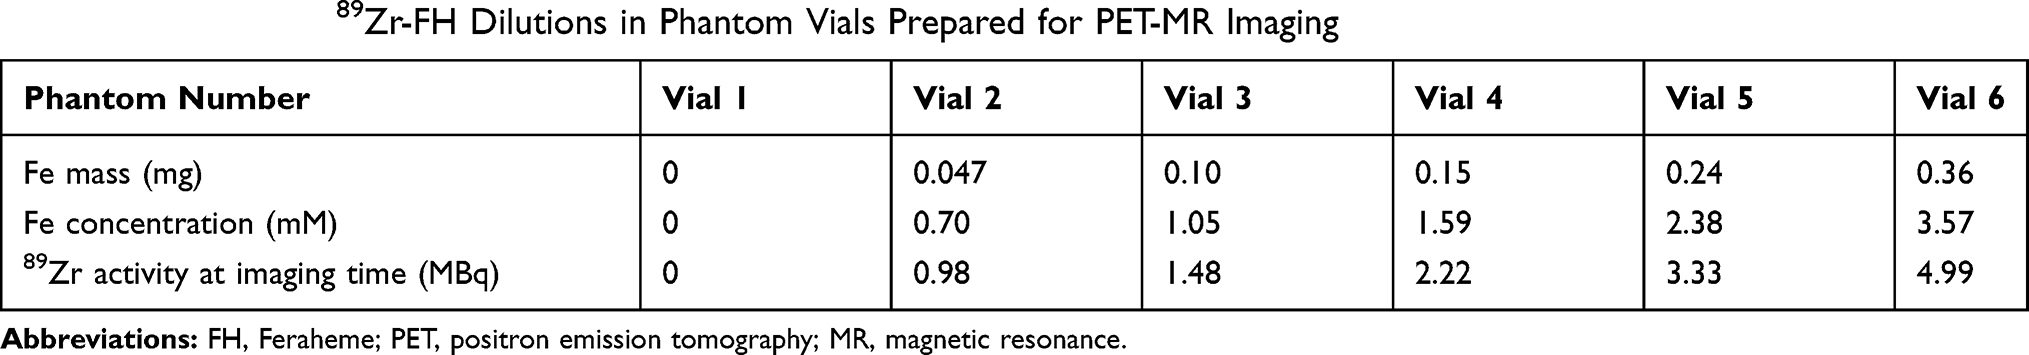 |
Table 1 Summary of 89Zr-FH Dilutions in Phantom Vials Prepared for PET-MR Imaging |
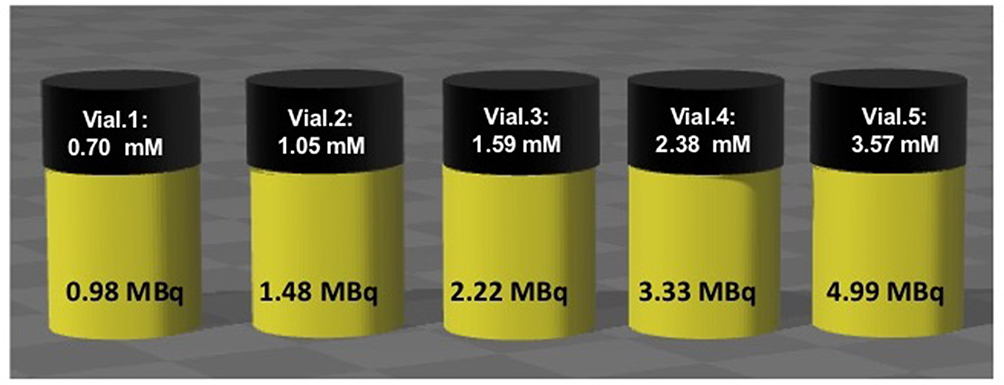 |
Figure 2 PET-MR imaging phantoms. Notes: Phantom vials (11.6 mm × 32 mm, V = 1.8 mL) containing [89Zr]Zr-FH dilutions with varying FH Fe concentrations and [89Zr]Zr initial activities prepared for simultaneous PET-MR imaging. Abbreviations: PET, positron emission tomography; MR, magnetic resonance; FH, Feraheme. |
Immediately after preparation of the radioactive samples, the phantom vials were scanned using a simultaneous pre-clinical PET-MR scanner (MR Solutions 3 T). A standard whole mouse body PET-MR coil was used for both the PET and MR scans. The PET scan was acquired over a period of 5 mins. Multi-slice (N=2) T2W and T1W images were acquired with different time-to-echo (TE), ranging from 11 to 90 ms with repetition times (TR) of 350 to 3000 ms using a fast spin echo (FSE) sequence, with flip angle 90°, field of view (FOV) = 60 × 60 mm2, matrix = 256 × 256, and slice thickness = 1 mm. Multiple acquisitions of the T1W (at TE=11 ms with TR = 350 ms) and T2W (at TE = 90 ms with TR= 3000 ms) scans were acquired to obtain the averaged MR images. In addition, MR scans were acquired at different combinations of TEs and TRs for the [Fe] = 0.7 mM phantom to obtain a relaxometric map. The mean magnitudes of T2W and T1W FSE image signal intensities were obtained within drawn circular regions of interest (ROIs) using MATLAB software for each sample.
To quantitatively analyze the PET-MR images, we used the following metrics: the signal-to-noise (SNR) ratio; a relative contrast to water (RCW) metric for the contrast-enhanced MR images acquired at a single TE; and the full width at half maximum (FWHM) of the line spread function (LSF) for the spatial resolution assessment.
The T1W average MR image, which has the highest spatial resolution and SNR, was used to co-register the PET-MR images using MATLAB software. Co-registration was computed using the intensity-based image registration function “imregister” which is an in-build package in the image processing toolkit. To assess the spatial resolution of the co-registered PET-MR images, the FWHM was calculated from the LSF based on the edge smearing function (ESF) using equations (2) and (3):25
(2) (3)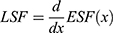
The ESF was calculated from line profiles of the averaged MR, PET and co-registered PET-MR images, where X, xi, and n are the input array of voxel intensity data, the ith element of X and the number of voxels used in averaging, respectively.
The SNR voxel histograms of the MR images (both N=1 and N=20) are defined as
(4)
where Ii is the intensity of the ith voxel signal within the drawn circular ROIs and σsig is the standard deviation of the voxel signals. Equation (4) is used to calculate the SNR histograms for T2W and T1W original and averaged MR images, respectively. The average SNRs for the simultaneous PET-MR and separate PET and MR images were calculated from the SNR histograms.
The RCW was defined in terms of the difference between the mean image intensities of the phantom vials containing the FH contrast relative to that of the water-only vial:26
(5) (6)
where subscripts “FH” and “w” refer to Feraheme and water, respectively. This was calculated for the MR images acquired at TE=90 ms (with TR = 3000 ms) for T2W and TE = 11 ms (with TR = 350 ms) for T1W scans. The RCW defined by Equation (5) and (6) is more useful than one defined in terms of linear intensity difference, which cannot be directly related to R2 or R1 and hence, to the FH [Fe]. Equation (5) is thus used to determine the concentration at which contrast is negative or positive.
Results
Synthesis of [89Zr]Zr-FH and Radiochemical Analysis
The synthesis of [89Zr]Zr-FH was carried out by the incubation of a solution of [89Zr]Zr-oxalate and FH in CTW under 120°C for 3 hrs using the magnetic stirrer for mixing. The reaction efficiency and the quality of the product were analyzed by SEC and TLC methods indicated by RCY and RCP, respectively (Figure S3). As the [89Zr]Zr-DFO complex is smaller in size than [89Zr]Zr-FH, it was included by the PD-10 column while the nanometer-sized [89Zr]Zr-FH passes through (excluded by the column). Thus, after applying the first 2.3 mL saline, the [89Zr]Zr-FH eluted down the column faster than the [89Zr]Zr-DFO complex. After applying another 12 mL saline, the first ~2–3 mL contained the radiolabeled [89Zr]Zr-FH (brown color solution, Figure 2SB). For TLC analysis, the [89Zr]Zr-DFO complex remained at the origin ( = 0.0) and [89Zr]Zr-FH was eluted with the solvent front (
 ≈ 1.0). The average decay corrected RCY was 92 ± 1% with RCP of ≈98%. The activity of purified [89Zr]Zr-FH product was measured to be ≈17.2 MBq. Both RCY and RCP results were further confirmed with radio-TLC measurements. Our RCY and RCP values are remarkably similar to results obtained in a previous study10 reporting on chelate-free HIR of FH, thus demonstrating the robustness and reproducibility of this technique.
Transmission Electron Microscopy (TEM)
The mophology, size homogeneity, and electron density of 90Zr unlabeled and labeled FH NPs were characterized by TEM. Figure 3A and B present the TEM images of FH and 90Zr-FH, respectively. These images represent transmission of the electron beam through the electron-dense particle cores. Figure 3C shows the average transmission profile for FH and 90Zr-FH. After labeling with 90Zr, the average particle diameter increases by ≈10% and the mean signal intensity decreases by ≈25%, thus indicating a higher electron density per labeled nanoparticle. Additionally, the average signal intensity at the edges of the transmission profile for labeled FH is lower by ≈11%, which further indicates an increase in electron density at the surface of the nanoparticle core. These results suggest that the 90Zr ions bind predominantly to the surface layer of the magnetite core. This is also consistent with our previous study.7 The inductively coupled plasma mass spectrometry analysis of a range of HIR labeled metal-FH products demonstrated that all of Sr2+, Ba2+, Mo3+, Pb2+, Cu2+, Bi3+, In3+, Y3+, Lu3+, Sm3+, Tb3+, and Eu3+ cations were adsorb onto the FH surface via Radiocation Surface Adsorption.7 The labeling yield (LY) is calculated using Equation (1), with the change in volume per FH particle,

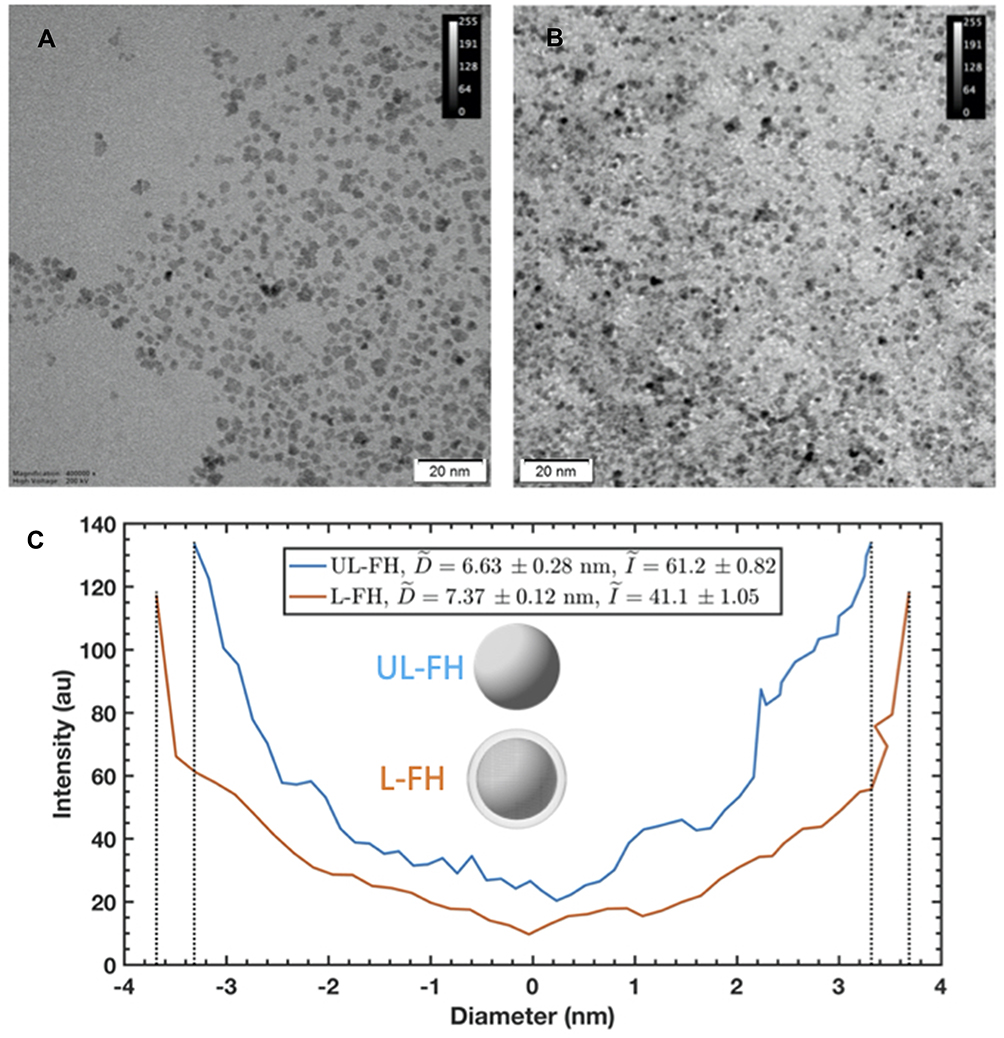 |
Figure 3 TEM images of FH and corresponding transmission line profiles. (A) unlabeled FH (UL-FH) and (B) [90Zr]Zr –labeled FH (L-FH) (scale bar is 20 nm); (C) average transmission profile of FH in each image. Abbreviations: TEM, transmission electron microscopy; FH, Feraheme. |
where  and
and  are the mean radii of the labeled and unlabeled nanoparticles, respectively (cf. Figure 3C), and NFH ≈ 184 ×1013 nanoparticles. This gives
  ≈ 682 μg and hence,
Phantom Imaging
Phantom MRI
A relaxometric map derived from the FSE MR phantom images at different TE and TR is shown in Figure 4. This map demonstrates that positive contrast (white-gray shaded area) can be achieved at short TEs (up to 40 ms) with TRs up to 1000 ms, while negative contrast (dark gray area) can be achieved at higher TEs (up to 90 ms) with TRs up to 3000 ms. No contrast can be achieved for scans with TEs > 40 ms and TRs < 1000 ms (non-shaded region in Figure 4).
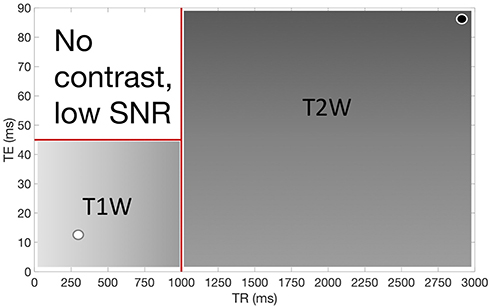 |
Figure 4 Relaxometric map for MR imaging of FH at different TE and TR. White-gray area indicates positive contrast relative to water, darker gray indicates negative contrast. The black and white circles indicate the parameters used to obtain. Figures 5 and 6 Abbreviations: MR, magnetic resonance; TE, echo time; TR, repetition time; SNR, signal-to-noise ratio; T1W, T1 weighted; T2W, T2 weighted. |
Figures 5 and 6 show the statistical analyses of T1W and T2W MR images, respectively. The original (N=1) and averaged MR images (N= 20) are shown in Figures 5A and B and 6A and B, respectively. For T1W MR images (Figure 5), despite the relatively short TE and TR (11 ms and 350 ms, respectively) all of the FH samples (with [Fe] = 0.70–1.59 mM) demonstrated a positive contrast relative to water. The vial containing the smallest FH concentration ([Fe] = 0.7 mM, circled ROI) demonstrated the strongest positive contrast. The mean SNRs calculated from the voxel histograms were 30.0 ± 1.4 and 131.4 ± 1.5 for the original and averaged T1W images (Figure 5C), and 3.0 ± 1.5 and 12.6 ± 1.6 for the original and averaged T2W images (Figure 6C). Figures 5D and 6D shows that for both T1W and T2W averaged images, SNR improved by  .
.
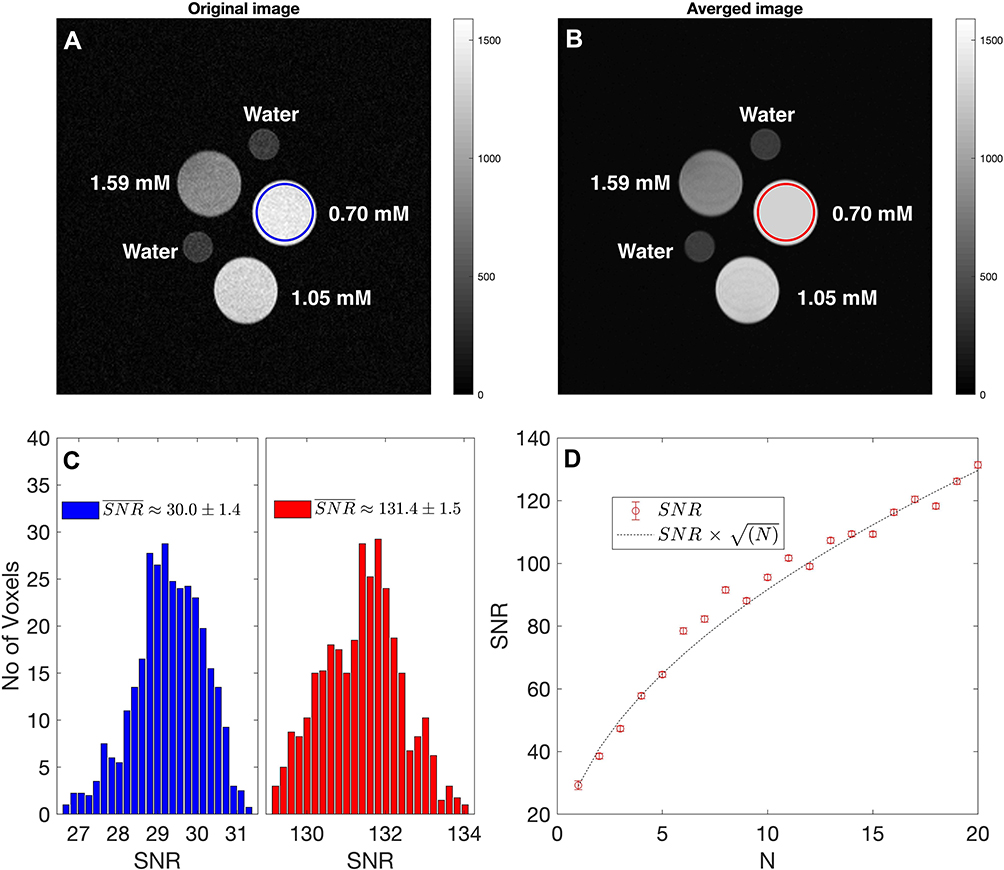

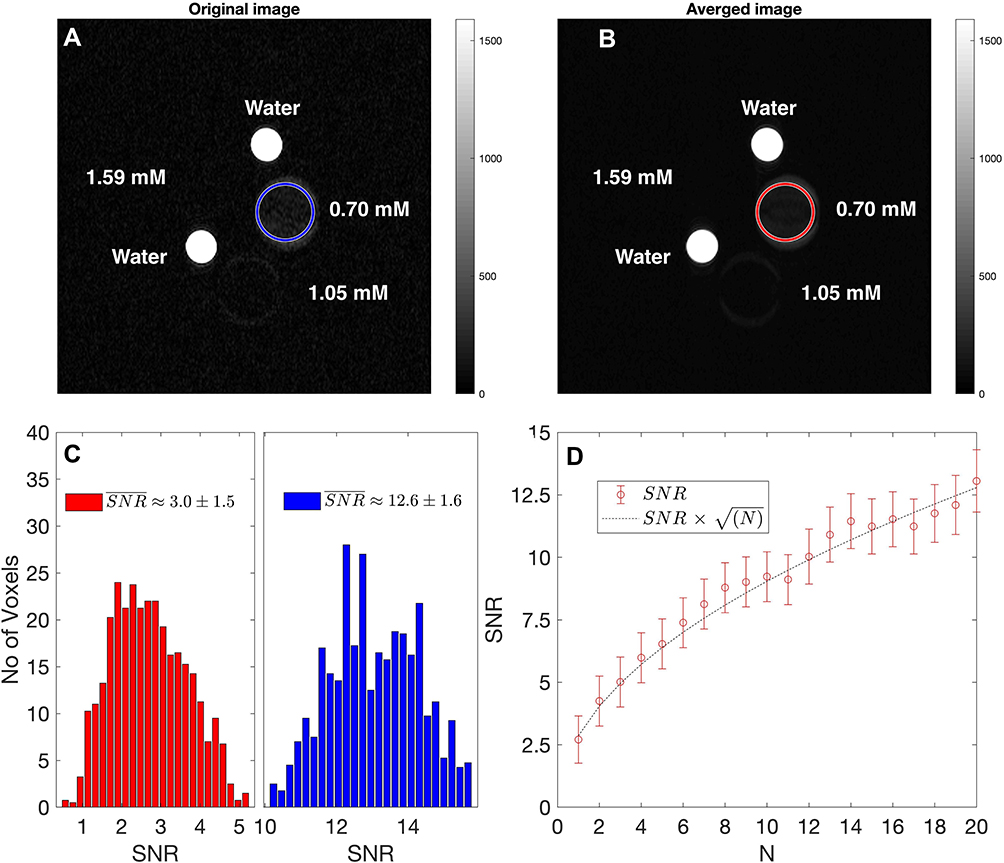

Figure 7 plots the RCW as a function of FH [Fe] for both T1W (TE = 11 ms and TR = 350 ms) and T2W images (TE = 90 ms and TR = 3000 ms). Both the theoretical fit (dashed lines) and experimental measurements (data points) demonstrates values of T1W and T2W RCW increase rapidly for [Fe] up to  0.3 mM. At FH [Fe] > 0.3 mM, however, the T1W RCW decreases to zero at the highest FH [Fe] (i.e. 3.57 mM), while the T2W RCW reaches the maximum 100% at FH [Fe] > 1.5 mM.
 |
Figure 7 Measured relative contrast to water (RCW) for T1W (with TE= 11 ms, TR = 350 ms) and T2W (with TE= 90 ms, TR = 3000 ms) MR images acquired with different Fe FH concentrations. Dashed lines represent RCW values predicted by equation (3). Abbreviations: ST2,Fe and ST1,Fe,T2W and T1W MR signals of Fe FH samples, respectively; ST2,w; ST1,w, T2W and T1W MR signals of water, respectively. |
Phantom PET-MRI
Figure 8D shows the co-registered averaged PET-MR images computed by intensity-based image registration using the averaged T1W MR (Figure 8A and B) and PET (Figure 8C) signal intensities. Figure 8E and F shows zoomed-in PET and PET-MR images of the phantom containing the lowest FH [Fe] and [89Zr]Zr activity concentration. The LSF profiles shown in Figure 8G for MR (for the lowest FH [Fe] = 0.70 mM), PET (with the lowest [89Zr]Zr initial activity, A0 = 0.98 MBq) and the co-registered averaged PET-MR images demonstrate that the spatial resolution of the PET-MR image (FWHM = 0.8 mm) is  62% better than the PET-only image (FWHM = 2.1 mm). Table 2 lists the corresponding values for the mean intensity, standard deviation and SNR for the MR and PET images before and after co-registration. The co-registered PET-MR images display higher mean intensity, relative to the MR-only images, and reduced noise, relative to the PET-only images, and while the SNR for the co-registered PET-MR images reduces by a factor ≈3 relative to the MR images, almost an 8-fold gain in SNR is achieved relative to the PET images. Furthermore, this maximum gain is achieved with the lowest 89Zr-FH dosage used in our study that also produces the highest T1W relative contrast to water (cf. Figure 7).
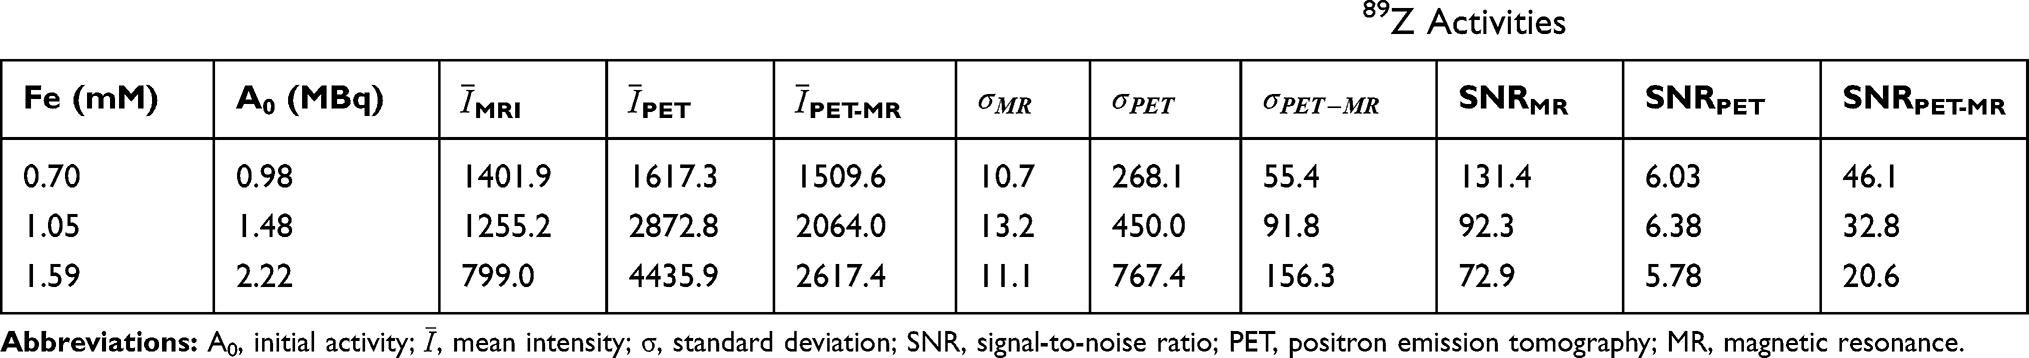 |
Table 2 Mean Intensity, Standard Deviation and Corresponding SNR Values for the Averaged T1W MR Images (at TE=11 Ms, TR = 350 Ms, N= 20) and PET Phantom Images at Different FH Fe Concentrations and Initial 89Z Activities |
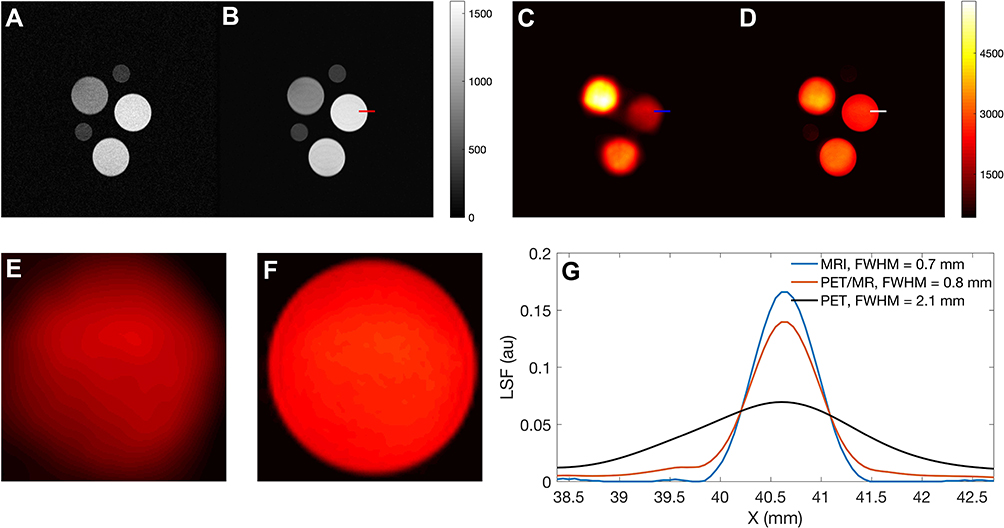 |
Figure 8 Spatial resolution assessment for MR, PET and co-registered PET-MR images. T1W image (with TE= 11 ms, TR = 350 ms) of the original (A) and averaged (B; N = 20) MR images ([Fe] = 0.70, 1.05 and 1.59 mM), respectively; (C) Reconstructed PET image (A0 = 0.98, 1.48 and 2.22 MBq); (D) Co-registered PET-MR (computed by averaging signals from PET and MR); dashed red, blue and green lines indicate where line profiles were calculated and used to measure FWHM at the edge of phantom images containing the lowest FH [Fe] (i.e. 0.7 mM) and 89Zr activity concentration (0.98 MBq); zoom-in of PET (E) and PET-MR (F) phantom images; (G) measured line spread function (LSF) of the MR, PET and PET-MR images. Abbreviations: FWHM, full width at half maximum; LSF, line spread function. |
Discussion
Radiochemical Analysis
The radiochemical analysis (Figure S3) demonstrates that under basic conditions (pH ~ 8–9) 89Zr4+ ions react thermally with the FH core and result in high RCY and RCP. These results are also consistent with a previous study27 and confirm the efficiency and robustness of the novel HIR technique. Therefore, cations with f-orbital electrons, more empty d-orbitals, larger radii, and higher positive charges (or higher oxidation state) result in a stronger electrostatic interaction and thus stronger bonding with the surface and a higher radiochemical yield (RCY).7 In our recent publication,7 we report on a method to optimize the HIR technique to further enhance the RCY by approximately 20% which could be applied in future work to further increase the RCY of radiolabeling FH SPIONs with89Zr.
The stability of the prepared radiolabeled FH SPION was fully characterized in our recent studies.7,8,27 A complete picture for the stability of HIR-FH NPs includes three aspects. The first is FH’s extremely high thermo-stability sourced from the good number of carboxyl groups on the CMD and presented by: i) the use of terminal sterilization at 121°C during manufacture;28 ii) its storage for months at room temperature (20–25°C) as a concentrated (30 mg of Fe/mL) fluid for intravenous injection; and iii) minimal variation of NP sizes and MR relaxivities (r1 & r2) post HIR heating.7,8,27 The second is the chemical stability of CMD–iron oxide interaction which permits the conversion of carboxyl groups to amino or azido/alkyne functional groups, followed by multifunctional modifications through amide formation27 or click chemistry.9 The third is their high radiochemical stability both in vitro analyzed by TLC of HIR-FH in references and in vivo without any noticeable bone uptake in PET/CT imaging both in mice8,27 and monkey (unpublished results).
Transmission Electron Microscopy (TEM)
The purpose of this was to achieve metal ion loading on FH sufficiently high to produce a measurable change in TEM and thereby provide additional information on the location of binding to the SPIONs. The TEM images (Figure 3A and B) of the electron-dense core in both unlabeled and 90Zr-labeled FH nanoparticles answers several critical questions. First, the HIR does not significantly change the morphology of the particles. TEM images exhibit no noticeable qualitative differences. No obvious signs of aggregation are evident, in contrast to that observed by,10 where the authors found that aggregation increased the average hydrodynamic diameter of 90Zr-labeled FH particles to ≈35 nm, as measured by dynamic light scattering, at Zr-to-FH molar ratios >125. Second, the adsorption of metal isotopes takes place on the surface of the iron oxide core. Quantitatively the relative decrease in signal intensity and increase in core diameter in the 90Zr-labeled FH transmission profile (Figure 3C) indicates that 90Zr atoms bind preferentially to the surface layer of the SPION rather than inside the magnetite crystal lattice. Our TEM analysis is consistent with electron spin resonance studies by Boros et al.10 Third, the high labeling efficiency (LY ≈ 91%) at high Zr concentration further demonstrates the high metal ion loading capacity of FH, as well as the efficiency and robustness of the HIR technique. We were able to label ≈ 4.5×10⁵ Zr atoms per FH particle, whereas in the radiochemical reaction, given the amount of specific activity for [89Zr]Zr (≈0.9 GBq/mL), the loading is only ≈1 Zr atom per 24 FH particles. Furthermore, these results are consistent with our previous findings, an increase of ≈7 nm for HIR metal-FH NPs.7
Phantom Imaging
The image analyses demonstrated that chelate-free [89Zr]Zr-FH can potentially offer a valuable nanoplatform for PET-MR imaging as a dual MR contrast agent and simultaneous PET tracer. T1 bright contrast images are more practical for clinical applications.29 However, T2 dark contrast images are useful in examining inflamed areas or fluid-rich structures. Therefore, the development of T1/T2 dual modal contrast agents has recently attracted much attention.30–33 Clinically, T1, brighter images are preferred for better resolution and easy detection.29 However, T2 images are useful for examining inflamed areas or fluid-rich structures. Therefore, the development of T1/T2 dual-mode contrast agents is attracting increasing attention since it may improve both detection limits and retain accuracy.34
The RCW values demonstrated that both T1 and T2 contrast can be achieved at a range of FH Fe concentrations. Also, stronger T1 contrast was observed at lower FH [Fe]. The T1 enhancement of FH can be attributed to several possible factors, such as increased surface iron core exposure (due to high surface area to volume ratio),35 the surface effects on magnetization and water exchange36–38 and suppressed magnetization at lower Fe concentration.39 Thus, FH has relatively high r1 (ie  ) and r2 (ie
  ) values40 and can act as a simultaneous MR contrast agent.
The vial containing the smallest FH concentration ([Fe] = 0.7 mM, circled ROI) demonstrated the strongest positive contrast (Figure 5B). This is mainly due to a few factors: (1) since the high surface area to volume ratio of the SPION core, a large number of high-spin paramagnetic Fe3+ and Fe2+ ions are available at the core surface for water proton exchange, thus changing the spin-lattice relaxation of the surrounding water protons; (2) the pore-based structure of carboxymethyl dextran coating of FH allows for water molecule diffusion to the surface of the core, resulting in high water exchange rate between the water bounded on the SPION surface and the surrounding water; (3) suppression of T2 signal domination at lower FH [Fe]. Conversely, for T2W images (Figure 6) the highest FH [Fe] showed strongest T2 contrast. At longer TE and TR (90 ms and 3000 ms), the negative T2 contrast of FH against water positively correlates with FH [Fe]. At a constant FH [Fe], the magnitude of dark signal intensity depends on the length of TE relative to the relaxation time T2, which is determined by FH [Fe]. Therefore, FH MR results suggest that FH can act as a dual-mode contrast agent: T1 contrast and T2 contrast at low [Fe] doses. The combination of both T1 and T2 contrast enhancement could be of significant clinical interest, potentially providing more robust MR imaging via self-confirmation with better differentiation of tissues, including normal and diseased areas. A dual-mode contrast agent could potentially eliminate or at least reduce possible ambiguities in a single-mode contrast-enhanced scan, particularly when in vivo artifacts are present.41
SNR results show that image quality can be dramatically improved by integrating the spatial resolution provided by MR imaging into the PET images. SNRPET increases by up to ≈ 87% for T1W MR images. In addition, the LSF profiles also showed that the spatial resolution of the PET-MR image is higher than the PET image alone by a factor of  . This demonstrates the advantage that simultaneous PET-MR provides to imaging applications that require high SNR as well as high contrast. This can be clinically significant, since using [89Zr]Zr-FH nanoplatform can offer a T1 (as well as T2) enhancement at lower FH [Fe] which results in bright images with better resolution. Moreover, since the [89Zr]Zr activity is relatively smaller at lower [89Zr]Zr-FH [Fe] concentration (due to smaller 89Zr4+ loading per FH), the SNR and resolution of the co-registered PET-MR images can improve significantly by integrating the T1W MR images. These results demonstrate the proof-of-principle that at a relatively low [89Zr]Zr-FH dosage, integrating the high spatial resolution of contrast-enhanced MR images with high sensitivity PET images can achieve an overall image quality exceeding that which could be achieved separately with PET alone or MR without a contrast-enhancing agent.
For more than a decade, Feraheme has been utilized in clinics intravenously for anemia treatment in adult patients with chronic kidney disease.42,43 Additionally, FH SPIONs are integrated in the human body via metabolism of iron, and red blood cells production44 and are stored in the body as ferritin causing minimal harm.45 The results presented in this study demonstrate the following important potential clinical applications: 1) Feraheme can be utilized as a clinically safe T2 MRI contrast agent and as a safer alternative to Gd-based T1 contrast agents. It may also minimize erroneous diagnoses from intrinsic-blurred dark T2 signals in hypointense areas (e.g. calcification, metal deposition and bleeding).46 This has contributed to radiologists favoring T1 bright contrast over T2 dark contrast. However, the most commonly used T1 contrast agents, based on paramagnetic Gd, can cause adverse effects in patients with severe nephrogenic systemic fibrosis (NSF). Side effects include impaired renal function47 and long-term deposition of Gd in the brain.48,49 Additionally, the short lifetime in blood of Gd chelates limits the imaging window and reduces the signal-to-background contrast.50 Therefore, the development of a benign alternative to Gd-based contrast agents is a pressing concern in the field of cancer imaging. 2) Dual T1/T2 Feraheme imaging can offer a unique platform to minimize false diagnoses in conventional T2 MR imaging.51 3) The relaxometric map derived in this study can potentially be used as a guide for choosing the appropriate MR parameters for dual T1/T2 pre-clinical or clinical imaging. 4) The phantom imaging presented demonstrates the first simultaneous PET-MR imaging using 89Zr-FH and builds on our previous study demonstrating sequential PET-CT imaging with radiolabeled FH.10 We have shown that the PET and MR images can be utilized in a complementary manner to obtain more accurate diagnostic images (by utilizing the high MR spatial resolution and high sensitivity of the PET signals). 5) The field of imaging in nuclear medicine has increasingly focused on the radiometal 89Zr, which has a clinically favorable long physical half-life (78.41 hrs) and chemical properties for immunoPET imaging.52–55 Therefore, 89Zr-FH could potentially be utilized for immunoPET imaging.
Conclusion
We have demonstrated proof-of-principle of a PET-MR nano-platform by achieving synthesis [89Zr]Zr-FH with high RCY (92%) and RCP (98%), and showing the multi-modal imaging capability of [89Zr]Zr-FH. We have further demonstrated that FH can act as a dual-mode T1/T2 contrast agent, from the SNR, RCW and spatial resolution analyses, we can conclude that the PET and MR images combine in a complementary manner to result in an overall superior image with a higher spatial resolution (FWHM enhanced by a factor of  3) and SNR (enhanced by a factor of
  8) for co-registered PET-MR images while using a clinically relevant dose of radio-isotope and [Fe].
Abbreviations
CMD, carboxymethyl dextran; CTW, chelex-treated water; DFO, deferoxamine mesylate salt; DIW, deionized water; ESF, edge-smearing function; FSE, fast spin echo; FH, Feraheme (Ferumoxytol); FWHM, full width at half maximum; [Fe], iron concentration; HIR, heat-induced radiolabeling; LSF, line spread function; MR, magnetic resonance; PET, positron emission tomography; Radio-TLC, radio-thin layer chromatography; RCP, radiochemical purity; RCY, radiochemical yield; RCW, relative contrast to water; ROI, region of interest; SEC, size-exclusion chromatography; SNR, signal-to-noise ratio; SPION, super-paramagnetic iron oxide nanoparticle; TEM, transmission electron microscopy; TE, time-to-echo; TR, repetition time; T1W, T1-weighted; T2W, T2-weighted.
Disclosure
The authors report no conflicts of interest in this work.
References
1. Corot C, Robert P, Idée J-M, Port M. Recent advances in iron oxide nanocrystal technology for medical imaging. Adv Drug Deliv Rev. 2006;58:1471–1504. doi:10.1016/j.addr.2006.09.013
2. Weinstein JS, Varallyay CG, Dosa E, et al. Superparamagnetic iron oxide nanoparticles: diagnostic magnetic resonance imaging and potential therapeutic applications in neurooncology and central nervous system inflammatory pathologies, a review. J Cereb Blood Flow Metab. 2010;30:15–35. doi:10.1038/jcbfm.2009.192
3. Iv M, Telischak N, Feng D, et al. Clinical applications of iron oxide nanoparticles for magnetic resonance imaging of brain tumors. Nanomed. 2015;10:993–1018. doi:10.2217/nnm.14.203
4. Toth GB, Varallyay CG, Horvath A, et al. Current and potential imaging applications of ferumoxytol for magnetic resonance imaging. Kidney Int. 2017;92:47–66. doi:10.1016/j.kint.2016.12.037
5. Daldrup-Link HE, Golovko D, Ruffell B, et al. MRI of tumor-associated macrophages with clinically applicable iron oxide nanoparticles. Clin Cancer Res. 2011;17:5695–5704. doi:10.1158/1078-0432.CCR-10-3420
6. Weissleder R, Nahrendorf M, Pittet MJ. Imaging macrophages with nanoparticles. Nat Mater. 2014;13:125–138.
7. Gholami YH, Josephson L, Akam EA, et al. A chelate-free nano-platform for incorporation of diagnostic and therapeutic isotopes. Intl J Nanomed. 2020;15:31–47. doi:10.2147/IJN.S227931
8. Normandin MD, Yuan H, Wilks MQ, et al. Heat-induced radiolabeling of nanoparticles for monocyte tracking by PET. Angew. Chem. Int. Ed Engl. 2015;54:13002–13006. doi:10.1002/anie.v54.44
9. Yuan H, Wilks MQ, El Fakhri G, et al. Heat-induced-radiolabeling and click chemistry: a powerful combination for generating multifunctional nanomaterials. PLoS One. 2017;12:e0172722. doi:10.1371/journal.pone.0172722
10. Boros E, Bowen AM, Josephson L, Vasdev N, Holland JP. Chelate-free metal ion binding and heat-induced radiolabeling of iron oxide nanoparticles. Chem Sci. 2015;6:225–236. doi:10.1039/C4SC02778G
11. Shi S, Xu C, Yang K, et al. Chelator-free radiolabeling of nanographene: breaking the stereotype of chelation. Angew Chem Int Ed Engl. 2017;56:2889–2892. doi:10.1002/anie.201610649
12. Lamb J, Holland JP. Advanced methods for radiolabeling multimodality nanomedicines for SPECT/MRI and PET/MRI. J Nucl Med off Publ Soc Nucl Med. 2018;59:382–389.
13. Drzezga A, Souvatzoglou M, Eiber M, et al. First clinical experience with integrated whole-body PET/MR: comparison to PET/CT in patients with oncologic diagnoses. J Nucl Med. 2012;53:845–855. doi:10.2967/jnumed.111.098608
14. Catana C, Guimaraes AR, Rosen BR. PET and MR imaging: the odd couple or a match made in heaven? J Nucl Med. 2013;54:815–824. doi:10.2967/jnumed.112.112771
15. Balyasnikova S, Löfgren J, de Nijs R, et al. PET/MR in oncology: an introduction with focus on MR and future perspectives for hybrid imaging. Am J Nucl Med Mol Imaging. 2012;2:458–474.
16. Wong RM, Gilbert DA, Liu K, Louie AY. Rapid size-controlled synthesis of dextran-coated, 64Cu-doped iron oxide nanoparticles. ACS Nano. 2012;6:3461–3467. doi:10.1021/nn300494k
17. Pellico J, Ruiz-Cabello J, Saiz-Alía M, et al. Fast synthesis and bioconjugation of 68Ga core‐doped extremely small iron oxide nanoparticles for PET/MR imaging. Contrast Media Mol Imaging. 2016;11:203–210. doi:10.1002/cmmi.v11.3
18. Turkbey B, Agarwal HK, Shih J, et al. A Phase I dosing study of ferumoxytol for MR lymphography at 3 T in patients with prostate cancer. Am. J. Roentgenol. 2015;205:64–69. doi:10.2214/AJR.14.13009
19. Harisinghani M, Ross RW, Guimaraes AR, Weissleder R. Utility of a new bolus-injectable nanoparticle for clinical cancer staging. Neoplasia N Y N. 2007;9:1160–1165. doi:10.1593/neo.07940
20. Borra RJ, Cho H-S, Bowen SL, et al. Effects of ferumoxytol on quantitative PET measurements in simultaneous PET/MR whole-body imaging: a pilot study in a baboon model. EJNMMI Phys. 2015;2. doi:10.1186/s40658-015-0109-0
21. Rossin R, Pan D, Qi K, et al. 64Cu-labeled folate-conjugated shell cross-linked nanoparticles for tumor imaging and radiotherapy: synthesis, radiolabeling, and biologic evaluation. J Nucl Med. 2005;46:1210–1218.
22. Li G, Wang X, Zong S, et al. MicroPET imaging of CD13 expression using a (64)Cu-labeled dimeric NGR peptide based on sarcophagine cage. Mol Pharm. 2014;11:3938–3946. doi:10.1021/mp500354x
23. Jalilian AR, Hosseini-Salekdeh SL, Mahmoudi M, et al. Preparation and biological evaluation of radiolabeled-folate embedded superparamagnetic nanoparticles in wild-type rats. J Radioanal Nucl Chem. 2011;287:119–127. doi:10.1007/s10967-010-0661-y
24. Thorek DLJ, Ulmert D, Diop N-FM, et al. Non-invasive mapping of deep-tissue lymph nodes in live animals using a multimodal PET/MRI nanoparticle. Nat Commun. 2014;5:3097. doi:10.1038/ncomms4097
25. Bushberg JT, Boone JM. The Essential Physics of Medical Imaging. Lippincott Williams & Wilkins; 2011.
26. Mills AF, Sakai O, Anderson SW, Jara H. Principles of quantitative MR imaging with illustrated review of applicable modular pulse diagrams. Radiogr Rev Publ Radiol Soc N Am Inc. 2017;37:2083–2105.
27. Yuan H, Wilks MQ, Normandin MD, et al. Heat-induced radiolabeling and fluorescence labeling of Feraheme nanoparticles for PET/SPECT imaging and flow cytometry. Nat Protoc. 2018;13:392–412. doi:10.1038/nprot.2017.133
28. McCullough BJ, Kolokythas O, Maki JH, Green DE. Ferumoxytol in clinical practice: implications for MRI. J Magn Reson Imaging. 2013;37:1476–1479. doi:10.1002/jmri.23879
29. Okuhata Y. Delivery of diagnostic agents for magnetic resonance imaging. Adv Drug Deliv Rev. 1999;37:121–137. doi:10.1016/S0169-409X(98)00103-3
30. Zhou Z, Bai R, Munasinghe J, et al. T1-T2 dual-modal magnetic resonance imaging: from molecular basis to contrast agents. ACS Nano. 2017;11:5227–5232. doi:10.1021/acsnano.7b03075
31. Szpak A, Fiejdasz S, Prendota W, et al. T1-T2 Dual-modal MRI contrast agents based on superparamagnetic iron oxide nanoparticles with surface attached gadolinium complexes. J Nanoparticle Res Interdiscip Forum Nanoscale Sci Technol. 2014;16:2678.
32. Sharma VK, Alipour A, Soran-Erdem Z, Aykut ZG, Demir HV. Highly monodisperse low-magnetization magnetite nanocubes as simultaneous T1–T2 MRI contrast agents. Nanoscale. 2015;7:10519–10526. doi:10.1039/C5NR00752F
33. Zhu D, Liu F, Ma L, Liu D, Wang Z. Nanoparticle-based systems for T1-weighted magnetic resonance imaging contrast agents. Int J Mol Sci. 2013;14:10591–10607. doi:10.3390/ijms140510591
34. Bao Y, Sherwood JA, Sun Z. Magnetic iron oxide nanoparticles as T1 contrast agents for magnetic resonance imaging. J Mater Chem C. 2018;6:1280–1290. doi:10.1039/C7TC05854C
35. Tromsdorf UI, Bruns OT, Salmen SC, Beisiegel U, Weller H. A highly effective, nontoxic T1 MR contrast agent based on ultrasmall PEGylated iron oxide nanoparticles. Nano Lett. 2009;9:4434–4440. doi:10.1021/nl902715v
36. Hannecart A, Stanicki D, Vander Elst L, et al. Nano-thermometers with thermo-sensitive polymer grafted USPIOs behaving as positive contrast agents in low-field MRI. Nanoscale. 2015;7:3754–3767. doi:10.1039/C4NR07064J
37. Zeng J, Jing L, Hou Y, et al. Anchoring group effects of surface ligands on magnetic properties of Fe3O4 nanoparticles: towards high performance MRI contrast agents. Adv Mater. 2014;26:2694–2698. doi:10.1002/adma.201304744
38. Smolensky ED, Park H-YE, Berquó TS, Pierre VC. Surface functionalization of magnetic iron oxide nanoparticles for MRI applications - effect of anchoring group and ligand exchange protocol. Contrast Media Mol Imaging. 2011;6:189–199. doi:10.1002/cmmi.417
39. Fernández-Barahona I, Muñoz-Hernando M, Pellico J, Ruiz-Cabello J, Herranz F. Molecular imaging with 68Ga radio-nanomaterials: shedding light on nanoparticles. Appl Sci. 2018;8:1098. doi:10.3390/app8071098
40. Knobloch G, Colgan T, Wiens CN, et al. Relaxivity of ferumoxytol at 1.5T and 3.0T. Invest Radiol. 2018;53:257–263. doi:10.1097/RLI.0000000000000434
41. Yoo D, Lee J-H, Shin T-H, Cheon J. Theranostic magnetic nanoparticles. Acc Chem Res. 2011;44:863–874.
42. Lu M, Cohen MH, Rieves D, Pazdur R. FDA report: ferumoxytol for intravenous iron therapy in adult patients with chronic kidney disease. Am J Hematol. 2010;85:315–319. doi:10.1002/ajh.21656
43. Singh A, Patel T, Hertel J, et al. Safety of ferumoxytol in patients with anemia and CKD. Am J Kidney Dis. 2008;52:907–915. doi:10.1053/j.ajkd.2008.08.001
44. Weissleder R, Stark DD, Engelstad BL, et al. Superparamagnetic iron oxide: pharmacokinetics and toxicity. AJR Am J Roentgenol. 1989;152:167–173. doi:10.2214/ajr.152.1.167
45. Byrne SL, Krishnamurthy D, Wessling-Resnick M. Pharmacology of iron transport. Annu Rev Pharmacol Toxicol. 2013;53. doi:10.1146/annurev-pharmtox-010611-134648
46. Terreno E, Castelli DD, Viale A, Aime S. Challenges for molecular magnetic resonance imaging. Chem Rev. 2010;110:3019–3042. doi:10.1021/cr100025t
47. Hasebroock KM, Serkova NJ. Toxicity of MRI and CT contrast agents. Expert Opin Drug Metab Toxicol. 2009;5:403–416. doi:10.1517/17425250902873796
48. McDonald RJ, McDonald JS, Kallmes DF, et al. Intracranial gadolinium deposition after contrast-enhanced MR imaging. Radiology. 2015;275:772–782. doi:10.1148/radiol.15150025
49. Kanal E, Tweedle MF. Residual or retained gadolinium: practical implications for radiologists and our patients. Radiology. 2015;275:630–634. doi:10.1148/radiol.2015150805
50. Van Wagoner M, Worah D. Gadodiamide injection. First human experience with the nonionic magnetic resonance imaging enhancement agent. Invest Radiol. 1993;28(Suppl 1):S44–S48. doi:10.1097/00004424-199303001-00005
51. Wehrli FW. Magnetic resonance of calcified tissues. J Magn Reson San Diego Calif 1997. 2013;229:35–48.
52. Deri MA, Zeglis BM, Francesconi LC, Lewis JS. PET imaging with 89Zr: from radiochemistry to the clinic. Nucl Med Biol. 2013;40:3–14. doi:10.1016/j.nucmedbio.2012.08.004
53. Jauw YWS, Menke-van der Houven van Oordt CW, Hoekstra OS, et al. Immuno-positron emission tomography with zirconium-89-labeled monoclonal antibodies in oncology: what can we learn from initial clinical trials? Front Pharmacol. 2016;7:131. doi:10.3389/fphar.2016.00131
54. Börjesson PKE, Jauw YW, Boellaard R, et al. Performance of immuno-positron emission tomography with zirconium-89-labeled chimeric monoclonal antibody U36 in the detection of lymph node metastases in head and neck cancer patients. Clin Cancer Res. 2006;12:2133–2140. doi:10.1158/1078-0432.CCR-05-2137
55. Makris NE, Boellaard R, Visser EP, et al. Multicenter harmonization of 89Zr PET/CT performance. J Nucl Med. 2014;55:264–267. doi:10.2967/jnumed.113.130112
 © 2020 The Author(s). This work is published and licensed by Dove Medical Press Limited. The
full terms of this license are available at https://www.dovepress.com/terms
and incorporate the Creative Commons Attribution
- Non Commercial (unported, 3.0) License.
By accessing the work you hereby accept the Terms. Non-commercial uses of the work are permitted
without any further permission from Dove Medical Press Limited, provided the work is properly
attributed. For permission for commercial use of this work, please see paragraphs 4.2 and 5 of our Terms.
© 2020 The Author(s). This work is published and licensed by Dove Medical Press Limited. The
full terms of this license are available at https://www.dovepress.com/terms
and incorporate the Creative Commons Attribution
- Non Commercial (unported, 3.0) License.
By accessing the work you hereby accept the Terms. Non-commercial uses of the work are permitted
without any further permission from Dove Medical Press Limited, provided the work is properly
attributed. For permission for commercial use of this work, please see paragraphs 4.2 and 5 of our Terms.