Back to Journals » Risk Management and Healthcare Policy » Volume 13
A Country Pandemic Risk Exposure Measurement Model
Authors Grima S ![]() , Kizilkaya M
, Kizilkaya M ![]() , Rupeika-Apoga R
, Rupeika-Apoga R ![]() , Romānova I
, Romānova I ![]() , Dalli Gonzi R
, Dalli Gonzi R ![]() , Jakovljevic M
, Jakovljevic M ![]()
Received 3 July 2020
Accepted for publication 4 September 2020
Published 9 October 2020 Volume 2020:13 Pages 2067—2077
DOI https://doi.org/10.2147/RMHP.S270553
Checked for plagiarism Yes
Review by Single anonymous peer review
Peer reviewer comments 3
Editor who approved publication: Professor Marco Carotenuto
Simon Grima,1 Murat Kizilkaya,2 Ramona Rupeika-Apoga,3 Inna Romānova,3 Rebecca Dalli Gonzi,4 Mihajlo Jakovljevic5– 7
1Department of Insurance, Faculty of Economics, Management and Accountancy, University of Malta, Msida, Malta; 2Department of Economics, Faculty of Economics and Administrative Sciences, Ardahan University, Ardahan, Turkey; 3Department of Business, Management and Economics, University of Latvia, Riga, Latvia; 4Department of Construction & Property Management, University of Malta, MSD, Msida, 2080, Malta; 5Institute of Comparative Economic Studies ICES, Faculty of Economics, Hosei University, Tokyo, Japan; 6Department of Global Health Economics and Policy, Faculty of Medical Sciences, University of Kragujevac, Kragujevac, Serbia; 7Department of Public Health and Healthcare Named After N.A. Semashko, I.M. Sechenov First Moscow State Medical University (Sechenov University), Moscow, Russia
Correspondence: Simon Grima
University of Malta, Msida MSD 2080, Malta
Tel +356 79 651 410
Email [email protected]
Purpose: The purpose of this study is to develop a Pandemic Risk Exposure Measurement (PREM) model to determine the factors that affect a country’s prospective vulnerability to a pandemic risk exposure also considering the current COVID-19 pandemic.
Methods: To develop the model, drew up an inventory of possible factor variables that might expose a country’s vulnerability to a pandemic such as COVID-19. This model was based on the analysis of existing literature and consultations with some experts and associations. To support the inventory of selected possible factor variables, we have conducted a survey with participants sampled from people working in a risk management environment carrying out a risk management function. The data were subjected to statistical analysis, specifically exploratory factor analysis and Cronbach Alpha to determine and group these factor variables and determine their reliability, respectively. This enabled the development of the PREM model. To eliminate possible bias, hierarchical regression analysis was carried out to examine the effect of the “Level of Experienced Hazard of the Participant (LEH)” considering also the “Level of Expertise and Knowledge about Risk and Risk Management (LEK)”.
Results: Exploratory factor analysis loaded best on four factors from 19 variables: Demographic Features, Country’s Activity Features, Economic Exposure and Societal Vulnerability (i.e. the PREM Model). This model explains 65.5% of the variance in the level of experienced hazard (LEH). Additionally, we determined that LEK explains only about 2% of the variance in LEH.
Conclusion: The developed PREM model shows that monitoring of Demographic Features, Country’s Activity Features, Economic Exposure and Societal Vulnerability can help a country to identify the possible impact of pandemic risk exposure and develop policies, strategies, regulations, etc., to help a country strengthen its capacity to meet the economic, social and in turn healthcare demands due to pandemic hazards such as COVID-19.
Keywords: COVID-19, pandemic risk, risk measurement model, hazard, exposure
Introduction
The Coronavirus or, as it is better known, COVID-19 has disrupted life as we knew it. This virus is causing a national disaster of epidemic nature with considerable economic and social impact. The United Nations (UN) defines disaster as a serious disruption of the functioning of a community or a society at any scale due to hazardous events interacting with conditions of exposure, vulnerability and capacity, leading to one or more of the following: human, material, economic and environmental losses and impacts.1 The Centre for Research on the Epidemiology of Disasters (CRED) identifies a disaster if at least one of the following criteria is met:
10 or more people are reported killed;
100 people are reported affected;
a state of emergency is declared;
a call for international assistance is issued.2 The pandemic COVID-19 meets all these criteria.
A pandemic is defined as “an epidemic occurring worldwide, or over a very wide area, crossing international boundaries and usually affecting a large number of people”.3 On the other hand, a pandemic can be defined as a natural event that causes a disruption in the functioning of the economic system that has a significant negative impact on assets, production factors, output, employment or consumption, etc.4
When a hazard arises, such as that of a pandemic, it leads to the loss of life and damage to infrastructure, emphasizing the reality that society and its assets are vulnerable to such events. According to the Sendai Framework for Disaster Risk Reduction 2015–2030, a hazard is a process, phenomenon or human activity that may cause loss of life, injury or other health impacts, property damage, social and economic disruption or environmental degradation.1 COVID-19 can be characterised as a biological hazard, since biological hazards are of organic origin or conveyed by biological vectors, including pathogenic microorganisms, toxins and bioactive substances. Examples are bacteria, viruses or parasites, as well as venomous wildlife and insects, poisonous plants and mosquitoes carrying disease-causing agents.
The COVID-19 pandemic outbreak so far, during March to June 2020 has substantially influenced the majority of the countries in the world, besides, according to the Research Note of German Deutsche Bank, experts already speak about the second wave of the virus, and highlight that during the next ten years the world can face a much more serious pandemic than COVID-19.5
Therefore, there is a need to understand the objective factors that indicate the experienced level of hazard that a country may be faced with, if or when pandemics such as COVID-19 or similar outbreaks strike.
The purpose of this study is to develop a Pandemic Risk Exposure Measurement (PREM) model to determine the factors that affect a country’s prospective vulnerability to a pandemic risk exposure such as COVID-19. These factors can be indirectly and directly affected by different factors on each other and similarly have a direct and indirect effect on vulnerability. The idea is to answer the following a priori research questions:
RQ1 – What are the factors that enable the measurement of a country’s vulnerability to a pandemic risk exposure such as COVID-19?
RQ2 – Do the factors vary according to the Level of Experienced Hazard of a country (LEH)?
RQ3 – Do the factors vary according to Level of expertise and knowledge of the respondents (LEK)?
The questions above and the forecasts noted above increase the importance of developing such a model, which can be used as a checklist for determining the status of a country in terms of possible vulnerabilities, which can later develop into hazards. It is useful for risk managers and policymakers to proactively identify the factors that make the country more vulnerable to the pandemic risk and if necessary, manage them and/or set tolerance limits, policies, regulations, rules, standards, etc. PREM could also serve as a guide for businesses in developing their business continuity plans and insurance policy documents. Insurance underwriters can also utilise this model to set the correct policy wording and premiums when underwriting risks.
Although there are various studies that have indicated factor variables that are important for addressing and measuring the vulnerability of countries, the COVID-19 pandemic has indicated a serious need to go back to the drawing board. It is important to understand the areas or functions that have been missed and to develop a tool that is flexible enough to help national risk managers and policymakers proactively identify and determine the risk vulnerabilities of their country; and devise a continuity plan that improves the measure of vulnerability of a country. This is important so as to determine when to take action or flag the problem, based on a present tolerance level.
To develop this inventory of factor variables we consulted literature on pandemics such as the COVID-19 and identified variables that might not have yet been considered. Therefore, the case of the COVID-19 pandemic was used to help add value to current measures, by updating the model with new important factor variables that might not have been seen as important until now.
Methods
For the purpose of this study, a purposely built semi-structured survey was designed by creating an inventory of factor variables that can be used to measure a country’s exposure to a pandemic risk such as COVID-19. To develop such an inventory we participated in various online forums, talks, webinars and sub-groups related to risk management during disruptions of infectious diseases such as that of COVID-19 and asked other participants and colleagues (who worked in a risk management function) to provide us with those aspects that in their opinion safeguarded or hindered a country’s preparedness against infectious diseases. This information together with that gathered from the research literature and using a thematic approach6 resulted in the construction of an initial set of 25 variables and 2 additional data measurements that reflect vulnerability of a country for a pandemic (see Table 1).
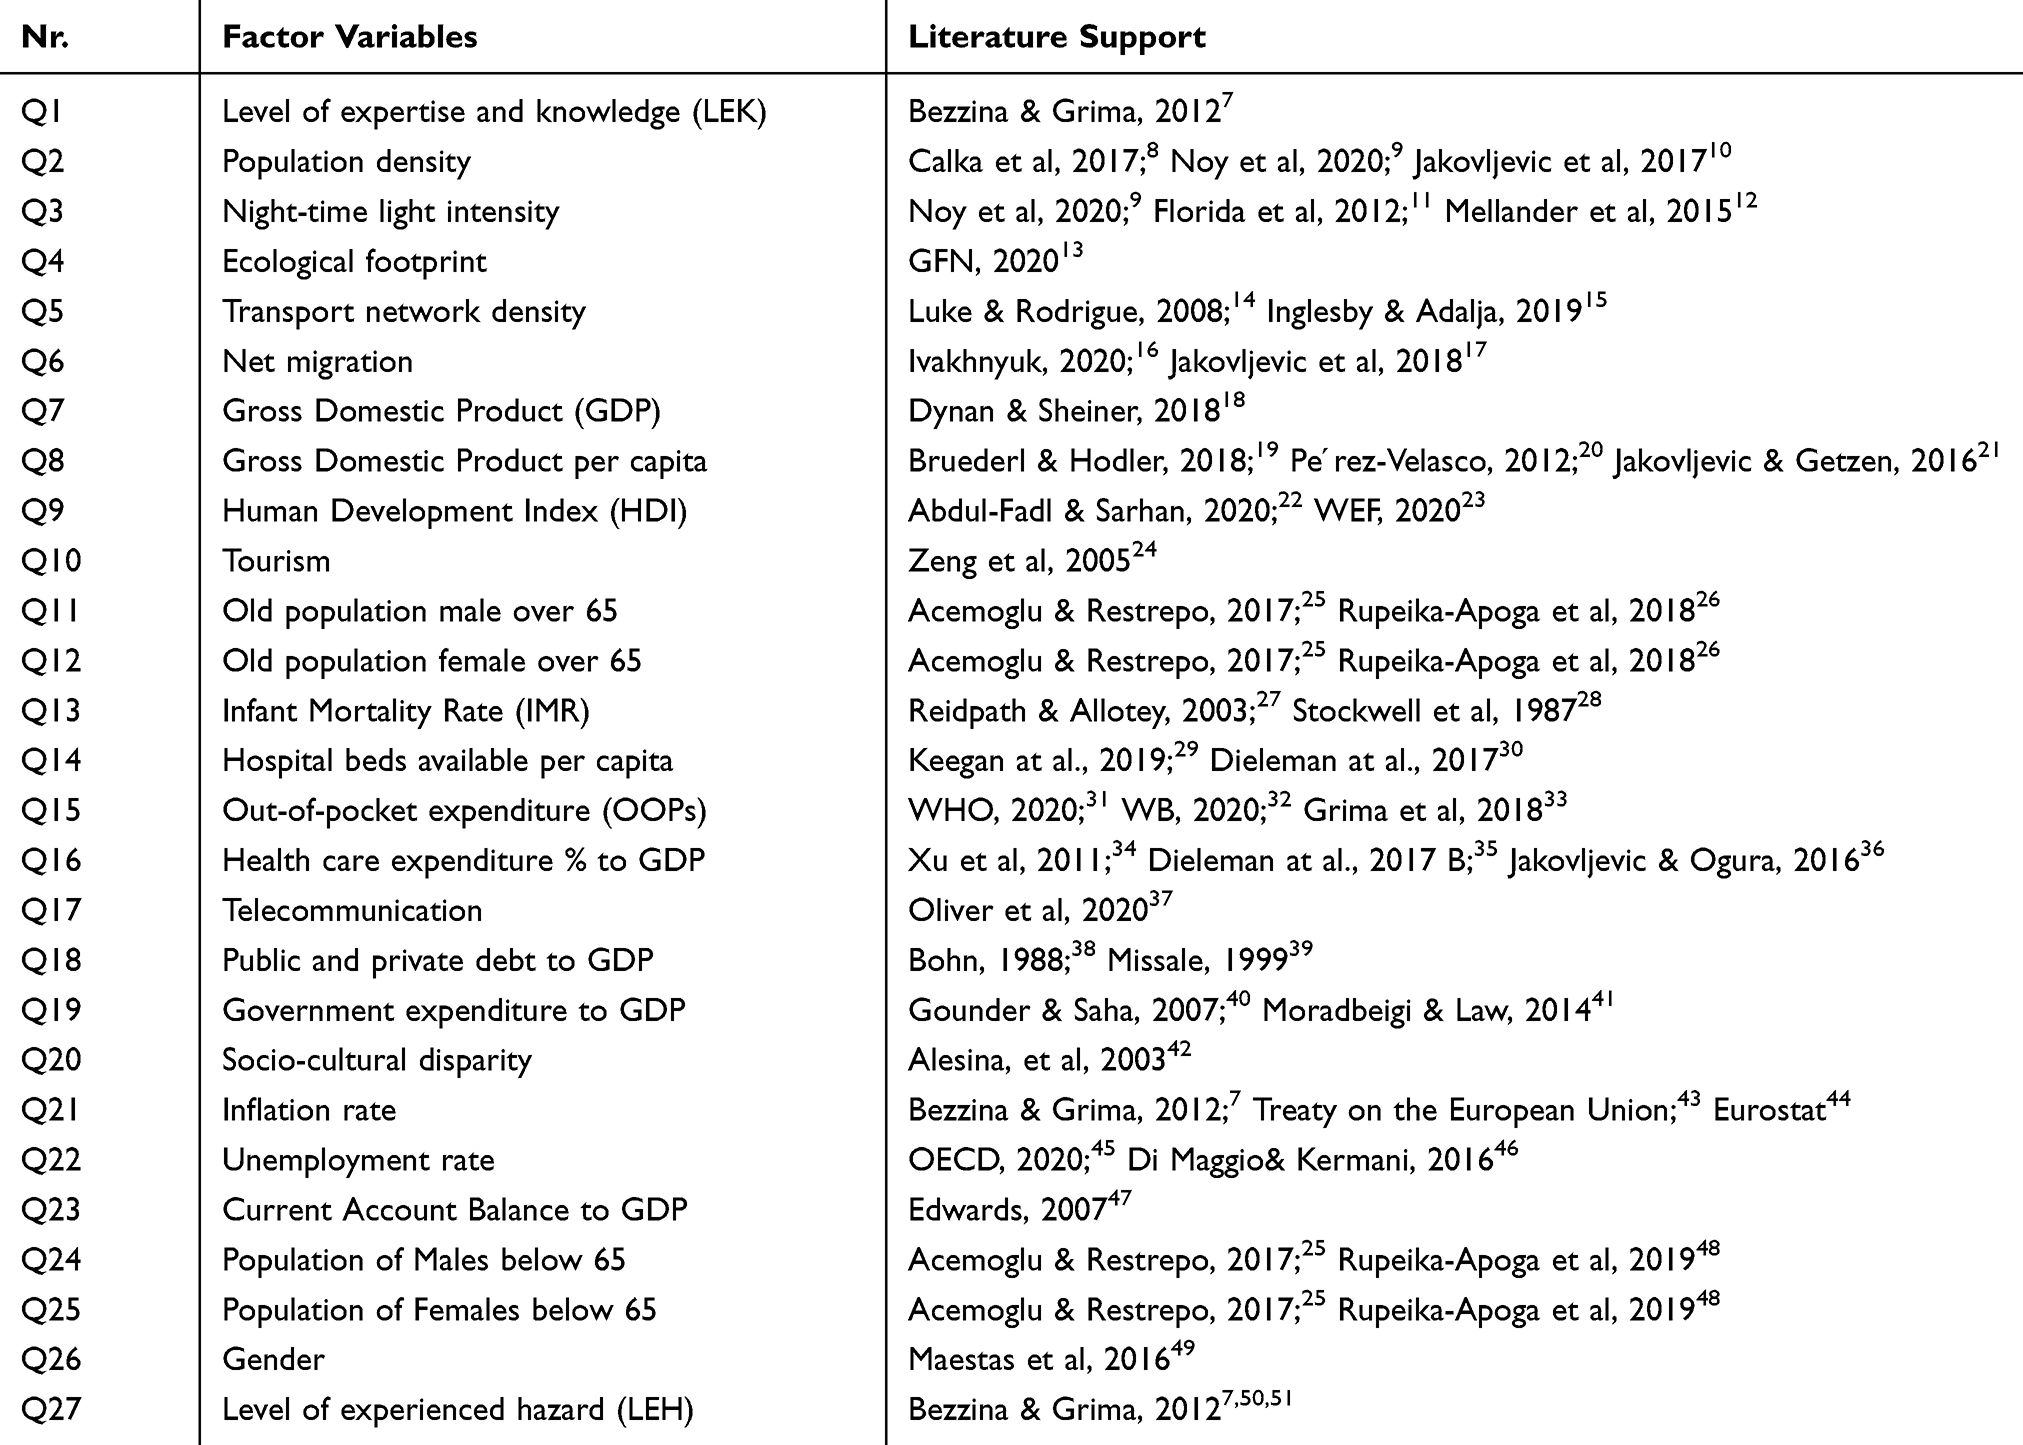 |
Table 1 Factor Variables Identified |
There exists a variety of studies on different aspects of country’s development. Some studies8 suggest such factor variables as “Population Density” measured by the number of persons per square kilometre, “Night-time Light Intensity” measured by the night light development index.9,11,12 As well as ‘the Ecological Footprint Index,13 “Transport Network Density”14,15,52 and “Net Migration Rate”.16,53,54
Various studies suggest using “Human Development Index (HDI)” as a composite index of life expectancy, education, and per capita income indicators55 and “Tourism”.24 Recent studies suggest population age structure related indicators as ‘Population over/below 65ʹ25,26,48 in conjunction with gender.56
Studies on population health measures commonly use “The Infant Mortality Rate (IMR)”.27,28 Healthcare system capacity studies emphasize the “Hospital beds available per capita”,29,30,35,57 “Out-of-pocket expenditure (OOPs)”31,32,58 and “Health care expenditure % to GDP”.30,34–36,57,59,60
There is a variety of widely used economic factor variables that influence country’s vulnerability as ‘Gross Domestic Product’18 and “GDP per capita”;19,61 “Public and private debt to GDP”38,39 and “Government expenditure to GDP”,40,41 “Inflation Rate”7 and “Unemployment rate”45,46 as well as “Current Account Balance to GDP”.47
Taking into account the specifics of the recent COVID-19 outbreak such indicators as ‘Socio-cultural disparity’42 and use of “Telecommunication” tools37 became important.
Although at the time of writing, studies on the COVID-19 pandemic and its effect on a country’s economic, social and health vulnerability measures were still limited, we were still able to uncover studies on COVID-19 and others based on similar infectious diseases and pandemics such as Severe Acute Respiratory Syndrome (SARS), the Human Immunodeficiency Viruses (HIV), etc., which helped us build the inventory laid out in Table 1.
The survey was administered as an online survey via weblink on Qualtrics to contacts of the authors on social media, namely LinkedIn, Facebook and Twitter, who worked in a risk management function (Non-probability purposive sampling). Moreover, respondents were also invited using direct emails and were also asked to send this link to others working in the risk management function (non-probability snowballing sampling). Responses were collected through Qualtrics. The URL was set to limit only one response per computer, but respondents had the option of going back to edit or update their answers until they finished. Confidentiality of responses was guaranteed. A total of 2831 completed surveys were received between May and June of 2020.
The survey consisted of three sections. The first section consisted of 2 questions, wherein Question1 we asked the participants to state whether they are working in a risk management function, which was the main filter to allow participants to continue with the survey only in the event of a positive response, and then in Question 2 (Q1), we asked them to indicate on a Likert scale of ‘1ʹ- being the lowest LEK and ‘5ʹ- being the highest LEK of the participant, their LEK. This was done to understand whether the Level of Expertise and knowledge (LEK) affected the scores provided by participants (who worked in a risk management function) in the development of the model.
In the next section, which consisted of 1 main question (Question 2), the participants were required to indicate on a 5-point scale their level of agreement with each of the 25 inventory items (Q2 to Q26) developed as described above. These items were individually operationalized via a five-point Likert scale ranging from “1” for strongly disagree to “5” for strongly agree.
The final section, Question 4 and Q27 in our proposed inventory we asked participants to provide us with an indication of their country of residence to enable us to determine their country’s exposure to the hazard/disruption and asked them to add any comments they would like to express about the subject.
We then determined “The level of Experienced Hazard of the participant (LEH)”, Q27, through the number of Coronavirus (COVID-19) cases per 1 million population as of the 9th June 2020 of their country of residence provided by the participant. The data were determined from the Worldometer website.62 We used the following scale: a score of “1”- for the lowest risk with under 499 Cases; “2” - between 500 and 999 cases; “3” - between 1000 and 1999 cases; “4” - between 2000 and 2999 cases; and “5” – for the highest risk with over 3000 cases per 1 million population. Participants with the lowest risk experience, i.e. Level 1–9.9%, Level 2–0%, Level 3–14.5%, Level 4–12.8% and Level 5 – the highest level of risk exposure 62.8%.
We then loaded all the data in a quantitative format onto IBM SPSS V26 software package through which we carried out all our statistical analysis. As a next step, to answer research question 1 (RQ1) we selected the variables and developed the PREM model using exploratory factor analysis. Exploratory factor analysis, via principal components extraction with Orthogonal rotation (Varimax with Kaise Normalization), was used to assess the construct validity of the Country Risk Exposure Index while internal-consistency reliability was assessed by computing Cronbach’s alpha coefficients. This further supported continuance of factor analysis and so the analysis proceeded. Cronbach’s alpha reliability coefficient was 0.789, KMO value was 0.712, and Bartlett test was found to be 24352.006, df 171 p <0.001.
We used Varimax rotation because the factor variables are interrelated and we reduced them to 4 grouped factors consisting of 19-factor variables. Hierarchical regression analysis was carried out to see the effect of 4 factors on “Level of Expertise and Knowledge (LEK)” and on “The level of Experienced Hazard of the participant (LEH)” to enable us to provide an answer to research question 2 and 3 – (RQ2) and (RQ3).
The hierarchical regression analysis was carried out with the obtained data in two steps. In the hierarchical regression analysis, “LEH” was used as the dependent variable. In the first stage of analysis (Model 1), the 4 obtained factors as a result of factor analysis were used as independent variables. In the second stage (Model 2), the analysis was repeated by adding the “LEK” variable to the four factors in the first stage. Thus, the effects of both 4 factors and LEK on “LEH” were measured.
Results
Analysing the completed surveys, we conclude, that 9.3% of the participants stated that their LEK was 1; 20.4% stated that their level was 2, 41.6% stated that their level was 3; 22.9% stated that their level was 4 and 5.8% stated that their level was 5.
Using exploratory factor analysis, we determined that 6-factor variables were eliminated from the model, Q6 – “Net Immigration”, Q7 – “Gross Domestic Product”, Q16-“Health Care Expenditure % to GDP”, Q26 - “Gender”, Q24 - “Population of Males below 65 years” and Q25 - “Population of Females below 65 years”. This was because these variables explained too little of the variance and this made them unstable and often unreliable because they were defined by other variables.63 This left us with the 19-factor variables included in the PREM model and exhibited in Table 2. All factors have been carefully interpreted and omitted scientifically. The factor variable Q18 –“Public and Private Debt to GDP,” which is highly related to one of two factors (Factor 3 and 4), but lower to factor 4, was attached to Factor 3.
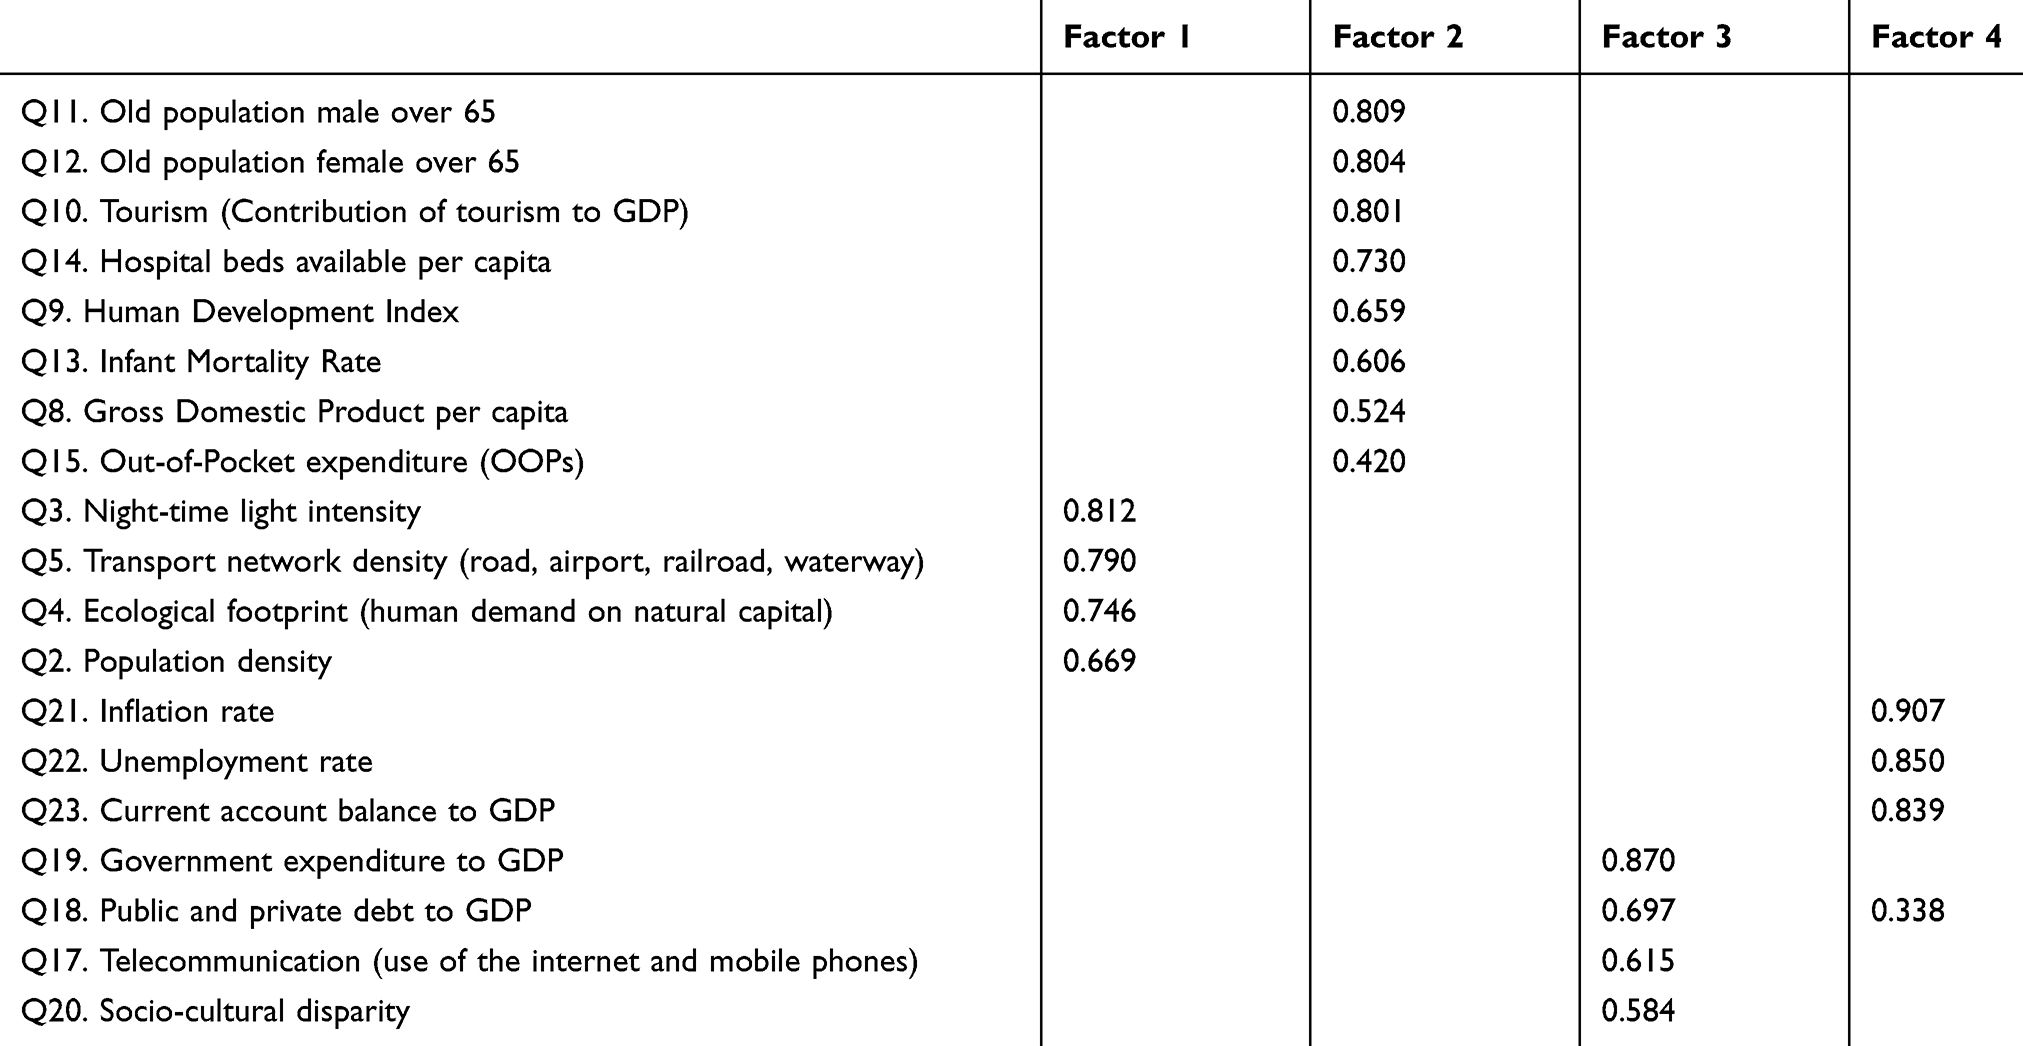 |
Table 2 Factors |
Based on the analysis made, we have identified four factors indicating vulnerability of the country: Factor 1 ‘Country’s Activity Features’, Factor 2 “Demographic Features’, Factor 3 ‘Societal Vulnerability’, and Factor 4 ‘Economic Exposure’. These factors affect a country’s prospective vulnerability to pandemic risk exposure.
Table 3 shows the factors and reliability values of the four identified factors. Cronbach’s alpha coefficient of these factors varies between 0.688 and 0.861. Of the four factors, the total variance in the survey explained 59.03%, while the factor common variances were observed to vary between 0.235 and 0.851.
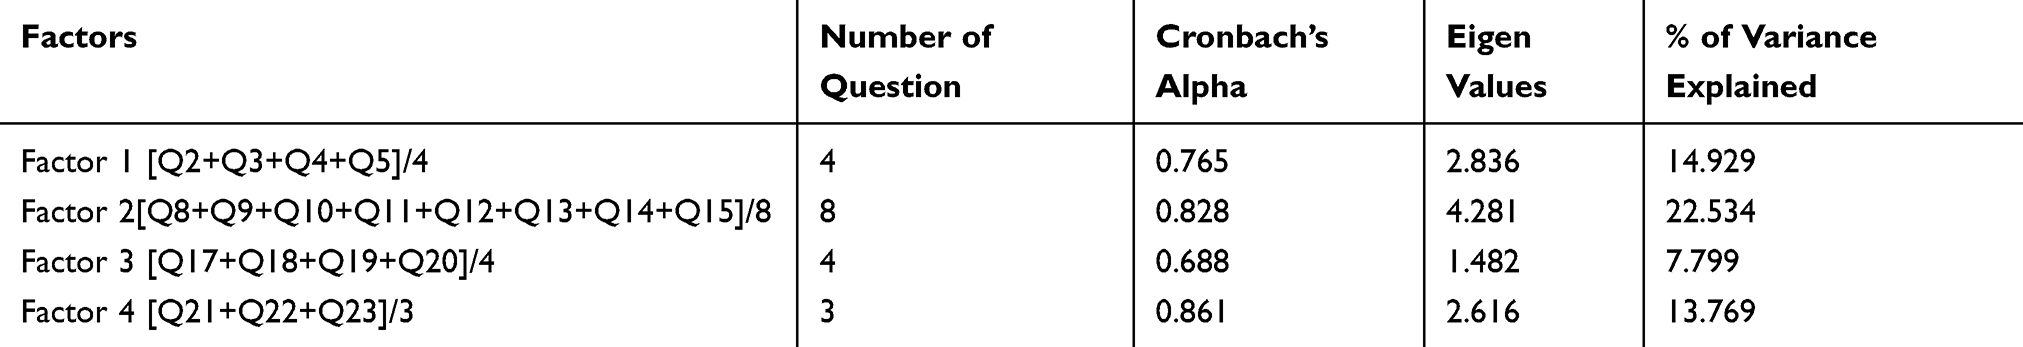 |
Table 3 Factors and Reliability Values |
The results of the hierarchical regression analysis are shown in Table 4. Results show that the 4 factors composing the PREM model [Factor 1 (Country’s Activity Features), Factor 2 (Demographic Features), Factor 3 (Societal Vulnerability), and Factor 4 (Economic Exposure)] explained 64% of the change in LEH with a high level of statistical significance (p< 0.001).
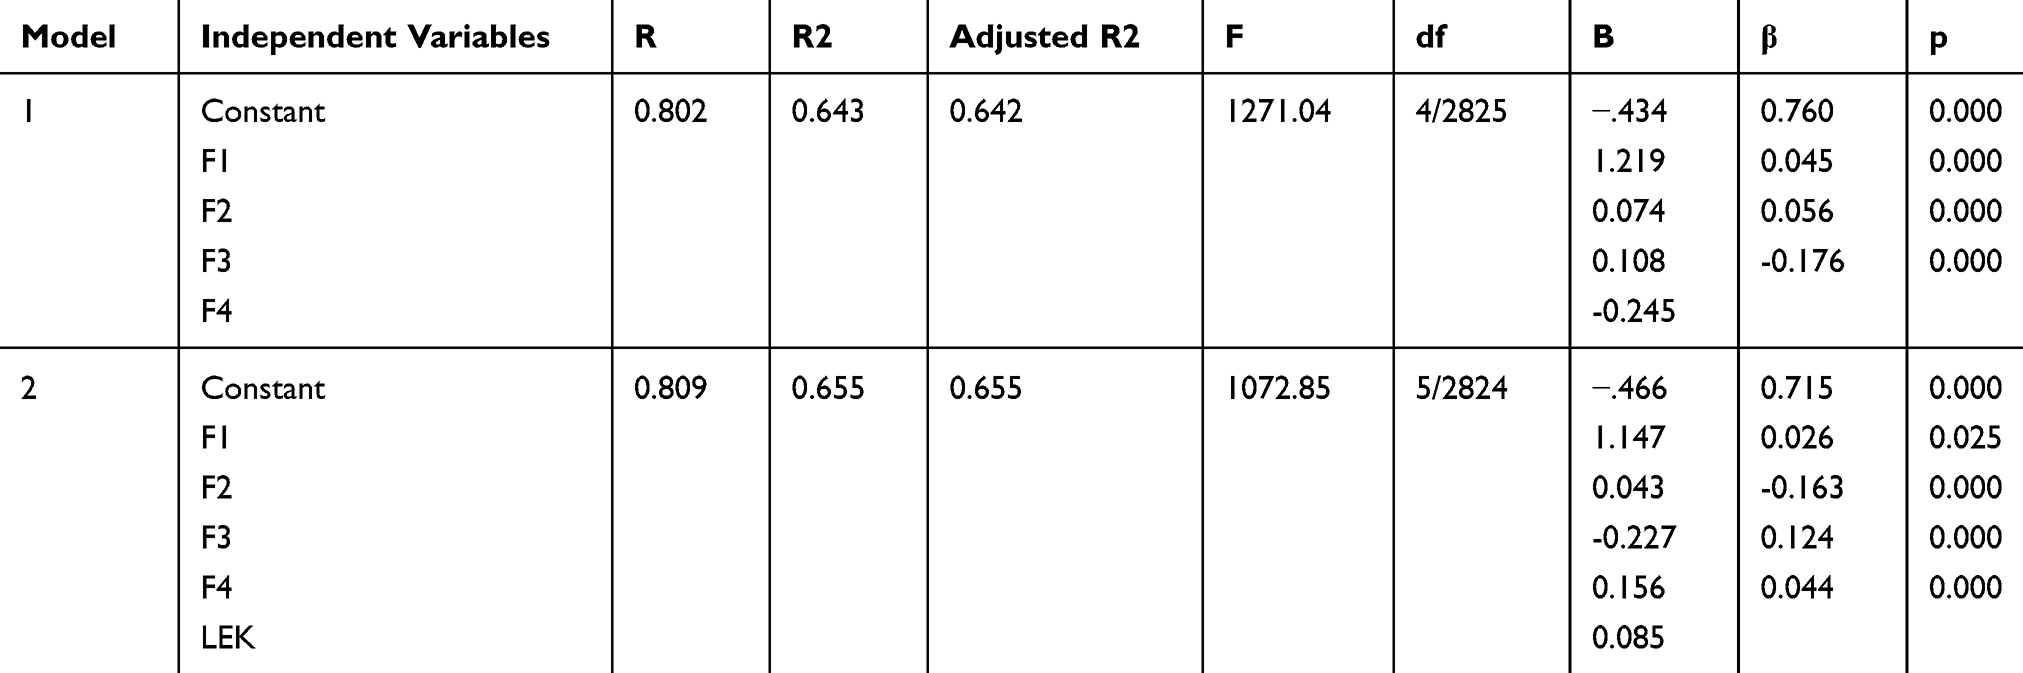 |
Table 4 Hierarchical Regression Analysis |
When the LEK variable was included in the analysis in the second stage, the rate of the total variance increased from 64% to approximately 66%. Therefore, we can conclude that the LEK variable helped to explain only another 2% with a high level of statistical significance (p < 0.05).
As noted in Table 2, the exploratory factor analysis loaded best under four factors. Factor 1 includes population density (Q2), night-time light intensity (Q3), ecological footprint (Q4) and transport network density (Q5). There is a variety of factor variables that can promote the spread of diseases, such as high population density and economic activity, ubiquitous air travel and with fast transportation comes a quick and extensive diffusion of a communicable disease.14 Many studies have shown that light at night and population density can be used as indicators of economic activity.11,12 Population density is one of the key parameters for assessing the magnitude of the population exposed to risk.8 The increase in human population density and the growth in transportation networks of roads, container ships, and airways that has now linked the global population presents more rapid and robust pathways for infectious pathogens.15 Whereas ecological footprint as a measure of human impact on the land by urbanization shows country exposure to the pandemic risk.9 Summing up, we label Factor 1, as Country’s Activity Features, as it represents the people’s activity features and infrastructure located in hazard-prone areas.
Factor 2 includes GDP per capita (Q8), HDI (Q9), Tourism (Q10), old population male over 65 (Q11), old population female over 65 (Q12), IMR (Q13), Hospital beds available per capita (Q14) and OOPs (Q15). GDP per capita is a commonly used indicator for economic and human development21 and as poverty measure20,64.HDI is a statistic composite index of life expectancy, education, and per capita income indicators, ranking countries in human development.22 Cities with robust governance and health infrastructure are in a better position to manage pandemics and have lower case fatality rates and excess mortality than those that do not.23 Meanwhile, the infant mortality rate (IMR) is a commonly used measure of population health. IMR is associated with other factor variables affecting the health status of an entire population, such as its economic development, general living conditions, social well-being, incidence rate and environmental quality.27,28 Also, COVID-19 statistics show that the older population is, the more vulnerable to the virus it is. In many countries, an ageing population is challenging the healthcare system, social security, fiscal system.25,26,48 One of the proxies for healthcare system capacity is the number of hospital beds available per capita.29 This variable has become critical because of COVID-19, as availability of excess beds means more lives are saved.35 Out-of-pocket payments (OOPs) signify spending on health directly out of pocket by households in each country. Dependence on OOPs varies widely around the world, but there is a very strong correlation between the level of OOPs and the incidence of catastrophic and impoverished health expenditures. These two indicators are determined by the extent to which OOPs absorb a household’s financial resources.31–33 Besides, the current situation with COVID-19 has shown that countries with a high level of tourism, such as Italy, are more vulnerable to pandemics due to population flows. In this paper, we label Factor 2 as Demographic Features, because it represents variables that increase a person’s and in turn the country’s vulnerability to the effects of hazards.
Factor 3 includes telecommunication (Q17), public and private debt to GDP (Q18), government expenditure to GDP (Q19), and socio-cultural disparity (Q20). The modern economy is characterized by the increased use of telecommunication tools. During the recent COVID-19 outbreak, mobile phone data were actively used to tackle the pandemic and Internet provided timely informing and warning of population.37 Meanwhile, debt has an important role in ensuring the resilience of the country to macroeconomic and other shocks.38,39 We believe that lower level of public and private debt in case of pandemic enables the country to provide timely financial support of the economy, providing external and internal access to finance.30 Government expenditure to GDP indicates total government consumption, investment and transfer payments as a share of the country’s GDP. This indicator is seen as a factor of a country’s fiscal behaviour40 and the determinant of output volatility,41 whereas increasing government expenditure allows for reducing the negative effects of output volatility. Besides, higher government expenditure is increasing disaster mitigation capability of the country. According to Alesina et al,42 the socio-cultural disparity has an impact on the behaviour of individuals and the community as a whole especially in the case of a hazard. The contribution of the socio-cultural disparity to the pandemic risk exposure is not unambiguous. Factor 3 we label as Societal Vulnerability due to the variables indicating vulnerability of society to pandemics.
Factor 4 includes inflation rate (Q21), unemployment rate (Q22), current account balance to GDP (Q23). The inflation rate is one of the fundamental indicators of a country’s macroeconomic conditions. However, the contribution of the inflation rate to the country’s exposure to pandemic risk is not uniform. Moderate inflation stimulates economic growth making the country less vulnerable to the risk, whereas high inflation rate implies rising prices good and services, including healthcare expenditures, increasing out-of-pocket payments and making the country more vulnerable to pandemic risk. The unemployment rate is one of the fundamental macroeconomic indicators showing the number of unemployed people as a share of the labour force.45 Given a higher unemployment rate, the total output is more sensitive to demand shocks,46 making countries more vulnerable to pandemic risk. The current account balance to GDP is one of the measures of a country’s external imbalances. It indicates the level of the international competitiveness of the country. High current account deficit increases the probability of capital flow contraction47 increasing the country’s vulnerability to external shocks and more vulnerable to pandemic risk. Factor 4 we label as Economic Exposure following the economic nature of the included variables.
To the knowledge of the authors, it is the first paper, which provides a Pandemic Exposure Measurement Risk model to determine the factors that affect a country’s prospective vulnerability to a pandemic risk exposure such as COVID-19.
Before the COVID-19 pandemic, the Global Health Security Index (GHSI) was used as a measure of the country’s pandemic preparedness.65 The more developed and prosperous countries are better equipped to deal with pandemics, according to GHSI. In practice, it is better to benchmark countries during a pandemic in ways that allow information on outcomes and performance to be obtained, analysed, reported, and used in real-time.66
The recent study of measuring the economic risk of COVID-19 has computed measures for exposure (population, night-time light and transport density), vulnerability (data on economic outcomes, human development, tourism, and health quality) and resilience (Internet access, public and private debt, government expenditure, socio-cultural disparity) of the local economy to the shock of the epidemic. The study concludes that the highest economic risks are in countries and regions that do not get much global attention in normal times (such as sub-Saharan Africa) and get even less during pandemic’s spread.9
Another study used 16 independent variables, such as hospital, mosque, ATM, bank, fuel, attraction, city, footprint, road, and village, to model and map the risk of COVID-19.67
Based on the analysis of existing literature, including literature on COVID-19, consultations with experts and associations and survey conducted with risk managers we have identified the unaddressed factor variables for determining the vulnerability of countries to the pandemic.
Conclusion
With this study we aimed to develop a Pandemic Risk Exposure Measurement (PREM) model to determine the factors that affect a country’s prospective vulnerability to a pandemic risk exposure such as COVID-19. Given the current COVID-19 pandemic landscape worldwide it is important to understand several consequences. Although unpredicted by the most national and transnational level authorities, it has put to the test health financing capabilities.68 This event has revealed the limits of extension of the national hospital and intensive care unit capacities in scenarios of sudden exceptional demand for medical care. The comprehensive burden was exposed to the mature post-industrial societies and Emerging markets69 and other LMICs countries alike. Due to a variety of distinctively different historical legacies of national health system establishments, they all responded with an array of adaptive strategies. Despite the burden, efficient responses came from India, China, Russia70 and few other non-OECD economies.71 Another side of the equation was the unstable response burdened with several core inefficiencies in the traditional Western European high-income societies such as Italy, Spain72 and few others. Thus, COVID-19 has revealed huge mutual interconnectivity among the distant economic hubs of the modern-day world. Proper risk assessments and the development of effective coping strategies might be highly valuable for the public health challenges of the future. Besides, supranational actions might be needed to build up both public and private capacity to deal with pandemics.73
The developed PREM model consists of Factor 1 (Country’s Activity Features), Factor 2 (Demographic features), Factor 3 (Societal Vulnerability), and Factor 4 (Economic Exposure), and explains 65.5% of the variance in “The level of Experienced Hazard of the participant (LEH)”. We also found that “The level of Experience and Knowledge of the participant” (LEH) explains only approximately 2% of LEH.
Our developed PREM model is useful for risk managers and policymakers to proactively identify the factors that make the country more vulnerable to the pandemic risk and if necessary, manage them and/or set tolerance limits, policies, regulations, rules, standards, etc.
It is not the intention with this study to design a one size fits all model but to provide policymakers and risk managers with a list of factors to enable the identification of country exposure and thereby enable proactive management and the development of a business continuity plan.
Moreover, as noted in the methodology section the study analysis is based mainly on self-reported responses to an online survey. This was built after consultation of the literature and case studies and deliberation with experts in the area of Risk Management. Despite known weaknesses of this methodology, such as participant bias due to personal experiences; may result in classification error and underestimation or overestimation of measures.74 The case studies used, deliberation with peers and the literature review was carried out before choosing the measures, to limit this and provide a robust list of measures.36 Moreover, hierarchical regression analysis showed that the difference in the explanation of variances when Q1 – “The level of Experience and Knowledge of the participant” was added was of only approximately 2%.
Therefore, we can conclude that monitoring of these factors can help a country manage the change in their LEH and devise policies to ensure that the country strengthens its capacity to meet demands for healthcare brought about by pandemic hazards such as COVID-19. That is, to flatten the curve of healthcare, social and economic demands below the capacity and thus provide to this demand over some time. This is a flexible model which can be adjusted to the specificities of the relevant countries since the aim is to provide a way to measure vulnerability without considering the tolerance level and the controls put in place, which is dependent on the country itself. Therefore, only when the latter two variables are considered can a country give value to the PREM measure and prepare an accurate plan to ensure continuity of the norm (the variables to be considered by each country in addition to the PREM model are tolerance and the controls in place).
Research Code of Practice and Ethics Review Procedure
We declare that we have abided by the Research Ethics Review Procedures of the University of Malta, Faculty of Economics, Management and Accountancy, Malta Ethics Committee and GDPR Directive – Research and Data Protection Unique Form ID: 5581_31052020, Submitted by Professor Simon Grima to the Faculty of Economics, Management and Accountancy Ethics Committee (FREC). Since there were no ethical issues or personal data collected we were provided with an automated ethical clearance and the clearance was submitted for filing with FREC.
The survey was administered as an online survey via weblink on Qualtrics to contacts of the authors on social media, namely LinkedIn, Facebook and Twitter, who worked in a risk management function (Non-probability purposive sampling). Moreover, respondents were also invited using direct emails and were also asked to send this link to others working in the risk management function (non-probability snowballing sampling). Responses were collected through Qualtrics, no personal data were collected and/or maintained (anonymous response) and participants participated on a voluntary basis. The only filters, were that participants had to tick a box noting that they worked within a risk management function and that they consent (an informed consent) that we use the information collected for the analysis purposes of our study, before they could continue to answer the survey. An introductory paragraph describing the study was also provided at the beginning of the survey.
Acknowledgments
We would like to thank PRIMO – Public Risk Management Organisation https://www.primo-europe.eu/for their help and guidance when preparing the inventory.
Disclosure
The authors report no conflicts of interest in this work.
References
1. United Nations (UN). Report of the Open-Ended Intergovernmental Expert Working Group on Indicators and Terminology Relating to Disaster Risk Reduction. Geneva, Switzerland;2016:41
2. The Centre for Research on the Epidemiology of Disasters (CRED); 2020. Available from: https://www.emdat.be/database.
3. Last JM. A Dictionary of Epidemiology.
4. Jakovljevic M, Fernandes PO, Teixeira JP, Rancic N, Timofeyev Y, Reshetnikov V. Underlying differences in health spending within the World Health Organisation Europe Region—comparing EU15, EU post-2004, CIS, EU candidate, and CARINFONET countries. Int J Environ Res Public Health. 2019;16(17):3043. doi:10.3390/ijerph16173043
5. After COVID: the Next Massive Tail Risk; 2020. Available from: https://www.dbresearch.com/PROD/RPS_EN-PROD/RPSHOME.alias.
6. Braun V, Clarke V, Hayfield N, Terry G. Thematic Analysis. In: Liamputtong P, editor. Handbook of Research Methods in Health Social Sciences. Singapore: Springer; 2019.
7. Bezzina FH, Grima S. Exploring factors affecting the proper use of derivatives: an empirical study with active users and controllers of derivatives. Managerial Finance. 2012;38(4):414–435. doi:10.1108/03074351211207554
8. Calka B, Costa J, Bielecka J. Fine-scale population density data and its application in risk assessment. Geomatics Nat Hazards Risk. 2017;8(2):1440–1455.
9. Noy I, Doan N, Ferrarini B, Park D. Measuring the economic risk of Covid-19. COVID Economics. 2020;3:103–118.
10. Jakovljevic M, Potapchik E, Popovich L, Barik D, Getzen TE. Evolving health expenditure landscape of the BRICS nations and projections to 2025. Health Econ. 2017;26(7):844–852. doi:10.1002/hec.3406
11. Florida R, Mellander C, Gulden T. Global metropolis: assessing economic activity in urban centres based on nighttime satellite images. Prof Geographer. 2012;64(2):178–187. doi:10.1080/00330124.2011.583590
12. Mellander C, Lobo J, Stolarick K, Matheson Z. Night-Time Light Data: A Good Proxy Measure for Economic Activity? PLoS One. 2015;10(10):10. doi:10.1371/journal.pone.0139779
13. Global Footprint Network; 2020. Available from: https://www.footprintnetwork.org/resources/glossary/.
14. Luke TC, Rodrigue JP. Protecting Public Health and Global Freight Transportation Systems during an Influenza Pandemic. Am J Disaster Med. 2008;3(2):99–107. doi:10.5055/ajdm.2008.0013
15. Inglesby TV, Adalja AA. Global Catastrophic Biological Risk. Springer; 2019.
16. Ivakhnyuk I. Coronavirus pandemic challenges migrants worldwide and in Russia. Population Eco. 2020;4(2):49–55. doi:10.3897/popecon.4.e53201
17. Jakovljevic M, Camilleri C, Rancic N, et al. Cold War Legacy in Public and Private Health Spending in Europe. Front Public Health. 2018;6:215. doi:10.3389/fpubh.2018.00215
18. Dynan K, Sheiner L. GDP as a Measure of Economic Well-being. Hutchins Center Working Paper. 2018;43:53.
19. Bruederle A, Hodler R. Nighttime lights as a proxy for human development at the local level. PLoS One. 2018;13(9):9. doi:10.1371/journal.pone.0202231
20. Perez Velasco R, Praditsitthikorn N, Wichmann K, et al. Systematic Review of Economic Evaluations of Preparedness Strategies and Interventions against Influenza Pandemics. PLoS One. 2012;7(2):2. doi:10.1371/journal.pone.0030333
21. Jakovljevic M, Getzen TE. Growth of global health spending share in low and middle-income countries. Front Pharmacol. 2016;7:21. doi:10.3389/fphar.2016.00021
22. Abdul-Fadl A, Sarhan A. Using Human development indices do identify indicates to monitor the coronavirus pandemic. J Curr Viruses Treat Methodol. 2020;1(1):48–57.
23. How cities around the world are handling COVID-19 - and why we need to measure their preparedness. The World Economic Forum COVID Action Platform; 2020. Available from: https://www.weforum.org/agenda/2020/03/how-should-cities-prepare-for-coronavirus-pandemics/.
24. Zeng B, Carter RW, De Lacy T. Short-term Perturbations and Tourism Effects: the Case of SARS in China. Curr Issues Tourism. 2005;8(4):306–322. doi:10.1080/13683500508668220
25. Acemoglu D, Restrepo P. Secular Stagnation? The Effect of Ageing on Economic Growth in the Age of Automation. Am Eco Rev. 2017;107(5):174–179. doi:10.1257/aer.p20171101
26. Rupeika-Apoga R, Zaidi SH, Thalassinos YE, Thalassinos EI. Bank stability: the Case of Nordic and non-Nordic banks in Latvia. Int J Eco Business Admin. 2018;6(2):39–55. doi:10.35808/ijeba/156
27. Reidpath DD, Allotey P. Infant mortality rate as an indicator of population health. Epidemiol Community Health. 2003;57(5):344–346. doi:10.1136/jech.57.5.344
28. Stockwell EG, Swanson DA, Wicks JW. The age‐cause proxy relationship in infant mortality. Soc Biol. 1987;34(3–4):249–253.
29. Keegan C, Brick A, Walsh B, Bergin A, Eighan J, Wren M-A. Wren MA. How many beds? Capacity implications of hospital care demand projections in the Irish hospital system, 2015–2030. Int J Health Planning Manag. 2019;34(1):569–582. doi:10.1002/hpm.2673
30. Dieleman J, Campbell M, Chapin A, et al. Future and potential spending on health 2015–40: development assistance for health, and government, prepaid private, and out-of-pocket health spending in 184 countries. Lancet. 2017;389(10083):2005–2030. doi:10.1016/S0140-6736(17)30873-5
31. Health financing. WHO. 2020. Available from: https://www.who.int/health_financing/topics/financial-protection/out-of-pocket-payments/en/.
32. Out-of-pocket expenditure. The World Bank; 2020. Available from: https://datacatalog.worldbank.org/public-licenses#cc-by.
33. Grima S, Spiteri JV, Jakovljevic M, et al. High Out-of-Pocket Health Spending in Countries With a Mediterranean Connection. Front Public Health. 2018;6:145.
34. Xu K, Saksena P, Holly A The determinants of health expenditure. A Country-Level Panel Data Analysis. WHO Working Paper. 2011. Available from: https://www.who.int/health_financing/documents/report_en_11_deter-he.pdf.
35. Dieleman J, Campbell M, Chapin A, et al. Evolution and patterns of global health financing 1995–2014: development assistance for health, and government, prepaid private, and out-of-pocket health spending in 184 countries. Lancet. 2017;389(10083):1981–2004. doi:10.1016/S0140-6736(17)30874-7
36. Jakovljevic MM, Ogura S. Health economics at the crossroads of centuries–from the past to the future. Fron Public Health. 2016;4:115. doi:10.3389/fpubh.2016.00115
37. Oliver N, Lepri B, Sterly H, et al. Mobile Phone Data Forinforming Public Health Actions Across The Covid-19 Pandemic Life Cycle. Sci Adv. 2020;6(23):eabc0764. doi:10.1126/sciadv.abc0764
38. Bohn H. Why Do We Have Nominal Government Debt? J Monet Econ. 1988;21(1):127–140. doi:10.1016/0304-3932(88)90050-5
39. Missale A. Public Debt Management. Oxford University Press; 1999.
40. Gounder R, Saha S. Economic Volatility, Economic Vulnerability and Foreign Aid: empirical Results for the South Pacific Island Nations. Discussion Paper. 2007(
41. Moradbeigi M, Law SH. Economic Growth Volatility and Resource Curse: the Role of Financial Development. Taylor’s Business Rev. 2014;4(2):1–17.
42. Alesina A, Devleeschauwer A, Easterly W, Kurlat S, Wacziarg R. Fractionalization. J Eco Growth. 2003;8(2):155–194. doi:10.1023/A:1024471506938
43. Treaty on the European Union. Official Journal C1911992.
44. Consumer prices - inflation. 2020. Available from: https://ec.europa.eu/eurostat/statistics-explained/index.php/Consumer_prices_-_inflation.
45. Unemployment rate. OECD. 2020. Available from: https://data.oecd.org/unemp/unemployment-rate.htm.
46. Di Maggio M, Kermani A. The Importance of Unemployment Insurance as an Automatic Stabilizer. NBER Working Paper; 2016:22625.
47. Edwards S. Capital controls capital flow contractions and macroeconomic vulnerability. J Int Money Finance. 2007;26(5):814–840. doi:10.1016/j.jimonfin.2007.04.010
48. Rupeika-Apoga R, Romanova I, Bule L, et al. The impact of population ageing and social stratification: the case of Latvia. Int J Eco Business Admin. 2019;7(1):49–63. doi:10.35808/ijeba/195
49. Maestas N, Mullen KJ, Powell D. The effect of population ageing on economic growth. Lab Force Product NBER Working Paper. 2016;22452.
50. Bezzina F, Grima S, Mamo J. Risk Management practices adopted by financial firms in Malta. Managerial Finance. 2014;40(6):587–612. doi:10.1108/MF-08-2013-0209
51. Dalli Gonzi R, Grima S, Kizilkaya M, Spiteri J. The Dali Model in Risk-Management Practice: the Case of Financial Services Firms. J Risk Financial Manag. 2019;12(4):169. doi:10.3390/jrfm12040169
52. Ahmed KF, Wang G, Silander J, et al. Statistical downscaling and bias correction of climate model outputs for climate change impact assessment in the U.S. northeast. Glob Planet Change. 2013;100:320–332. doi:10.1016/j.gloplacha.2012.11.003
53. Castañeda H, Holmes SM, Madrigal DS, Young M-ED, Beyeler N, Quesada J. Immigration as a social determinant of health. Ann Rev Public Health. 2015;36(1):375–392. doi:10.1146/annurev-publhealth-032013-182419
54. Chung RY, Griffiths SM. Migration and health in the world: a global public health perspective. Public Health. 2018;158(158):64–65. doi:10.1016/j.puhe.2018.04.005
55. Abul-Fadl A, Sarhan A. Using Human Development Indices to Identify Indicators to Monitor the Corona Virus Pandemic. J Curr Viruses Treatment Methodol. 2020;1:1.
56. Black MM, Holden EW. The Impact of Gender on Productivity and Satisfaction Among Medical School Psychologists. J Clin Psychol Med Settings. 1998;5(5):117–131. doi:10.1023/A:1026262004976
57. Dieleman JL, Squires E, Bui AL, et al. Factors Associated With Increases in US Health Care Spending, 1996–2013. JAMA. 2017;318(17):1668–1678. doi:10.1001/jama.2017.15927
58. Grima S, Spiteri JV, Jakovljevic M, et al. High out-of-pocket health spending in countries with a Mediterranean connection. Fron Public Health. 2018;6(6):145. doi:10.3389/fpubh.2018.00145
59. Dieleman JL, Baral R, Johnson E, et al. Adjusting health spending for the presence of comorbidities: an application to United States national inpatient data. Health Econ Rev. 2017;7(1):30. doi:10.1186/s13561-017-0166-2
60. Jakovljevic MM. Comparison of historical medical spending patterns among the BRICS and G7. J Med Econ. 2016;19(1):70–76.
61. Sen A, Stiglitz JE, Fitoussi J. Mis-measuring our lives: why GDP doesn’t add up? 2010.
62. Worldmeter. Worldmeter. 2020. Available from: https://www.worldometers.info/coronavirus/.
63. Tabachnick B, Fideli L. Using Multivariate Statistics.
64. Jakovljevic M, Timofeyev Y, Ranabhat C, et al. Real GDP growth rates and health care spending – comparison between the G7 and the EM7 countries. PREPRINT. 2020.
65. Global Health Security Index. 2020. Available from: https://www.ghsindex.org/.
66. Fisher D, Teo YY, Nabarro D. Assessing national performance in response to COVID-19. Lancet. 2020;17:152.
67. Pourghasemi HR, Pouyan S, Heidari B, et al. Spatial modelling, risk mapping, change detection, and outbreak trend analysis of coronavirus (COVID-19) in Iran (days between 19 February to 14 June 2020). Int J Infect Dis. 2020;89:90. doi:10.1016/j.ijid.2020.06.058
68. Ogura S, Jakovljevic M. Health Financing Constrained by Population Aging-An Opportunity to Learn from Japanese Experience. Serbian J Exp Clin Res. 2014;15(4):175–181. doi:10.2478/sjecr-2014-0022
69. Jakovljevic MM. Comparison of historical medical spending patterns among the BRICS and G7. J Med Econ. 2016;19(1):70–76. doi:10.3111/13696998.2015.1093493
70. Jakovljevic M, Timofeyev Y, Ekkert NV, et al. The impact of health expenditures on public health in BRICS nations. J Sport Health Sci. 2019;8(6):516.
71. Funke M, Tsang A. The People’s Bank of China’s response to the coronavirus pandemic-A quantitative assessment. Economic Modelling. 2020. doi:10.1016/j.econmod.2020.08.018
72. Busch C, Ludwig A, Santaeulàlia-Llopis R. Emerging evidence of a silver lining: A ridge walk to avoid an economic catastrophe in Italy and Spain. SAFE White Paper. 2020;67.
73. EIOPA. Issues Paper on Shared Resilience Solutions for Pandemics. 2020; Staff Paper.
74. Soriano JB, Kendrick PJ, Paulson KR, et al. Prevalence and attributable health burden of chronic respiratory diseases, 1990–2017: a systematic analysis for the Global Burden of Disease Study 2017. Lancet Res Med. 2020;6(8):585–596. doi:10.1016/S2213-2600(20)30105-3
 © 2020 The Author(s). This work is published and licensed by Dove Medical Press Limited. The
full terms of this license are available at https://www.dovepress.com/terms
and incorporate the Creative Commons Attribution
- Non Commercial (unported, 3.0) License.
By accessing the work you hereby accept the Terms. Non-commercial uses of the work are permitted
without any further permission from Dove Medical Press Limited, provided the work is properly
attributed. For permission for commercial use of this work, please see paragraphs 4.2 and 5 of our Terms.
© 2020 The Author(s). This work is published and licensed by Dove Medical Press Limited. The
full terms of this license are available at https://www.dovepress.com/terms
and incorporate the Creative Commons Attribution
- Non Commercial (unported, 3.0) License.
By accessing the work you hereby accept the Terms. Non-commercial uses of the work are permitted
without any further permission from Dove Medical Press Limited, provided the work is properly
attributed. For permission for commercial use of this work, please see paragraphs 4.2 and 5 of our Terms.