Back to Journals » Clinical Ophthalmology » Volume 12
A comparison of NCT, Goldman application tonometry values with and without fluorescein
Authors Erdogan H ![]() , Akingol Z
, Akingol Z ![]() , Cam O
, Cam O ![]() , Sencan S
, Sencan S ![]()
Received 21 June 2018
Accepted for publication 22 August 2018
Published 29 October 2018 Volume 2018:12 Pages 2183—2188
DOI https://doi.org/10.2147/OPTH.S177870
Checked for plagiarism Yes
Review by Single anonymous peer review
Peer reviewer comments 2
Editor who approved publication: Dr Scott Fraser
Hakika Erdogan, Ziya Akingol, Ozlem Cam, Sadik Sencan
Department of Ophthalmology, Faculty of Medicine, Maltepe University, Maltepe, Istanbul, Turkey
Purpose: The aim of the study was to statistically compare intraocular pressure (IOP) values measured using noncontact tonometer (NCT), Goldmann applanation tonometry (GAT) with fluorescein (fGAT), and GAT without fluorescein (nGAT). The study was also performed to test whether the values obtained using each technique change in accordance with the central corneal thickness (CCT) and refractive and keratometric values.
Study design: This study was a prospective study of 188 eyes of 94 healthy volunteers.
Methods: IOP was measured using fGAT, nGAT and NCT. CCT, refractive values, and keratometric values were measured, and the correlations and differences in the IOP for each tonometer were investigated.
Results: The mean IOP values obtained with the NCT, nGAT, and fGAT were 17.5±3.7, 12.3±2.7, and 12.5±2 mmHg. The mean CCT was 538.2±34.4 µm, the mean refractive value was 0.9±1.2 D, and the mean keratometric value was 43.5±1.5 D. NCT was positively correlated with fGAT and GAT values and was significantly higher than both the values. There were no differences between fGAT and GAT values. No correlation was observed between the CCT and keratometric and refractive values and the difference between NCT and nGAT or fGAT.
Conclusion: Differences in the measurements obtained using nGAT and fGAT were insignificant (P>0.05). Both values were positively correlated with NCT measurements (r=0.354, P<0.05) and were independent of CCT, keratometry, and refraction values. nGAT appears to be suitable for use in routine clinic practice.
Keywords: fluorescein, intraocular pressure, Goldmann applanation tonometry, noncontact tonometry, central corneal thickness, refractive value
Introduction
Glaucoma is defined as an optic neuropathy of multifactorial origin whose characteristic feature is optic nerve disc damage due to a loss of ganglion cells.1 Elevated intraocular pressure (IOP) has been found to be closely related to the development of glaucoma and the progression of glaucomatous damage, which is associated with nerve fiber layer loss and irreversible visual loss.2–4 Thus, precise measurement of IOP is important,5–7 and IOP measurement via tonometry is essential for ophthalmological assessment.8 The ideal device must be easy to use, fast, safe, and precise, irrespective of patient posture or age, cooperation by the patient, and variability due to examiners.9,10
In clinical practice, Goldmann applanation tonometry (GAT) is the gold standard and the most widely method for measuring IOP.11,12 Noncontact tonometer (NCT) is a commonly used method in IOP measurement, and works following similar principles with GAT without the need for topical anesthetics. NCT is well correlated with GAT. But NCT is affected by central corneal thickness (CCT) more than GAT.5 The principle of GAT is based on Imbert Fick Law.9,13 The GAT measures the force required to flatten an area of the cornea with 3.06 mm diameter.13 At this diameter, when fully flattened (applanated), the opposing forces of corneal rigidity (tending to repel the tip) and tear film meniscus capillarity (tending to attract the tip) are approximately equal and thus canceled. The tonometry head is a plastic tip with a bi-prism, which divides the image visible through the tonometer head into two equal semicircles with great accuracy. Thus, an observer can easily see the flattened cornea. For an accurate IOP measurement, the semicircles should be equal, of moderate width, and should move with the ocular pulse. The endpoint is reached when the inner edges of the semicircles contact each other at the midpoint of their split.14
Fluorescein drops applied in the inferior fornix of the eye improve visualization of the two semicircles using a cobalt blue light. Although fluorescein increases visibility of the rings in the eye, disadvantages to its use exist in the clinical practice. The amount of intraocular fluorescein to be used clinically has not been standardized. Too much fluorescein results in wide semicircles and low readings, whereas too little fluorescein results in high readings. Moreover, the discharge of tears from the eyes and blinking prevents visualization of the fluorescein dye.9,15,16 Further, the ideal contact duration for the fluorescent strip in the eye has not been standardized. This affects diameter measurement of the visualized semicircles and leads to errors in IOP diagnosis.
Lacrimation during IOP measurement after dye application, reflexive attempts by patients to wipe away the flowing dye, and patients squinting during measurement also affect the measurement results, and a second measurement is occasionally needed. The wait times needed for repeat measurements result in a loss of valuable time in intensive outpatient conditions.
It is often difficult to obtain fluorescein in hospitals in rural areas, and measurements are occasionally performed without the dye.
The aim of this study was to investigate the suitability of the values obtained using GAT without fluorescein (nGAT) compared with those obtained with a NCT and GAT with fluorescein (fGAT) in healthy subjects and to determine whether changes in CCT, keratometric values, and refractive values affect the efficacy of nGAT measurements.
Materials and methods
Subjects
This study was a prospective comparative study involving 188 eyes from 94 subjects performed at Maltepe University Ophthalmology Department in İstanbul. The study protocol was approved by our institutional review board (Ethics Committee of Maltepe University) and adhered to the tenets of the Declaration of Helsinki. Written informed consent was obtained from each subject after a full explanation of the procedures.
Inclusion criteria
- Patients aged between 18 and 60 years
- Healthy individuals
Exclusion criteria
- Patients with a history of corneal disease (such as keratoconus and dystrophy);
- Patients with a history of eye surgery or ocular trauma;
- Patients with a history of inflammatory eye disease;
- Patients with a history of systematic disease (diabetes, hypertension, pulmonary disease cardiac disease, etc);
- Patients unable to maintain fixation;
- Patients with astigmatism of 3 dioptres and above.
Technique
All procedures were explained to the subjects. The keratometric values (keratometry of the corneal dioptre), refractive values, and noncontact IOP values for all participants were obtained using a table-top auto-refractometer (Topcon TRK 1 P, Topcon, Capelle aan den Ijssel, the Netherlands). Twenty minutes after NCT, IOP was measured with a GAT (Inami L-5110 Mark, Inami and Co., Tokyo, Japan) on a mounted slit-lamp with a fluorescein strip (fluorescein, Haag-Streit International Con., Ltd, Koeniz, Switzerland) and without fluorescein between 9 and 11 am to minimize the effect of diurnal variation. Between each IOP measurement, the subjects were allowed a 20-minute rest period to recover from the aqueous outflow and to avoid error introduced by topical anesthesia. The subjects first underwent GAT measurement without fluorescein. The individuals were set on the slit-lamp’s chair. Alcaine® (Alcon Laboratories, Inc, Fort Worth, TX, USA, proparacaine hydrochloride 0.5% drop) was placed in the inferior conjunctival fornix, and the IOP was read by a single, experienced observer under the maximum light of the microscope. The applanation tip was cleaned with 70% alcohol before each examination to remove fluorescein dye and prevent infection. Twenty minutes after nGAT measurement, individuals underwent fGAT measurement with fluorescein to minimize the “Beckrakis effect”. The individuals were again set on the slit-lamp’s chair, Alcaine®, and the fluorescein strip was applied to the inferior conjunctival fornix for a few seconds, and IOP was read. IOP is measured only once for each method and each patient.
Statistical analysis
The distribution of the variables was measured using the Kolmogorov–Smirnov test. The Wilcoxon test was used for analysis of the dependent quantitative data. Spearman correlation analysis was performed, and SPSS version 22.0 (IBM Corporation, Armonk, NY, USA) was used for all analyses.
Results
The data were obtained from 188 eyes of 94 subjects. Among the subjects included in the study, 57 were females and 37 were males. The mean age was 46±13.3 years, with a range of 18–72 years.
The mean IOP values for NCT, GAT, and fGAT were 17.5±3.7, 12.3±2.7, and 12.5±2.7 mmHg, respectively (Table 1). There was no difference between males and females for IOP values.
 | Table 1 Minimum and maximum IOP value and mean ± SD for NCT, nGAT, fGAT |
As can be seen in Table 2, the mean CCT was 559.3±33 μm, the mean refractive value was 0.9±1.2 D, and the mean keratometric value was 43.3±1.5 D.
 | Table 2 Minimum–maximum value, mean value ± SD of CCT, refractive value, keratometric value |
NCT values were higher than fGAT and nGAT values, as shown in Table 1, and there was a significant difference between NCT values and fGAT and nGAT values (P<0.01, Wilcoxon test). However, there was no statistically significant difference between fGAT and nGAT values (P=0.237).
NCT values were positively correlated with fGAT (r=0.460, P<0.01 Spearman correlation) and nGAT (r=0.498, P<0.01) values (Figures 1 and 2). The mean difference in measurements obtained using different techniques was 5.1±3.4 mmHg between NCT and fGAT, 5.0±3.2 mmHg between NCT and nGAT and −0.1±1.4 between fGAT and nGAT. The Bland–Altman plots are shown in Figures 3 and 4. Concordance existed between all three techniques.
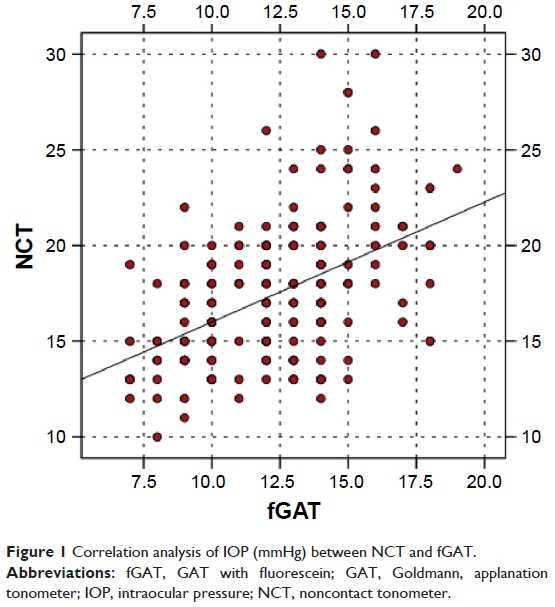 | Figure 1 Correlation analysis of IOP (mmHg) between NCT and fGAT. |
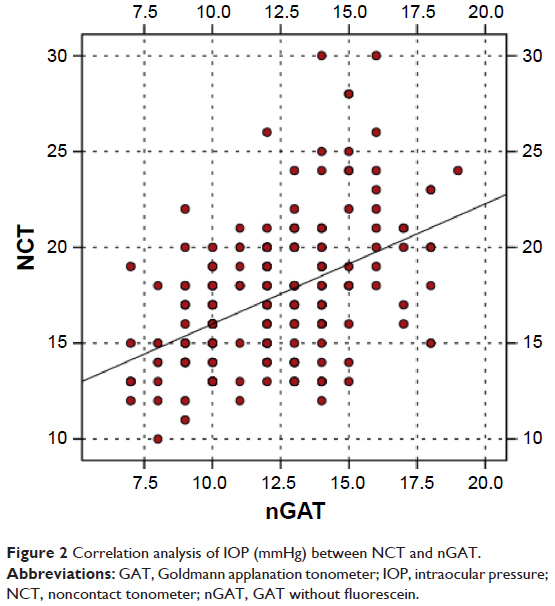 | Figure 2 Correlation analysis of IOP (mmHg) between NCT and nGAT. |
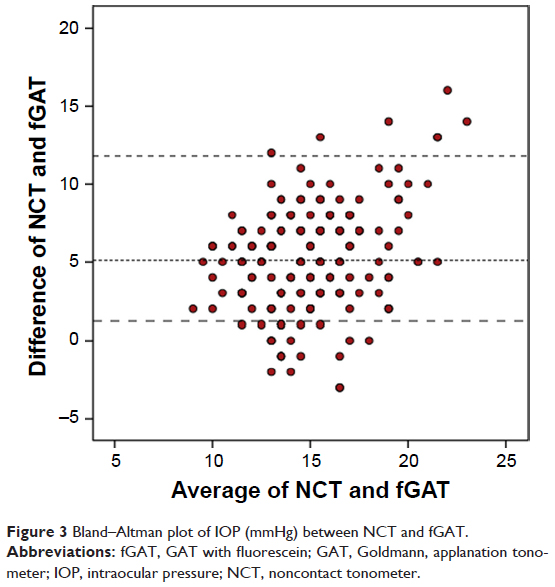 | Figure 3 Bland–Altman plot of IOP (mmHg) between NCT and fGAT. |
 | Figure 4 Bland–Altman plot of IOP (mmHg) between NCT and nGAT. |
There was a positive correlation between NCT and CCT (r=0.373, P<0.01), but fGAT and nGAT values did not increase with increasing CCT values.
Ninety eyes were hypermetropic, 38 were myopic, and 60 were emmetropic. There was no significant difference in IOP values between the three groups of eyes for each technique, and there was no correlation between the NCT, nGAT, and fGAT values and the refractive value.
There was no correlation between the keratometric value of the cornea and the NCT, fGAT, and nGAT values.
No correlation emerged between CCT (r=0.189, P=0.052), keratometric (r=0.137, P=0.062), and refractive values (r=0.140, P=0.055) and the differences between NCT and nGAT or fGAT.
Discussion
NCT is a device which used for IOP measuring that can be used by medical assistants in clinical practice under the supervision of a physician. NCT facilitates quick measurements without the requirement of topical anesthesia and fluorescence.2 Although GAT remains the gold standard method for measuring and following IOP, a significant correlation was found between nGAT and fGAT in our study.
IOP values measured via NCT and GAT have been found to be consistent, homogeneous, and not statistically different in many studies. Also, NCT provides an accurate and objective method of measuring IOP with many advantages over traditional Goldmann tonometry.17–20 However, NCT values were significantly higher than GAT values in other studies5,7,8,21 nGAT and fGAT values were correlated in our study, and these values were significantly lower than NCT values.
The restrictive features of GAT are those values measured with GAT that can vary with corneal thickness, hardness, irregularities, and curvature, as well as with inadequate or excessive use of fluorescent dye.22
Several studies have reported that the IOP values measured using both NCT and GAT are related to corneal thickness. In these studies, a statistically significant relationship was found between NCT, GAT, and corneal curvature.23,24 However, no difference in GAT values was found in subjects with high corneal thickness and those with low corneal thickness. Stabuc Silih and Hawlina21 also found no significant correlation between increased corneal thickness and GAT values. Nejabat et al25 observed that NCT and GAT were correlated with CCT, although GAT values was lower than the NCT values. In the present study, we could not ascertain an increase in CCT with increasing nGAT and fGAT values. However, we found a positive correlation between NCT and CCT. The present study finding that CCT did not correlate with IOP reading obtained via GAT or NCT is very surprising and contrary to a number of previous reports.22–24 This difference between studies may be due to the lack of accurate evaluation of corneal histology and rigidity. Different corneal hysteresis and rigidity at the same corneal thickness may lead to different IOP measurements. Studies measuring corneal hysteresis with measurement of wide corneal thickness distribution, use of different ethnic groups, measurement of corneal thickness with technically similar methods, and a comparison of studies may enable more accurate results. In the present study, corneal hysteresis or rigidity could not be evaluated. There was no wide corneal thickness distribution in the participants. These points were the limitations of the study.
Published literature shows that the relationship between NCT, GAT, and corneal curvature (keratometry of the corneal dioptre) has also been examined. This relationship was comprehensively explained by Whitacre and Stein,26 in addition to the identification of a positive correlation between corneal curvature and IOP. In some studies, as in ours, no correlations were observed between corneal curvature, NCT, and GAT.21,24 In the present study, there was also no correlation between nGAT and corneal curvature. No correlation was found between NCT and corneal curvature, whereas a negative correlation was found between GAT and corneal curvature.27 In the same study, the difference between NCT and GAT showed a positive correlation with corneal curvature. On the contrary, Fukuoka et al28 found a negative correlation between these parameters. The differing results may be due to different degrees of corneal rigidity and thickness in the participants.
Some published studies have emphasized that IOP is higher in myopic eyes.28 In particular, Sánchez-Tocino et al23 found no correlation between refraction and IOP, consistent with our study.23 We also found no relationship between nGAT and refraction. Conclusive data in this regard can only be obtained in studies in which refraction defects are selected homogeneously. Myopia prevalence is higher in some study groups. The inadequacy of our study was attributed to the low number of high myopia values.
Only two published reports have compared fGAT and nGAT, and the measurement methods used in these studies were not compared with other methods.29,30 Bright et al29 reported that the average difference between values obtained with fluorescein and those obtained without fluorescein was 7.01 mmHg and that the tonometry readings without fluorescein were lower than those with fluorescein. The difference between the two measurements was too high. It can be considered that in this group of participants there may be undiagnosed glaucoma patients or ocular hypertension patients. Arend et al30 reported that GAT measurements without the application of fluorescein were significantly lower than measurements with fluorescein. The average difference between the measurements with and without fluorescein was 1.4 mmHg. The measurements with and without fluorescein were independent of the patient age, astigmatism, reason for consulting, and IOP level, but the researchers did not investigate the correlation with corneal curvature and refractive factor, only astigmatism.30
No significant difference was found between the two tested methods, but the nGAT values are lower than the fGAT values in the present study. The differences between the studies may be due to the differences in the patient group. The age of the patients, the systemic diseases they had, and the daytime fluctuations in eye tension can affect the results of statistics.
Other reasons for different results may be related to accurate calibration of the amount of fluorescein used, irrespective of patient posture, bad cooperation by the patient, and variability due to examiners’ methodologies.
Use of nGAT avoids the problem of standardization for the amount of fluorescein used, issues resulting from differences in the use of fluorescein between operators, and false readings and dye scattering caused by the blink reflex in the patient.
We could not use a rebound tonometer or dynamic counter tonometer to compare IOP measurements. If we compared IOP measurements obtained with and without fluorescein and using a different technique, we may obtain more accurate results.
Another limitation was that we could not obtain data on the presence of glaucoma, ocular hypertension, and borderline cases. Such patients may require robust follow-up and examination. Moreover, examinations should be performed with other techniques during IOP follow-up, in which long-term results can lead to serious consequences.
Conclusion
In the present study, with all of these restrictive factors, no significant difference was found between nGAT and fGAT, and these two measurements correlated positively with significantly high NCT values. Therefore, nGAT may be a suitable substitute for fGAT in clinical practice. It is anticipated that this method will be practiced in countries and regions where the supply of fluorescence is particularly limited. Also, nGAT appears preferable than fGAT and is routinely used because it does not require fluorescein.
Data sharing statement
The data used to support the findings of this study may be provided upon request and the data should be submitted as an additional information file with email interaction.
Acknowledgment
Help for English editing was received from “Enago” service. The research did not receive specific funding and was not performed as part of the employment of the authors.
Disclosure
The authors report no conflicts of interest in this work.
References
Saenz-Frances F, Jañez L, Borrego-Sanz L, et al. Characterization of the thickness of different corneal zones in glaucoma: effect on dynamic contour, Goldmann and rebound tonometries. Acta Ophthalmol. 2013;91(8):e620–e627. | ||
Yilmaz I, Altan C, Aygit ED, et al. Comparison of three methods of tonometry in normal subjects: Goldmann applanation tonometer, non-contact airpuff tonometer, and Tono-Pen XL. Clin Ophthalmol. 2014;8:1069–1074. | ||
Patel KJ, Jain SP, Kapadia PR, Patel NV, Patel S, Patel V. Can higher end tonometers be used interchangeably in routine clinical practice? Indian J Ophthalmol. 2016;64(2):132–135. | ||
Jóhannesson G, Hallberg P, Eklund A, Behndig A, Lindén C. Effects of topical anaesthetics and repeated tonometry on intraocular pressure. Acta Ophthalmol. 2014;92(2):111–115. | ||
Lee M, Ahn J. Effects of central corneal stromal thickness and epithelial thickness on intraocular pressure using goldmann applanation and non-contact tonometers. PLoS One. 2016;11(3):e0151868. | ||
Andreanos K, Koutsandrea C, Papaconstantinou D, et al. Comparison of Goldmann applanation tonometry and Pascal dynamic contour tonometry in relation to central corneal thickness and corneal curvature. Clin Ophthalmol. 2016;10:2477–2484. | ||
Eraslan M, Çerman E, Sümmen S. Comparison of intraocular pressure measurements in healthy pediatric patients using three types of tonometers. Turk J Ophthalmol. 2017;47(1):1–4. | ||
Farhood QK. Comparative evaluation of intraocular pressure with an air-puff tonometer versus a Goldmann applanation tonometer. Clin Ophthalmol. 2013;7:23–27. | ||
Tan S, Yu M, Baig N, Hansapinyo L, Tham CC. Agreement of patient-measured intraocular pressure using rebound tonometry with Goldmann applanation tonometry (GAT) in glaucoma patients. Sci Rep. 2017;7:42067. | ||
Ottobelli L, Fogagnolo P, Frezzotti P, et al. Repeatability and reproducibility of applanation resonance tonometry: a cross-sectional study. BMC Ophthalmol. 2015;15(15):36. | ||
Clement CI, Parker DG, Goldberg I. Intra-Ocular Pressure Measurement in a Patient with a Thin, Thick or Abnormal Cornea. Open Ophthalmol J. 2016;10:35–43. | ||
Özcura F, Yıldırım N, Tambova E, Şahin A. Evaluation of Goldmann applanation tonometry, rebound tonometry and dynamic contour tonometry in keratoconus. J Optom. 2017;10(2):117–122. | ||
Mccafferty S, Lim G, Duncan W, Enikov E, Schwiegerling J. Goldmann tonometer prism with an optimized error correcting applanation surface. Transl Vis Sci Technol. 2016;5(5):4. | ||
American Academy of Ophthalmology. Glaucoma. Basic and Clinical Science Course, Section 10, 2011–2012. San Francisco: American Academy of Ophthalmology: 2011:27–29. | ||
Mohan S, Tiwari S, Jain A, Gupta J, Sachan SK. Clinical comparison of Pulsair non-contact tonometer and Goldmann applanation tonometer in Indian population. J Optom. 2014;7(2):86–90. | ||
Rüfer F. Sources of error in Goldmann applanation tonometry. Ophthalmologe. 2011;108(6):546–552. | ||
Parker VA, Herrtage J, Sarkies NJ. Clinical comparison of the Keeler Pulsair 3000 with Goldmann applanation tonometry. Br J Ophthalmol. 2001;85(11):1303–1304. | ||
Tonnu PA, Ho T, Sharma K, White E, Bunce C, Garway-Heath D. A comparison of four methods of tonometry: method agreement and interobserver variability. Br J Ophthalmol. 2005;89(7):847–850. | ||
Kao SF, Lichter PR, Bergstrom TJ, Rowe S, Musch DC. Clinical comparison of the Oculab Tono-Pen to the Goldmann applanation tonometer. Ophthalmology. 1987;94(12):1541–1544. | ||
Frenkel RE, Hong YJ, Shin DH. Comparison of the Tono-Pen to the Goldmann applanation tonometer. Arch Ophthalmol. 1988;106(6):750–753. | ||
Stabuc Silih M, Hawlina M. Influence of corneal thickness on comparative intraocular pressure measurements with Goldmann and non-contact tonometers in keratoconus. Klin Monbl Augenheilkd. 2003;220(12):843–847. | ||
Herr A, Remky A, Hirsch T, Rennings C, Plange N. Tonometry in corneal edema after cataract surgery: dynamic contour tonometry versus Goldmann applanation tonometry. Clin Ophthalmol. 2013;7:815–819. | ||
Sánchez-Tocino H, Bringas-Calvo R, Iglesias-Cortiñas D. Correlation between intraocular pressure, paquimetry and keratometry in a normal population. Arch Soc Esp Oftalmol. 2007;82(5):267–272. | ||
Matsumoto T, Makino H, Uozato H, Saishin M, Miyamoto S. The influence of corneal thickness and curvature on the difference between intraocular pressure measurements obtained with a non-contact tonometer and those with a Goldmann applanation tonometer. Jpn J Ophthalmol. 2000;44(6):691–23. | ||
Nejabat M, Heidary F, Talebnejad MR, et al. Correlation between intraocular pressure and central corneal thickness in persian children. Ophthalmol Ther. 2016;5(2):235–243. | ||
Whitacre MM, Stein R. Sources of error with use of Goldmann-type tonometers. Surv Ophthalmol. 1993;38(1):1–30. | ||
Harada Y, Hirose N, Kubota T, Tawara A. The influence of central corneal thickness and corneal curvature radius on the intraocular pressure as measured by different tonometers: noncontact and goldmann applanation tonometers. J Glaucoma. 2008;17(8):619–625. | ||
Fukuoka S, Aihara M, Iwase A, Araie M. Intraocular pressure in an ophthalmologically normal Japanese population. Acta Ophthalmol. 2008;86(4):434–439. | ||
Bright DC, Potter JW, Allen DC, Spruance RD. Goldmann applanation tonometry without fluorescein. Am J Optom Physiol Opt. 1981;58(12):1120–1126. | ||
Arend N, Hirneiss C, Kernt M. Differences in the measurement results of Goldmann applanation tonometry with and without fluorescein. Ophthalmologe. 2014;111(3):241–246. |
 © 2018 The Author(s). This work is published and licensed by Dove Medical Press Limited. The
full terms of this license are available at https://www.dovepress.com/terms
and incorporate the Creative Commons Attribution
- Non Commercial (unported, 3.0) License.
By accessing the work you hereby accept the Terms. Non-commercial uses of the work are permitted
without any further permission from Dove Medical Press Limited, provided the work is properly
attributed. For permission for commercial use of this work, please see paragraphs 4.2 and 5 of our Terms.
© 2018 The Author(s). This work is published and licensed by Dove Medical Press Limited. The
full terms of this license are available at https://www.dovepress.com/terms
and incorporate the Creative Commons Attribution
- Non Commercial (unported, 3.0) License.
By accessing the work you hereby accept the Terms. Non-commercial uses of the work are permitted
without any further permission from Dove Medical Press Limited, provided the work is properly
attributed. For permission for commercial use of this work, please see paragraphs 4.2 and 5 of our Terms.