")
Back to Journals » Diabetes, Metabolic Syndrome and Obesity » Volume 17
Use of Transcriptome Sequencing to Analyze the Effects of Different Doses of an Astragalus-Rhubarb-Saffron Mixture in Mice with Diabetic Kidney Disease
Authors Zhou X, He K, Zhao J, Wei G, You Q, Du H, Gu W, Niu H, Jin Q, Wang J, Tang F
Received 14 November 2023
Accepted for publication 8 April 2024
Published 18 April 2024 Volume 2024:17 Pages 1795—1808
DOI https://doi.org/10.2147/DMSO.S449792
Checked for plagiarism Yes
Review by Single anonymous peer review
Peer reviewer comments 2
Editor who approved publication: Prof. Dr. Antonio Brunetti
Xiaochun Zhou,1– 3,* Kaiying He,1,3,* Jing Zhao,1,3 Guohua Wei,3 Qicai You,1,3 Hongxuan Du,1,3 Wenjiao Gu,1,2 Haiyu Niu,1,4 Qiaoying Jin,1,5 Jianqin Wang,3 Futian Tang1,2
1The Second Hospital & Clinical Medical School, Lanzhou University, Lanzhou, Gansu, People’s Republic of China; 2Department of Cardiovascular Disease, The Second Hospital & Clinical Medical School, Lanzhou University, Lanzhou, Gansu, People’s Republic of China; 3Department of Nephrology, The Second Hospital & Clinical Medical School, Lanzhou University, Lanzhou, Gansu, People’s Republic of China; 4Department of Tumor, The Second Hospital & Clinical Medical School, Lanzhou University, Lanzhou, Gansu, People’s Republic of China; 5Cuiying Biomedical Research Center, The Second Hospital & Clinical Medical School, Lanzhou University, Lanzhou, Gansu, People’s Republic of China
*These authors contributed equally to this work
Correspondence: Futian Tang, Department of Cardiovascular Disease, The Second Hospital & Clinical Medical School, Lanzhou University, No. 82, Cuiyingmen, Lanzhou, Gansu, People’s Republic of China, Tel +8613321330515, Email [email protected]
Purpose: To investigate the therapeutic effect and underlying mechanism of a traditional Chinese medicine (TCM) mixture consisting of Astragalus, rhubarb, and saffron in a mouse model of diabetic kidney disease (DKD).
Methods: Forty-eight db/db mice received no TCM (DKD model), low-dose TCM, medium-dose TCM, or high-dose TCM, and an additional 12 db/m mice received no TCM (normal control). Intragastric TCM or saline (controls) was administered daily for 24 weeks. Blood glucose, body weight, serum creatinine (SCr), blood urea nitrogen (BUN), blood lipids, and urinary microalbumin were measured every four weeks, and the urinary albumin excretion rate (UAER) was calculated. After 24 weeks, kidney tissues were collected for transcriptome sequencing, and the main functions of these genes were determined via functional enrichment analysis.
Results: Compared with the DKD model group, the medium-dose and high-dose TCM groups had significantly decreased levels of SCr, BUN, total cholesterol, triglycerides, low-density lipoprotein cholesterol, high-density lipoprotein cholesterol, and UAER (all p< 0.05). We identified 42 genes that potentially functioned in this therapeutic response, and the greatest effect on gene expression was in the high-dose TCM group. We also performed functional enrichment analysis to explore the potential mechanisms of action of these different genes.
Conclusion: A high-dose of the Astragalus-rhubarb-saffron TCM provided the best prevention of DKD. Analysis of the kidney transcriptome suggested that this TCM mixture may prevent DKD by altering immune responses and oxygen delivery by hemoglobin.
Keywords: diabetic kidney disease (DKD), mixture of astragalus, rhubarb, saffron, transcriptome sequencing, db/db mice
Introduction
Diabetes mellitus (DM) is a common disease throughout the world, and diabetic kidney disease (DKD), a common and serious complication of DM, significantly decreases quality-of-life and contributes to the development of end-stage renal disease (ESRD).1 Numerous studies have examined different treatments for DKD, and some of these studies have examined inhibitors of the renin-angiotensin-aldosterone system (RAAS) and management of blood glucose and blood pressure on temporarily halting the progression of DKD. Several other therapeutic strategies may also be useful for the management of DKD, including mineralocorticoid receptor antagonists, endothelin receptor antagonists, vitamin D receptor activators, and therapies targeting inflammation and free radicals.2 Despite the availability of these and other treatment strategies, many patients with DKD still quickly progress to ESRD. Thus, it is crucial to identify novel and cutting-edge treatments for DKD that are both safe and effective.
Our group’s previous research found that an Astragalus-saffron-rhubarb mixture effectively reduced body weight and the urinary albumin excretion rate (UAER); decreased the levels of blood glucose, blood urea nitrogen (BUN), and serum creatinine (SCr); and halted the proliferation of mesangial cells.1 In addition, many other studies have demonstrated the benefits of certain traditional Chinese medicines (TCMs) for the management of chronic kidney disease (CKD).2 Importantly, these TCM treatments do not typically cause significant adverse effects. There is also evidence that certain TCMs can decrease the SCr level, increase creatinine clearance, reduce proteinuria, and alleviate CKD-associated complications.3 Additionally, numerous herbs and certain formulations of multiple herbs have been used for the treatment of CKD. Astragalus can control inflammation by functioning as an antioxidant and modifying the immune system; rhubarb and other plants in the genus Rheum have similar effects in animal models.4 Other research found that certain TCMs can ameliorate diabetes by regulating the gut microbiota, thereby decreasing the complications of diabetes.5
Many recent studies have examined the use of TCMs for the treatment of DKD, and this motivated us to examine the therapeutic effects of a specific TCM on DKD. Arctigenin, the major component of Fructus arctii (a TCM), can reduce proteinuria in patients with diabetes.6 Crocin, the main bioactive substrate of Crocus sativus, can significantly reduce the levels of glucose, SCr, BUN, and proteinuria; increase the levels of insulin and urinary creatinine clearance; and thereby improve kidney function.7 Previously, we demonstrated that administration of a combination of three TCM ingredients to diabetic rats — Astragalus, rhubarb, and saffron — improved renal function, reduced inflammation and oxidative stress, and blocked the synthesis of pro-fibrotic factors.2–4
In this study, we used transcriptomic sequencing to investigate the underlying mechanism of a TCM prescription consisting of astragalus, rhubarb, and saffron on DKD in mice, and examined possible biomarkers that can be used to evaluate the therapeutic effects of this TCM.
Materials and Methods
Animal Model
Figure 1 summarizes the study design and experimental procedures. All mice were purchased from the Nanjing Institute of Model Animals and were fed in the barrier system of the research center in Lanzhou University Second Hospital. These mice were reared at a temperature was 20 ± 2 °C and a humidity of 40–70%, with a 12 h light/12 h dark cycle. The mice received ordinary specific-pathogen-free (SPF) food and drank water freely. All experiments were performed following approval of the Lanzhou University Second Hospital Institutional Ethical Committee (approval number: D2019-198), and strictly adhered to the guidelines of the National Institutes of Health Guide for the Care and Use of Laboratory Animals.
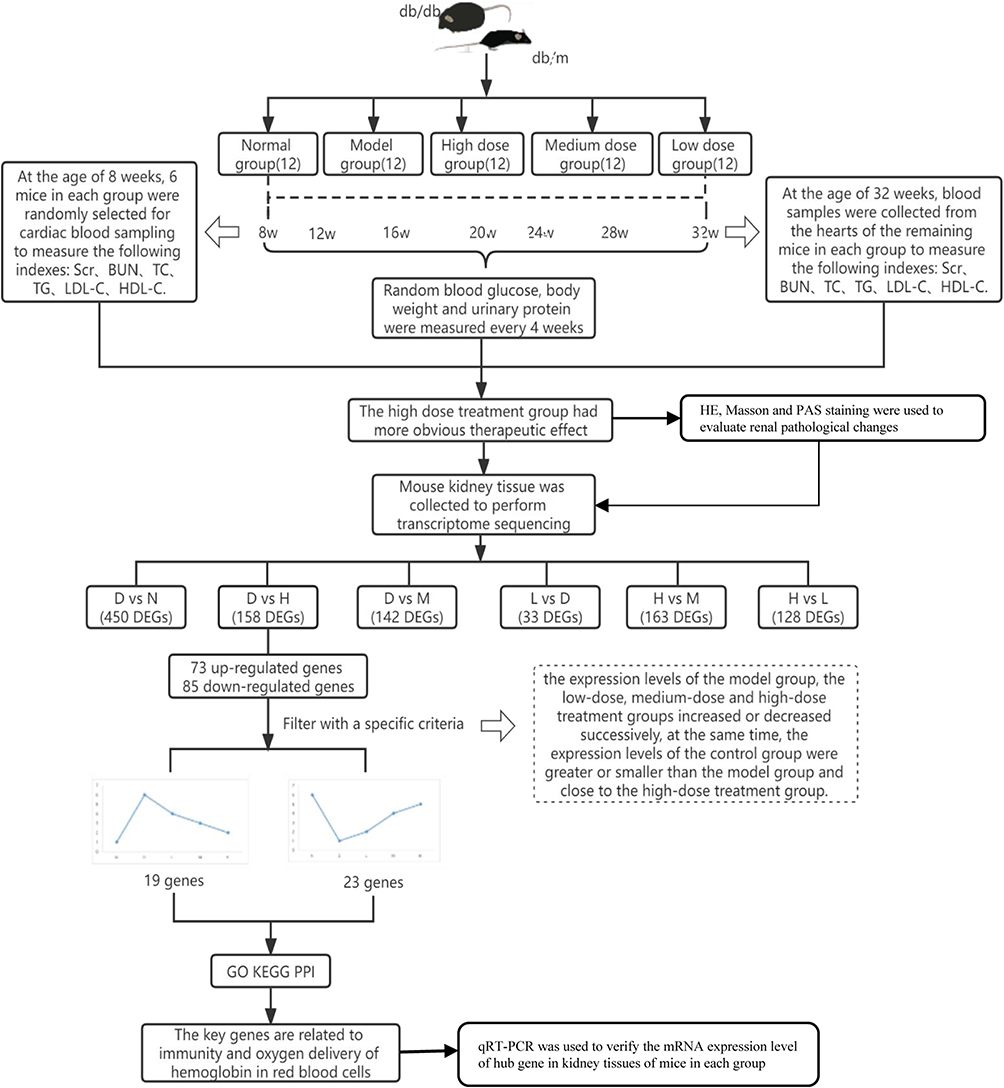 |
Figure 1 Study design. Abbreviations: N, normal control; D, DKD model; L, low-dose TCM; M, medium-dose TCM; H, high-dose TCM. |
Forty-eight 6-week-old male SPF db/db mice were randomly divided into four groups: DKD model (no TCM), high-dose TCM, medium-dose TCM, and low-dose TCM. The mean body weight of these mice at study onset was 34.35 ± 2.52 g. An additional 12 db/m mice from the same litter that were sex- and age-matched with the db/db mice were in the normal control group (mean body weight at study onset: 18.94 ± 1.44 g).
Preparation and Administration of the TCM
The TCM formulation consisted of Astragalus, rhubarb, and saffron, and was purchased from Gansu Deshengtang Medical Technology Group Co. Ltd. These herbs were processed as described in our previous study.8 First, a mixture of the herbs (ratio of 15 g Astragalus, 10 g rhubarb, and 2 g saffron) was soaked in water for 30 min, with the level of water 10 to 12 cm above the herbs. Then, this mixture was heated until boiling, and then maintained at a simmer for 30 min. Finally, the liquid was passed through four layers of gauze and the filtrate was collected.8 These steps were repeated with the residue remaining in the gauze, and the two filtrates were combined, placed in Eppendorf tubes, and stored at −20 °C prior to use.
The 6-week-old db/db mice received adaptive feeding for two weeks before study onset. Then, the 8-week-old mice were divided into high-dose, medium-dose, and low-dose TCM groups that were given different intragastric doses of the crude filtrate (8.1 g/kg·day, 5.4 g/kg·day, or 2.7 g/kg·day) for 24 weeks. The gavage volume was 0.05 mL/10 g. The DKD model group (db/db mice) and the normal control group (db/m mice) received 5 mL/kg·day of normal saline by gavage for 24 weeks.
Determination of Serum Indexes and Urinary Microalbumin
Six mice in each group were randomly selected and euthanized for collection of blood from the heart after 8 weeks; the remaining six mice in each group received treatments for 24 weeks before euthanasia and collection of blood from the heart. An Agilent 2100 bioanalyzer (Agilent Technologies Inc.) and detection kit (NanJing JianCheng Bioengineering Institute) were used to measure the serum levels of SCr, BUN, total cholesterol (TC), triglycerides (TG), low-density lipoprotein cholesterol (LDL-C), and high-density lipoprotein cholesterol (HDL-C). The UAER was calculated by measuring the level of urinary microalbumin. GraphPad Prism version 8 was used to present these results.
RNA Extraction from Kidney Tissues and Preparation for Sequencing
The TRIzol Reagent (Thermo Fisher Scientific) was used to extract total RNA from the 15 samples of renal tissues that were collected from 3 randomly selected mice in each group. The purity and concentration of these RNA samples were assessed by spectrophotometry and fluorescence assays, and an Agilent 2100 Bioanalyzer was used to assess sample integrity. Degradation and contamination of the extracted RNA samples were examined by 1% agarose gel electrophoresis. After passing the quality-control checks, a 3 µg sample was used as the starting material for construction of the transcriptome sequencing library. The final cDNA library was constructed by mRNA enrichment, fragmentation of mRNA, synthesis of one and two strands of cDNA, purification of the two strands of cDNA, addition of a poly-A tail, and implementation of the quantitative real-time polymerase chain reaction (qRT-PCR).
Analysis of Sequencing Data
The original data were saved and filtered to obtain clean data, and the contents of samples with quality score 20, quality score 30, and GC sequences were determined. Then, bioinformatics software (Bowtie1) was used to build the reference gene library, and the high-quality sequences obtained above were compared with the reference genome. Finally, gene expression was determined and statistical comparisons were performed.
Differential Expression of Genes and Visualization
The DEseq2 (https://bioconductor.org/packages/DESeq2/) package in R/Bioconductor was used to determine differential analyses of gene expression. The expression levels of genes in all groups were compared with those of the DKD model group, and log2 fold-change (FC) in gene expression greater than or less than 1.5 (|log2[FC]| > 1.5, p < 0.05) was considered statistically significant. Volcano plots were used to depict the differentially expressed genes (DEGs) using the ggplot2 package in R.
Expression of Key Genes
After identifying the DEGs from a comparison of the high-dose group and the DKD model group, the data in all five groups were summarized, and genes were screened using R with the following criteria: (i) the expression levels in all four groups were increased or decreased; (ii) the expression levels of the normal control group were greater than or less than those of the DKD model group, and were similar to those in the high-dose group. These genes were considered potentially related to the therapeutic effects of the TCM mixture. The changes in expression of genes in all five groups were displayed using the stack line graph drawing tool from the Weishengxin website (http://www.bioinformatics.com.cn/).
Functional Enrichment Analysis and Protein–Protein Interaction (PPI) Network Analysis
Gene Ontology (GO) annotation and Kyoto Encyclopedia of Genes and Genomes (KEGG) pathway enrichment analysis were used to determine the DEGs that were filtered out in the previous step. Analysis of the biological processes (BPs), cell components (CCs), and molecular functions (MFs) were included in the GO annotation. These genetic data were analyzed via the online KEGG database. GO functional annotation analysis and KEGG pathway enrichment analysis were performed using the Weishengxin website. The significant enrichment threshold was set as p < 0.05, and the ten items with the lowest p-values were selected. The PPI network was analyzed using the STRING database for genes. The minimum required interaction score was 0.400, which was regarded as a medium level of confidence.
qRT-PCR
Total RNA was extracted from fresh mouse kidneys of each group using the TRIzol method, with samples having no DNAse/RNAse activity. Then, a 1 µg sample of RNA was reverse-transcribed into cDNA using the GoScript Reverse Transcription System, according to the manufacturer’s protocol (Promega). The qRT-PCR was performed on an ABI7500 system using the GoTaqR qPCR Master Mix (Promega). All data were normalized to the expression of β-actin, and relative RNA expression was calculated using the 2−δδCT method. All primer sequences are in Supplementary Table 1.
Histopathological Evaluation
After 24 weeks, renal tissues were harvested and fixed in 4% phosphate-buffered paraformaldehyde for 48 h at 4 °C. After embedding in paraffin, 3-μm sections were prepared, deparaffinized in xylene, and rehydrated in a series of graded ethanol solutions. Then, the samples were stained with hematoxylin and eosin (H&E), periodic acid-Schiff (PAS), or Masson’s trichrome for histopathological examination.
Statistical Analyses
All values are expressed as the means ± standard errors of the mean. Statistical analysis was performed using the SPSS for Windows version 7.51 (SPSS, Inc., Chicago, IL, USA). The results of different groups were compared using analysis of variance (ANOVA), and a p-value below 0.05 indicated a statistically significant difference.
Results
Time Course of Changes in Body Weight, Serum Indexes, and UAER
We monitored the changes in body weight and blood glucose in the five groups over the course of 24 weeks. Mice in the normal (db/m) group had relatively normal intake of water and food and defecation during the 2-week acclimation period. In contrast, mice in the DKD model group had gradual increases in the overall intake of water and food, and clear signs of polyuria during this 2-week period. At the beginning of TCM administration, one mouse in the low-dose group died. As the experiment progressed, the mice in all three TCM groups had decreased intake of water and food, and decreased symptoms of polyuria. However, there were no significant differences in these parameters among the three treatment groups.
Before the onset of treatment, mice in the DKD model group and the TCM treatment groups had considerably greater body weight than mice in the normal control group (Figure 2A). After the administration of different doses of the TCM for 24 weeks, the body weight of the DKD model group was significantly greater than that of the normal control group. However, there were no significant differences in body weight among the three treatment groups.
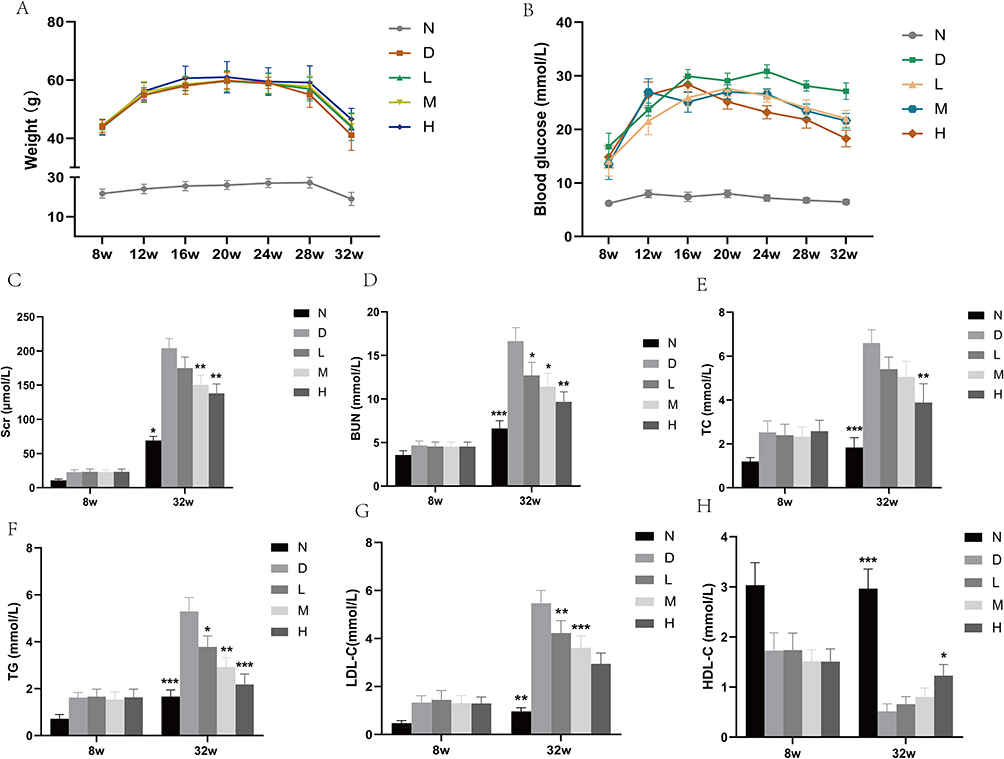 |
Figure 2 Changes of different indices in the five groups of mice from study onset (week-8) to study completion (week-32). Body weight (A) and blood glucose levels (B) were measured every four weeks. Serum creatinine (C) blood urea nitrogen (D), total cholesterol (E), triglycerides (F), low-density lipoprotein (G), and high-density lipoprotein (H) were measured at study onset (week-8) and study completion (week-32). *p < 0.05, **p < 0.01, ***p < 0.001. |
Before the onset of treatment, the DKD model group and the three TCM groups had significantly greater levels of blood glucose than the normal control group (Figure 2B). After 16 weeks of treatment, the blood glucose level of the DKD model group was significantly greater than that of the normal control group. Compared with the DKD model group, the blood glucose levels in the TCM groups were lower, especially in the high-dose group. Thus, the hypoglycemic effect of the TCM mixture was dose-dependent.
Before the onset of treatment, compared with the normal control group, the DKD model group and the TCM groups had significantly greater levels of SCr, TC, TG, and LDL-C, and a significantly decreased level of HDL-C (Table 1). After 24 weeks, compared with the normal group, the DKD model group had significantly increased levels of SCr, BUN, TC, TG, and LDL-C, and a significantly decreased level of HDL-C (Figure 2C–H). Compared with the DKD model group, the levels of SCr, BUN, TC, TG, LDL-C, and HDL-C were normalized in the TCM groups, and these changes were significant in the high-dose and medium-dose groups (all p < 0.05). There were no significant differences among the groups with different doses of the TCM.
 |
Table 1 Serum Biochemical Indexes of Each Group Immediately Before Study Onset ( |

Before the onset of treatment, the UAER in the DKD model group and the TCM groups were significantly greater than in the normal control group (Table 2), suggesting the presence of kidney damage in these 8-week-old db/db mice. After 24 weeks of treatment, the UAER in the DKD model group was significantly greater than that in the normal control group. Compared with the DKD model group, the UAER in was significantly decreased in the high-dose and medium-dose TCM groups, but there were no significant differences among the three TCM groups.
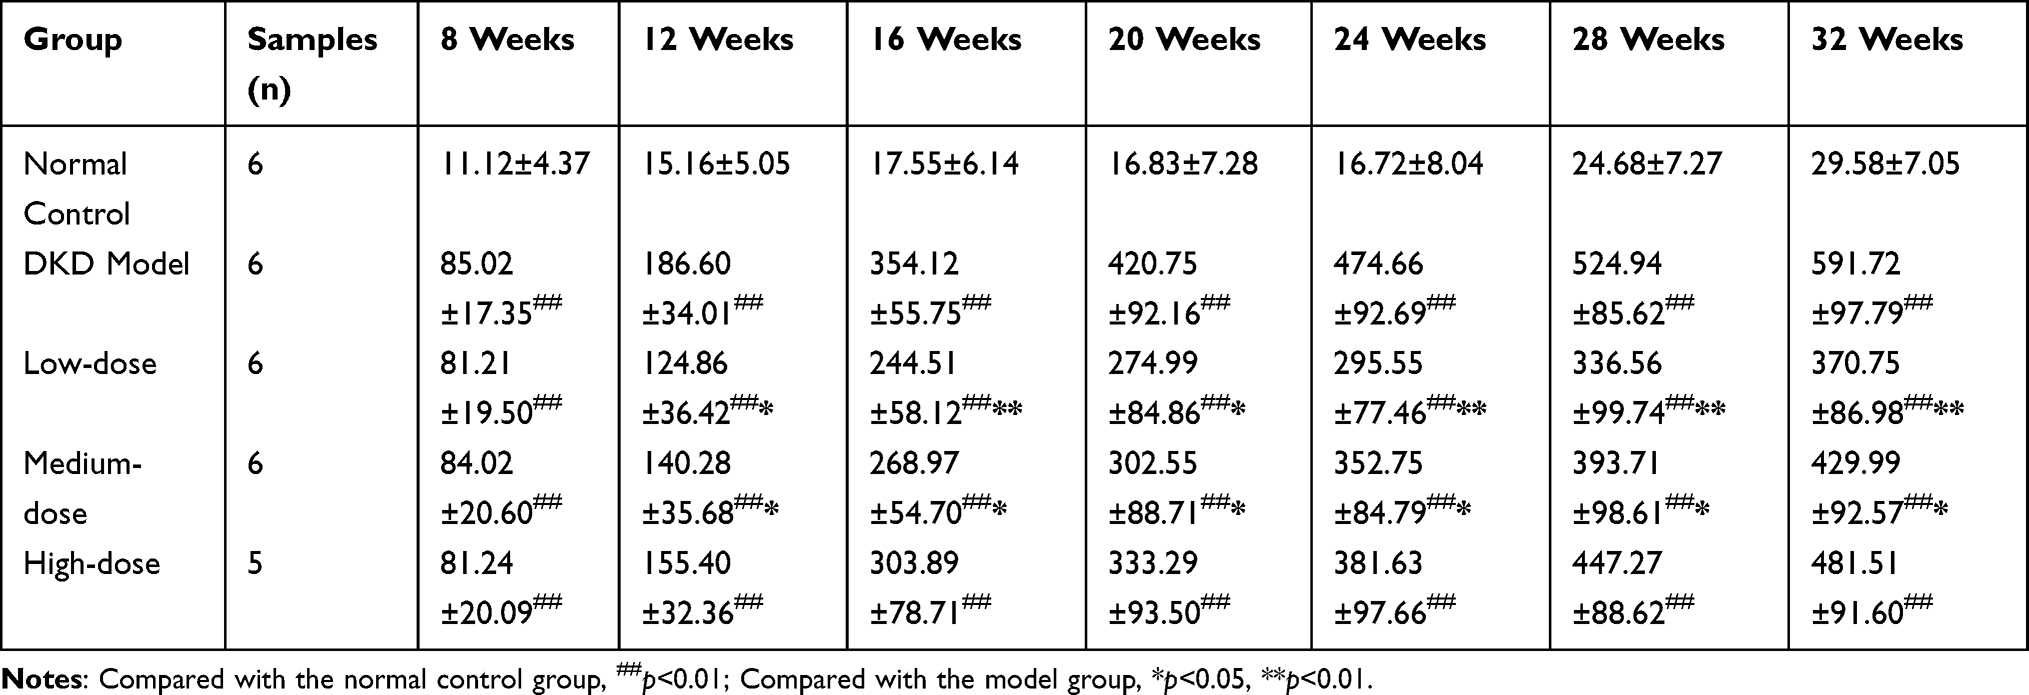 |
Table 2 Changes in Urinary Albumin Excretion Rate in Each Group from Study Onset to Completion ( |

Renal Histopathological Changes
After 24 weeks, we performed renal histological analysis using three different stains (Figure 3). Compared with mice in the normal control group, mice in the DKD group mice had moderate-to-severe diffuse proliferation of mesangial cells and matrix. The DKD mice had some restricted capillary lumens, some capillary loops were angiomatous and dilated, and a few mesangial areas were nodular. Compared with the normal control group, the DKD group had hyperplasia of mesangial cell and matrix, glomerulosclerosis, and increased glomerular collagen. The mice in all three TCM groups had decreased mesangial matrix hyperplasia and collagen deposition, and this effect was greatest in the high-dose group.
 |
Figure 3 Hematoxylin and eosin (HE), Masson trichome, and periodic acid-Schiff (PAS) staining of kidney tissues from the five groups at study completion (week-32).N :normal control; L: Low-dose TCM; M: Medium-dose TCM; H: High-dose TCM; D: DKD. Scale bars show magnification. |
Transcriptome Analysis and Screening for Differentially Expressed Genes
After 24 weeks, we used transcriptome analysis of isolated renal tissues to screen for DEGs. Comparison of the DKD model and normal control groups indicated 450 DEGs, with 213 upregulated genes and 237 downregulated genes (Figure 4A). Relative to the DKD model group, the high-dose TCM group had 158 DEGs, with 73 upregulated genes and 85 downregulated genes (Figure 4B); the medium-dose TCM group had 142 DEGs, with 92 upregulated genes and 50 downregulated genes (Figure 4C); and the low-dose TCM group had 33 DEGs, with 15 upregulated genes and 18 downregulated genes (Figure 4D). Compared with the high-dose TCM group, the medium-dose TCM group had 163 DEGs, with 112 upregulated genes and 51 downregulated genes (Figure 4E), and the low-dose TCM group had 128 DEGs, with 60 upregulated genes and 68 downregulated genes (Figure 4F).
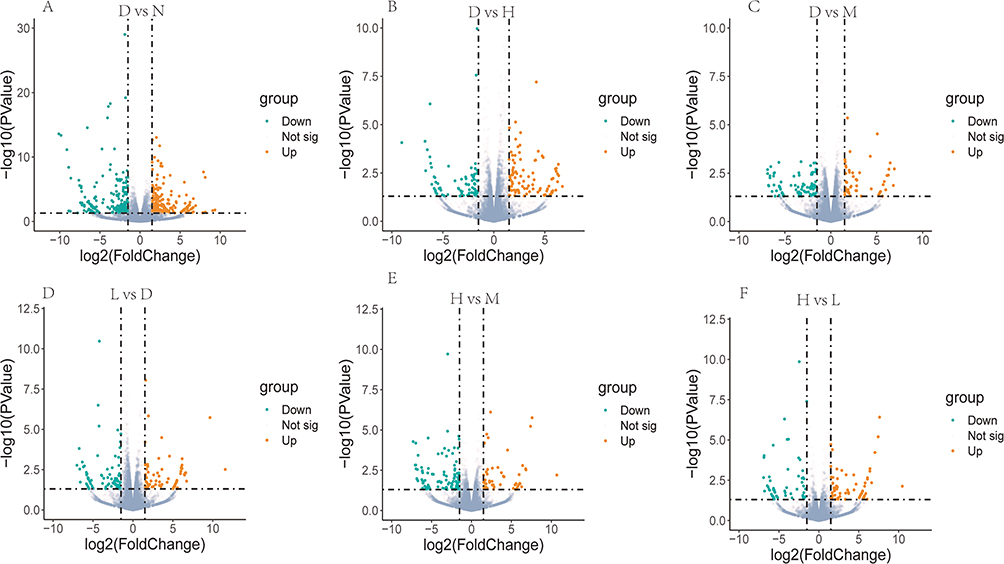 |
Figure 4 Volcano plots of genes with significantly different expression in six different pairwise comparisons. Significantly down-regulated and upregulated genes were defined by |log2(FC)| > 1.5 and p < 0.05. Orange dots: upregulated genes in the first group relative to the second group; green dots: downregulated genes in the first group relative to the second group. (A) DKD vs Normal, (B) DKD vs High-dose TCM, (C) DKD vs Medium-dose TCM, (D) Low-dose TCM vs DKD, (E) High-dose TCM vs Medium-dose TCM, (F) High-dose TCM vs Low-dose TCM. |
We performed analysis of the 158 DEGs (73 upregulated genes and 85 downregulated genes) by further examining the high-dose TCM group and the DKD model group from data collected at week 24. Based on our screening criteria (see Material and Methods), we identified 42 genes that had potential roles in the pathogenesis of DKD, and then utilized stack diagrams to visualize these changes. Following TCM treatment, the expression of some genes increased significantly, so their expression patterns were more similar to the normal controls, especially in the high-dose TCM group (Figure 5A–C). In addition, TCM treatment significantly decreased the expression of other genes, so their expression patterns were more similar to the normal controls, especially in the high-dose group (Figure 5D–F).
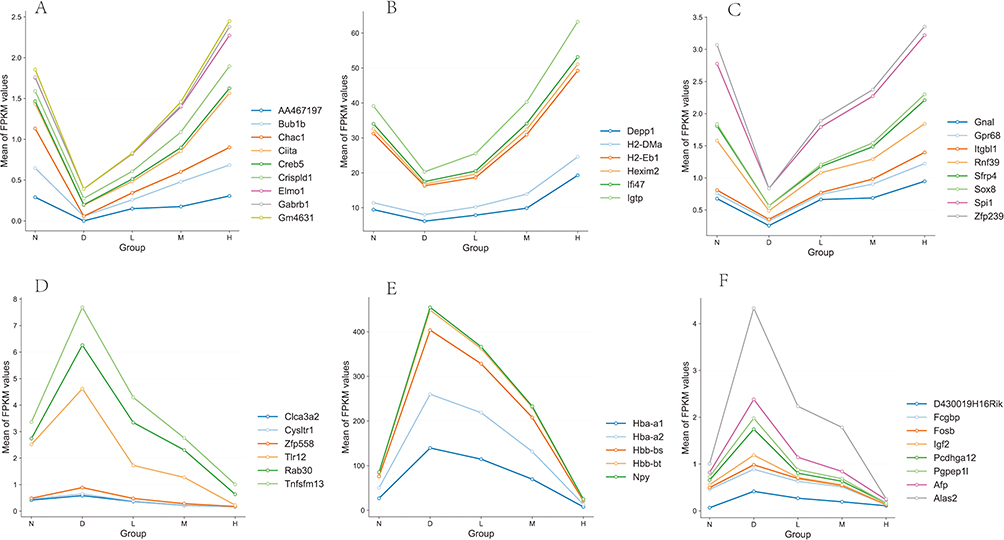 |
Figure 5 Stacking plots of the 42 genes that had significantly different expression in the DKD model group, the normal group, and the TCM treatment groups. (A–C) TCM treatment significantly increased the expression of 23 genes so their expression patterns became more similar to the normal control group (N), especially in the high-dose TCM group (H). (D–F) TCM treatment significantly decreased the expression of 19 other genes so their expression patterns became more similar to the normal control group (N), especially in the high-dose TCM group (H). |
Bioinformatics Analysis of Key Genes
We then used GO and KEGG pathway enrichment analyses to determine the functions and enrichment pathways of these 42 key genes. GO analysis showed that the BPs were mainly enriched in myeloid cell development, erythrocyte development, erythrocyte differentiation, erythrocyte homeostasis, myeloid cell homeostasis, antigen processing, presentation of exogenous peptide antigen via major histocompatibility complex (MHC) class II, regulation of MHC class II biosynthetic process, MHC class II biosynthetic process, antigen processing, presentation of peptide antigen via MHC class II, and antigen processing and presentation of peptide or polysaccharide antigen via MHC class II (Figure 6A). Analysis of CCs showed enrichment in hemoglobin complex, haptoglobin-hemoglobin complex, MHC protein complex, cytosolic small ribosomal subunit, small ribosomal subunit, cytosolic ribosome, mitochondrial respiratory chain complex IV, lysosomal membrane, lytic vacuole membrane, and guanyl-nucleotide exchange factor complex (Figure 6B). The top 10 of MFs were haptoglobin binding, oxygen binding, peroxidase activity, oxidoreductase activity, acting on peroxide as acceptor, antioxidant activity, hemoglobin binding, oxygen carrier activity, organic acid binding, GTPase activity, and heme binding (Figure 6C).
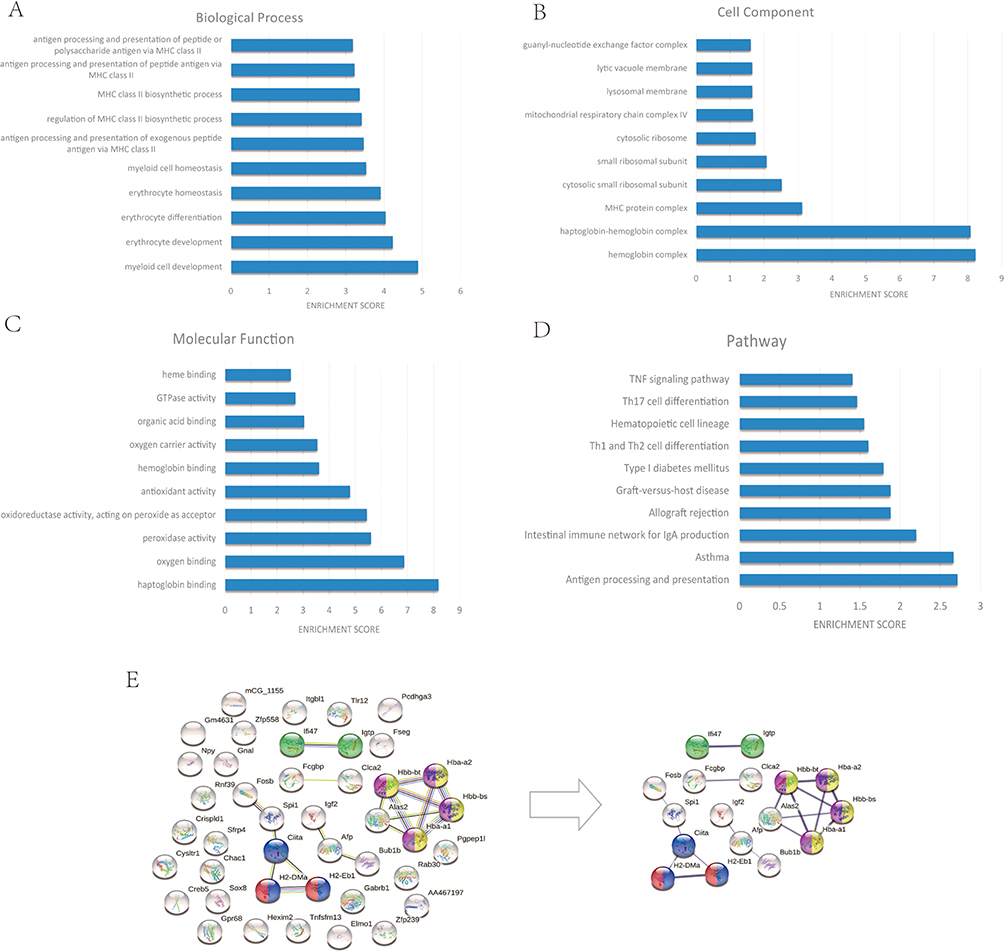 |
Figure 6 GO and KEGG pathway enrichment analysis and PPI analysis of the 42 differentially expressed genes. Categories and two most enriched terms: Biological processes (A, myeloid cell development and erythrocyte development), cellular components (B, hemoglobin complex, haptoglobin-hemoglobin complex) molecular function (C, haptoglobin binding, oxygen binding), and pathway enrichment (D, antigen processing and presentation, asthma). In the PPI analysis (E), yellow and purple represent globin, green represents immunity-related GTPase-like, blue represents antigen processing and presentation, and red represents major histocompatibility complex class II. |
KEGG pathway enrichment analysis showed that several genes were enriched in antigen processing and presentation, asthma, intestinal immune network for IgA production, allograft rejection, graft-versus-host disease, type I diabetes mellitus, Th1 and Th2 cell differentiation, hematopoietic cell lineage, Th17 cell differentiation, and tumor necrosis factor (TNF) signaling pathway (Figure 6D). Table 3 summarizes the differences in expression of these genes in the high-dose TCM group and the DKD model group.
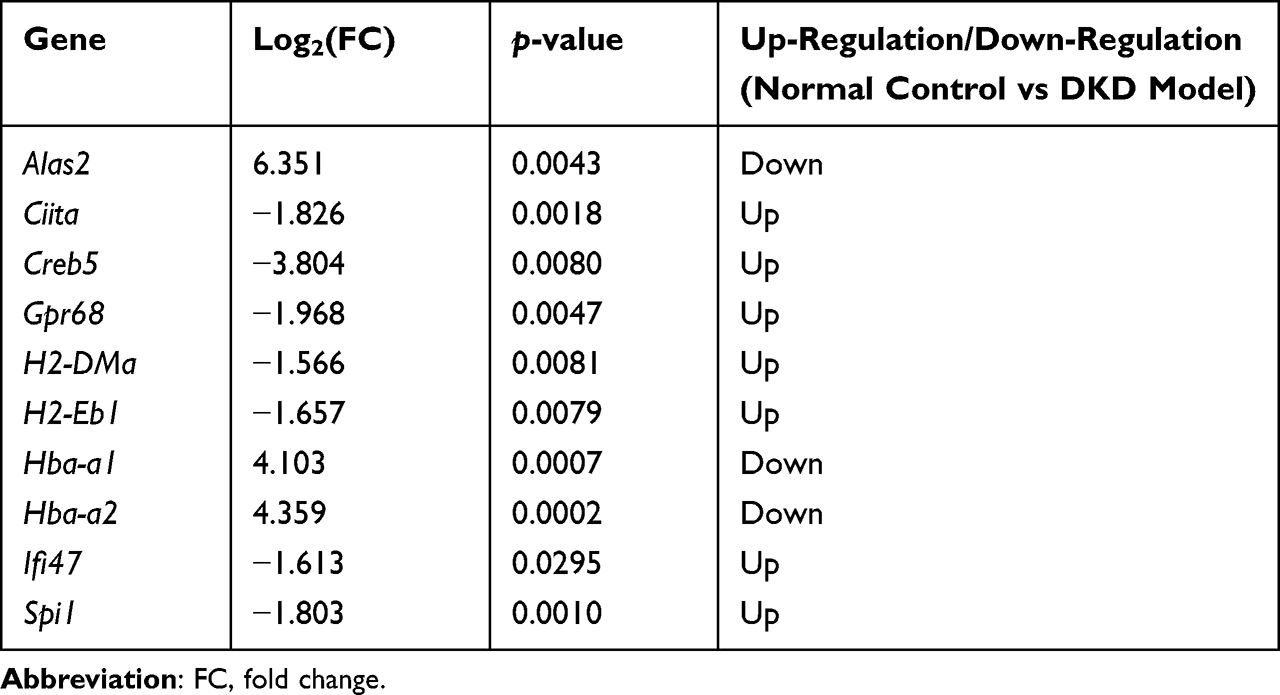 |
Table 3 Differential Expression of Screened Genes |
We then screened out the three genes that had the largest |log2(FC)| values using qRT-PCR: 5′-aminolevulinate synthase 2 (Alas2), cAMP responsive element binding protein 5 (Creb5), and hemoglobin alpha, adult chain 1/2 (Hba-a1/2). Then, we used qRT-PCR to directly measure the mRNA levels of these three genes in the kidney tissues of the DKD model group and high-dose TCM group at week-24. Consistent with the sequencing results, compared with the DKD model group, the high-dose TCM group had a significantly decreased level of Alas2 and a significantly increased level of Creb5 (both p < 0.05). However, contrary to the sequencing results, the Hba-a1/2 level was upregulated in the high-dose TCM group (Figure 7).
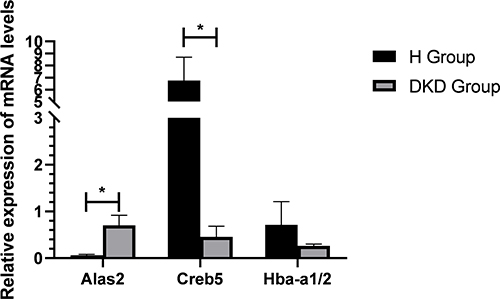 |
Figure 7 Expression of three genes in the DKD model group and the high-dose TCM group based on qRT-PCR. *p < 0.05. |
We then used the STRING database for PPI analysis. The 42 genes were similar to those of functional annotation by GO and KEGG pathway enrichment analyses (Figure 6E). These genes were mostly related to the immune system and the physiology and function of erythrocytes.
Discussion
DM is a metabolic disease whose incidence is increasing worldwide, and many of these patients have concurrent kidney complications that progress to ESRD within a few years. Kidney failure is a significant threat to a patient’s life and health, and many patients do not receive adequate treatment by hemodialysis due to financial and other reasons. There is increasing interest in the use of different TCMs for the treatment of a variety of ailments. However, it is necessary to thoroughly examine the molecular targets of these different treatments.9 Several TCMs have possible therapeutic effects against DKD (Supplementary Table 2). Our study used transcriptome analysis with several bioinformatic tools to elucidate the possible mechanism by which a specific TCM formulation consisting of Astragalus, rhubarb, and saffron prevents the progression of DM to DKD. These data and our functional annotation analysis support the future use and research of this mixture.
Our results show that compared with the DKD model group, the levels of SCr, BUN, TC, TG, and LDL-C were lower and the level of HDL-C was higher following the 24-week TCM treatment, especially in the high-dose group. This result confirmed that the three ingredients in this TCM were an effective treatment for DKD and that they improved renal function. Additionally, compared with the DKD model group, we found that the expression of 42 genes were significantly upregulated after treatment with our TCM mixture. This led us to speculate that the change in the expression of these genes might be responsible for the observed therapeutic effect of this TCM. Nevertheless, future research is required to confirm the role of these genes in the pathogenesis of DKD.
At the same time, we also identified some of the functions and pathways of these pivotal genes. Our research showed that changes in several functions may be responsible for the observed therapeutic effects of our TCM: class II major histocompatibility complex transactivator (Ciita); histocompatibility 2, class II, locus DMa (H2-DMa); and histocompatibility 2, class II antigen E beta (H2-Eb1). H2-DMa functions in antigen processing and presentation, and H2-Eb1 functions in Th1 and Th2 cell differentiation, and these potentially contributed to the beneficial effects of our TCM. Moreover, Creb5 and interferon gamma-inducible protein 47 (Ifi47) have important functions in the TNF signaling pathway. In addition, G protein-coupled receptor 68 (Gpr68), Alas2, Hba-a1, Hba-a2, and Spi-1 proto-oncogene (Spi1) were enriched in myeloid cell development and erythrocyte development related to the hemoglobin complex, haptoglobin binding, and oxygen binding. Taken together, these findings indicate the potential mechanism of the TCM therapy examined here, although this requires verification in future studies.
Numerous studies have shown that persistent renal hypoxia increased the activity of hypoxia-inducible factor 1 and inflammation, and also led to an imbalance of vasoactive factors, an acceleration of the epithelial-to-mesenchymal transition, and increased fibrosis.10 Other studies have suggested that chronic hypoxia may be the main pathophysiological process responsible for DKD11 and CKD.12 Although renal blood flow accounts for about 20% of cardiac output, the kidney has a lower oxygen partial pressure than other organs, and they are therefore susceptible to renal tubular interstitial injury due to hypoxia. Some data suggests that increasing the hemoglobin level may improve the renal prognosis of patients with kidney disease.13 Furthermore, erythrocyte function determines whether hemoglobin can function as an effective carrier of oxygen. Anemia is a frequent complication in patients with late-stage of CKD because of their lack of erythropoietin,14 and hemoglobin transfusion is therefore used as a treatment for this condition. Because hypoxia leads to epigenetic alterations, we examined the state of the disease and the effect of treatment at the level of the transcriptome.
Although DKD was not originally considered to be an immune-mediated disease, recent studies suggest that immune components play a significant role in the pathogenesis and progression of DKD. For example, increased levels of macrophages were reported in multiple renal biopsies of DKD patients and experimental animal models; these cells trigger a series of downstream inflammation pathways, and the accumulation of macrophages in the kidneys of diabetic patients predicts a poor renal function.15 In addition, TNF, which is mainly secreted by activated macrophages, is a major cytokine of systemic inflammation and is linked to the expression of genes that stimulate inflammation and cell death.16 Our previous research showed that the Astragalus–saffron–rhubarb TCM mixture reduced the levels of IL-6, TNF-α, TNF-1R, and TNF-2R in the renal tissue of db/db mice with DKD. As a result, this combination of herbs may enhance kidney function in and renal hypoxia by modulating the immune system and the physiological activities of red blood cells in DKD.
We identified multiple genes and pathways that were related to the pathogenesis of DKD and the therapeutic effects of our TCM. Ciita is the most important MHC-II regulator in macrophages,17 and there is evidence that an imbalance of M1/M2 polarized macrophage phenotype activation is a key event in the pathogenesis of DKD.18 In particular, M1 macrophages have high antigen presentation and can produce high levels of proinflammatory cytokines, whereas M2 macrophages have a renal protective role in DKD. Increasing the M2-to-M1 ratio by inhibiting the RAAS is also an established treatment for DKD.19 Furthermore, we also identified key roles of Creb5, Grp68, Alas2, and Spil; these genes are responsible for several immune-related processes, including tumor mortality, tumor recurrence, fibrosis, muscle atrophy, and hematopoiesis.20–23 According to the National Center of Biotechnology Information gene database, Hba-a1 and Hba-a2 function in erythrocyte development, and H2-DMa and H2-Eb1 affect the binding activity of MHC class II protein complexes. These genes potentially play an important role in the therapeutic effects of our TCM. It is worth noting that the TCM dose affected the levels of Alas2 and Creb5 mRNAs in our study, and that our qRT-PCR results were consistent with the tissue sequencing results (Figure 4). This evidence of a dose-dependent effect supports our speculation that the TCM examined here alleviated DKD by altering the expression of these two genes. However, the exact roles of Alas2 and Creb5 in the pathogenesis of DKD are still unclear, and further studies of the specific mechanism are necessary.
There are some limitations of this study that must be addressed. First, the sample size used for sequencing needs to be increased. Although sequencing of samples from three animals allowed exploration of the underlying mechanisms, use of larger samples are needed to confirm our results. We are currently using larger sample sizes in our ongoing studies of this topic. Additionally, although we identified the potential therapeutic effects and underlying mechanisms of our TCM mixture on DKD were related to improving immunity and hypoxia, our conclusions require further experimental verification at the gene and protein levels.
Conclusion
We explored the therapeutic effect of a TCM mixture consisting of Astragalus, rhubarb, and saffron on DKD in a mouse model of this disease, and used transcriptome sequencing to determine the possible underlying mechanism of this therapeutic effect. Our results suggest that several key genes related to immunity and oxygen delivery of hemoglobin may be responsible for the therapeutic effect of this TCM, and provide novel insights regarding the pathogenesis and treatment of DKD.
Abbreviations
Alas2, 5′-aminolevulinate synthase 2; BPs, biological processes; BUN, blood urea nitrogen; CCs, cell components; Ciita, class II major histocompatibility complex transactivator; CKD, chronic kidney disease; Creb5, cAMP responsive element binding protein 5; DEGs, differentially expressed genes; DKD, diabetic kidney disease; DM, diabetes mellitus; ESRD, end-stage renal disease; GO, Gene Ontology; Gpr68, G protein-coupled receptor 68; H2-DMa, histocompatibility 2, class II, locus DMa; H2-Eb1, histocompatibility 2, class II antigen E beta; Hba-a1, hemoglobin alpha, adult chain 1; Hba-a2, hemoglobin alpha, adult chain 2; Ifi47, interferon gamma-inducible protein 47; KEGG, Kyoto Encyclopedia of Genes and Genomes; MFs, molecular functions; MHC, major histocompatibility complex; PPI, protein-protein interaction; qRT-PCR, quantitative real-time polymerase chain reaction; SCr, serum creatinine; Spi1, Spi-1 proto-oncogene; TCM, traditional Chinese medicine; TNF, tumor necrosis factor; UAER, urinary albumin excretion rate.
Data Sharing Statement
All data generated or analyzed during this study are included in this article. Further enquiries can be directed to the corresponding author.
Ethics Approval and Informed Consent
This study passed the review of the Ethics Committee of the Lanzhou University Second Hospital (Number: D2019-198). All experiments involving animals were performed after Lanzhou University Second Hospital Institutional Ethical Committee’s approval, and under the strict adherence to the National Institutes of Health Guidelines for the Care and Use of Laboratory Animals.
Author Contributions
All authors made significant contributions to the work reported, whether that is in the conception, study design, execution, acquisition of data, analysis and interpretation, or in all these areas; took part in drafting, revising or critically reviewing the article; gave final approval of the version to be published; agreed on the journal to which the article has been submitted; and agreed to be accountable for all aspects of the work.
Funding
This work was supported in part by the National Natural Science Foundation of China (No. 81960142), the Talent Innovation and Entrepreneurship Project of Lanzhou City, Gansu Province (No. 2021-RC-94), the Lanzhou City Chengguan District Science and Technology Bureau (No. 2021RCCX0027), the Cuiying Scientific and Technological Innovation Program of Lanzhou University Second Hospital (No. CY2017-QN19 and CY2021-QNB01), Scientific Research Projects of Colleges in Gansu Province (No. 2021B-041) and Gansu Provincial Department of Education project (2022B-050), the Technology Fund Program of Gansu Province (No. 21JR1RA157 and 23JRRA0991), and the Clinical Medical Research Center of Gansu Province (No. 21JR7RA436).
Disclosure
The authors declare that they have no competing interests in this work.
References
1. Yu SM, Bonventre JV. Acute kidney injury and progression of diabetic kidney disease. Adv Chronic Kidney Dis. 2018;25(2):166–180. doi:10.1053/j.ackd.2017.12.005
2. Samsu N, Bellini MI. Diabetic nephropathy: challenges in pathogenesis, diagnosis, and treatment. Biomed Res Int. 2021;2021:1497449. doi:10.1155/2021/1497449
3. Zhang HW, Lin ZX, Tung YS, et al. Cordyceps sinensis (a traditional Chinese medicine) for treating chronic kidney disease. Cochrane Database Syst Rev. 2014;12:Cd008353.
4. Zhong Y, Deng Y, Chen Y, Chuang PY, Cijiang He J. Therapeutic use of traditional Chinese herbal medications for chronic kidney diseases. Kidney Int. 2013;84(6):1108–1118. doi:10.1038/ki.2013.276
5. Nie Q, Chen H, Hu J, Fan S, Nie S. Dietary compounds and traditional Chinese medicine ameliorate type 2 diabetes by modulating gut microbiota. Crit Rev Food Sci Nutr. 2019;59(6):848–863. doi:10.1080/10408398.2018.1536646
6. Zhong Y, Lee K, Deng Y, et al. Arctigenin attenuates diabetic kidney disease through the activation of PP2A in podocytes. Nat Commun. 2019;10(1):4523. doi:10.1038/s41467-019-12433-w
7. Abou-Hany HO, Atef H, Said E, Elkashef HA, Salem HA. Crocin mediated amelioration of oxidative burden and inflammatory cascade suppresses diabetic nephropathy progression in diabetic rats. Chem Biol Interact. 2018;284:90–100. doi:10.1016/j.cbi.2018.02.001
8. Zhou XC, Liang YJ, Qin L, Wei GH, Wang JQ. Astragalus-saffron-rhubarb mixture delays the progress of diabetic nephropathy in db/db mice. Diabetes Metab Syndr Obes. 2021;14:4679–4690. doi:10.2147/DMSO.S334662
9. Lu F, Wang D, Li RL, He LY, Ai L, Wu CJ. Current strategies and technologies for finding drug targets of active components from traditional Chinese medicine. Front Biosci. 2021;26(9):572–589.
10. Xie T, Chen C, Peng Z, et al. Erythrocyte metabolic reprogramming by sphingosine 1-phosphate in chronic kidney disease and therapies. Circ Res. 2020;127(3):360–375. doi:10.1161/CIRCRESAHA.119.316298
11. Hesp AC, Schaub JA, Prasad PV, et al. The role of renal hypoxia in the pathogenesis of diabetic kidney disease: a promising target for newer renoprotective agents including SGLT2 inhibitors? Kidney Int. 2020;98(3):579–589. doi:10.1016/j.kint.2020.02.041
12. Fu Q, Colgan SP, Shelley CS. Hypoxia: the force that drives chronic kidney disease. Clin Med Res. 2016;14(1):15–39. doi:10.3121/cmr.2015.1282
13. Hirakawa Y, Tanaka T, Nangaku M. Mechanisms of metabolic memory and renal hypoxia as a therapeutic target in diabetic kidney disease. J Diabetes Investig. 2017;8(3):261–271. doi:10.1111/jdi.12624
14. Fishbane S, Spinowitz B. Update on Anemia in ESRD and Earlier Stages of CKD: core Curriculum 2018. Am J Kidney Dis. 2018;71(3):423–435. doi:10.1053/j.ajkd.2017.09.026
15. Hickey FB, Martin F. Role of the immune system in diabetic kidney disease. Curr Diab Rep. 2018;18(4):20. doi:10.1007/s11892-018-0984-6
16. Menon MB, Gaestel M. MK2-TNF-signaling comes full circle. Trends Biochem Sci. 2018;43(3):170–179. doi:10.1016/j.tibs.2017.12.002
17. León Machado JA, Steimle V. The MHC class II transactivator CIITA: not (Quite) the odd-one-out anymore among NLR proteins. Int J Mol Sci. 2021;22(3):1074. doi:10.3390/ijms22031074
18. Zhang X, Zhao Y, Zhu X, et al. Active vitamin D regulates macrophage M1/M2 phenotypes via the STAT-1-TREM-1 pathway in diabetic nephropathy. J Cell Physiol. 2019;234(5):6917–6926. doi:10.1002/jcp.27450
19. Moratal C, Laurain A, Naïmi M, et al. Regulation of monocytes/macrophages by the renin-angiotensin system in diabetic nephropathy: state of the art and results of a pilot study. Int J Mol Sci. 2021;22(11):6009. doi:10.3390/ijms22116009
20. Deng B, Molina J, Aubry MC, et al. Clinical biomarkers of pulmonary carcinoid tumors in never smokers via profiling miRNA and target mRNA. Cell Biosci. 2014;4(1):35. doi:10.1186/2045-3701-4-35
21. Yoshida Y, Matsunaga N, Nakao T, et al. Alteration of circadian machinery in monocytes underlies chronic kidney disease-associated cardiac inflammation and fibrosis. Nat Commun. 2021;12(1):2783. doi:10.1038/s41467-021-23050-x
22. Peng Y, Li J, Luo D, et al. Muscle atrophy induced by overexpression of ALAS2 is related to muscle mitochondrial dysfunction. Skelet Muscle. 2021;11(1):9. doi:10.1186/s13395-021-00263-8
23. Wahlster L, Sankaran VG. I SPI1 something needed for B cells. J Exp Med. 2021;218(7). doi:10.1084/jem.20210572
 © 2024 The Author(s). This work is published and licensed by Dove Medical Press Limited. The full terms of this license are available at https://www.dovepress.com/terms.php and incorporate the Creative Commons Attribution - Non Commercial (unported, v3.0) License.
By accessing the work you hereby accept the Terms. Non-commercial uses of the work are permitted without any further permission from Dove Medical Press Limited, provided the work is properly attributed. For permission for commercial use of this work, please see paragraphs 4.2 and 5 of our Terms.
© 2024 The Author(s). This work is published and licensed by Dove Medical Press Limited. The full terms of this license are available at https://www.dovepress.com/terms.php and incorporate the Creative Commons Attribution - Non Commercial (unported, v3.0) License.
By accessing the work you hereby accept the Terms. Non-commercial uses of the work are permitted without any further permission from Dove Medical Press Limited, provided the work is properly attributed. For permission for commercial use of this work, please see paragraphs 4.2 and 5 of our Terms.