")
Back to Journals » Journal of Inflammation Research » Volume 17
Systemic Inflammatory Response Index, a Potential Inflammatory Biomarker in Disease Severity of Myasthenia Gravis: A Pilot Retrospective Study
Authors Huang S, Wang Y, Zhu J, Li S, Lin S, Xie W, Chen S, Wang Y, Wang L, Jin Q, Weng Y, Yang D
Received 10 November 2023
Accepted for publication 26 March 2024
Published 25 April 2024 Volume 2024:17 Pages 2563—2574
DOI https://doi.org/10.2147/JIR.S449324
Checked for plagiarism Yes
Review by Single anonymous peer review
Peer reviewer comments 3
Editor who approved publication: Professor Ning Quan
Suwen Huang,1,* Yanchu Wang,1,2,* Jinrong Zhu,1,3,* Shengqi Li,1,2 Shenyi Lin,1,2 Wei Xie,1,2 Siyao Chen,1,2 Yukai Wang,1,3 Lingsheng Wang,1,2 Qiaoqiao Jin,1,2 Yiyun Weng,1 Dehao Yang4
1Department of Neurology, The First Affiliated Hospital of Wenzhou Medical University, Wenzhou, Zhejiang, People’s Republic of China; 2The First School of Medicine, School of Information and Engineering, Wenzhou Medical University, Wenzhou, People’s Republic of China; 3The Second School of Medicine, Wenzhou Medical University, Wenzhou, People’s Republic of China; 4Department of Neurology, The Second Affiliated Hospital, Zhejiang University School of Medicine, Hangzhou, People’s Republic of China
*These authors contributed equally to this work
Correspondence: Yiyun Weng, Department of Neurology, The First Affiliated Hospital of Wenzhou Medical University, Nanbaixiang Street, Ouhai District, Wenzhou, Zhejiang, 325000, People’s Republic of China, Tel +86-0577-55579371, Fax +86-0577-55579318, Email [email protected] Dehao Yang, Department of Neurology, The Second Affiliated Hospital, Zhejiang University School of Medicine, Hangzhou, Zhejiang, 310009, People’s Republic of China, Email [email protected]
Purpose: Myasthenia gravis (MG) is a chronic autoimmune disease caused by neuromuscular junction (NMJ) dysfunction. Our current understanding of MG’s inflammatory component remains poor. The systemic inflammatory response index (SIRI) presents a promising yet unexplored biomarker for assessing MG severity. This study aimed to investigate the potential relationship between SIRI and MG disease severity.
Patients and Methods: We conducted a retrospective analysis of clinical data from 171 MG patients admitted between January 2016 and June 2021. Patients with incomplete data, other autoimmune diseases, or comorbidities were excluded. Disease severity was evaluated using the Myasthenia Gravis Foundation of America (MGFA) classification and Myasthenia Gravis Activities of Daily Living (MG-ADL) on admission. The association between SIRI and disease severity was assessed through logistic regression analysis, along with receiver operating characteristic (ROC) curve and decision curve analysis (DCA) comparisons with established inflammation indicators.
Results: After exclusion, 143 patients were analyzed in our study. SIRI levels significantly differed between patients with higher and lower disease severity (p < 0.001). Univariate logistic regression showed that SIRI had a significant effect on high disease severity (OR = 1.376, 95% CI 1.138– 1.664, p = 0.001). This association remained significant even after adjusting for age, sex, disease duration, history of MG medication and thymoma (OR = 1.308, 95% CI 1.072– 1.597, p = 0.008). Additionally, a positive correlation between SIRI and MG-ADL was observed (r = 0.232, p = 0.008). Significant interactions were observed between SIRI and immunosuppressor (p interaction = 0.001) and intravenous immunoglobulin (p interaction = 0.005). DCA demonstrated the superior net clinical benefit of SIRI compared to other markers when the threshold probability was around 0.2.
Conclusion: Our findings indicate a strong independent association between SIRI and disease severity in MG, suggesting SIRI’s potential as a valuable biomarker for MG with superior clinical benefit to currently utilized markers.
Keywords: inflammation, myasthenia gravis foundation of America, MGFA, blood cell count, correlation, systemic inflammatory response index
Introduction
Myasthenia gravis (MG) is a chronic autoimmune disease in which antibodies attack the postsynaptic membrane causing skeletal muscle weakness.1 Antibodies targeting the acetylcholine receptor (AChR), muscle-specific kinase (MuSK), lipoprotein-related protein 4 (LRP4), or agrin have been recognized as crucial contributors to MG pathogenesis.2 While the involvement of inflammatory processes in MG is well-established, therapeutic options specifically targeting key inflammatory molecules remain limited, with only a handful reaching clinical trials.3–5 This underlines the critical need for identifying novel biomarkers associated with the inflammatory response, which could potentially pave the way for more effective and targeted therapeutic strategies in MG.
The neutrophil-to-lymphocyte ratio (NLR) has emerged as a well-established indicator of inflammation in MG patients and researches have demonstrated its association with disease severity and activity in adults and disease severity in children.6–8 Further evidence suggests that several systemic inflammatory markers, including platelet-to-lymphocyte ratio (PLR), lymphocyte-to-monocyte ratio (LMR), and systemic immune-inflammation index (SII) are linked to respiratory failure and outcome in MG patients.9 Beyond these established markers, the systemic inflammatory response index (SIRI) has recently gained attention as a novel inflammatory biomarker. Notably, its elevation has been observed in various diseases, including malignancies, cardiovascular diseases, rheumatoid arthritis, and hypertension, and is associated with poorer clinical manifestations and outcomes,10–15 while its decrease was associated with better prognosis.16,17
While research on systemic inflammation markers like NLR and others has established their link to MG severity, the relationship between SIRI and MG remains unexplored. This paucity of research highlights the need for further investigations into SIRI’s potential as a biomarker and we aimed to carry out comparisons between SIRI and other inflammation indicators to investigate in which aspects that SIRI has its specific advantages.
The main purpose of this study was to explore the relationship between SIRI and the disease severity of MG as well as the impact of MG on patients’ daily living, and the secondary purpose was to carry out comparisons between SIRI and other inflammation indicators. This study lays the groundwork for further exploration of the inflammatory mechanisms underlying MG, paving the way for more informed and targeted therapeutic interventions.
Materials and Methods
Study Population
This retrospective study examined data from 171 inpatients diagnosed with MG at the First Affiliated Hospital of Wenzhou Medical University between January 2016 and June 2021. For those who had multiple hospitalizations within the recruitment period, only the first record was included. According to the Chinese MG Diagnostic and Treatment Guidelines 2020, the diagnostic criteria encompassed the following conditions: On the basis of the typical clinical features of MG (fluctuating myasthenia), a diagnosis can be made if any of the following three points are met, including pharmacological examination, electrophysiological characteristics, and serum antibody testing such as acetylcholine receptor (AChR) antibodies. Clinical diagnosis of MG was established in patients exhibiting typical clinical characteristics of MG along with pharmacological and/or neuroelectrophysiological features. The exclusion criteria were: (1) patients with incomplete data; (2) patients with other autoimmune diseases on the list recognized by the Global Autoimmune Institute (GAI). (3) patients with severe heart disease, hepatic insufficiency, renal insufficiency, and malignant neoplasms except thymoma.
Definition
Disease severity was assessed using the clinical classification of Myasthenia Gravis Foundation of America (MGFA).18 In this study, MGFA type I, type II and type III were categorized as mild to moderate in severity, type IV and type V were classified as severe. The impact of MG on daily activities was evaluated using the Myasthenia Gravis Activities of Daily Living (MG-ADL) scale. SIRI was a ratio calculated as (monocyte × neutrophil / lymphocyte) which represents the level of peripheral inflammation. NLR was defined as the number of neutrophils to lymphocyte ratio. PLR is the ratio of platelet count to lymphocyte count. LMR is calculated with absolute lymphocyte count to monocyte count, and SII was calculated with (platelet × neutrophil) / lymphocyte. Subgroup criteria for analysis encompassed individuals aged over 60, male participants, those with a history of prehospital infection occurring either upon admission or within 48 hours thereafter, individuals receiving prior treatment for MG, including cholinesterase inhibitors and/or immunosuppressants, smokers irrespective of current smoking status, patients with a history of hypertension upon admission, and those administered glucocorticoids, immunosuppressants, or intravenous immunoglobulin were administered upon admission.
Data Collection
Clinical data and patient demographics were retrospectively retrieved from the medical record system, encompassing age, sex, disease duration, time since last onset, smoking and drinking habits, medical history of hypertension and diabetes, current medication use, presence of thymoma and history of thymectomy. MGFA classification, level of anti-AChR antibody and ADL scores were collected upon admission, and the blood routine test results of the patients were collected on the first day of hospitalization.
Ethic Approvals
The study was approved by the Institutional Ethics Committee review board of the First Affiliated Hospital of Wenzhou Medical University (Ethics number: KY2023-R124) and was performed under the Declaration of Helsinki. All participants provided written informed consent for their participation in this study.
Statistical Analysis
Data were presented as mean ± standard deviation (SD) for normally distributed variables and median and interquartile ranges for skewed data. The confirmation of data normality provided by the Shapiro–Wilk test. Independent sample t tests analyzed normally distributed data comparing groups, while the Mann–Whitney U-test was used for skewed distributions. Chi-square tests compared categorical variables between groups. To assess the association between SIRI and severe disease state, adjusted logistic regression analysis was performed. Subgroup analysis further explored the relationship between SIRI and mild and moderate states. Spearman correlation analysis evaluated the correlation between SIRI and ADL score. The Youden index of the receiver operating characteristic (ROC) curve determined the optimal SIRI cut-off value for diagnosis. Additional metrics like area under the curve (AUC), sensitivity, specificity, positive predictive value (PPV) and negative predictive value (NPV) were calculated for each model to assess their diagnostic efficiency. Finally, decision curve analysis (DCA) evaluated the clinical utility of each model, determining whether its use for intervention decisions would benefit patients.19 In our study, DCA demonstrated the net benefit of each model at various threshold probabilities. All statistical analysis were performed using IBM SPSS statistics 25, MedCalc 20.022, and RStudio 2021.09.0. P < 0.05 was statistically significant.
Data Availability
The data that support the findings of this study are available from the corresponding author Yiyun Weng on reasonable request.
Results
Baseline Characteristic
Among 143 MG patients, the mean age was 53.23 years, and males comprised 42.66% of the population. Comparing patients with varying disease severity levels, those with worse severity exhibited significantly longer disease duration (p = 0.023), more recent onsets (p = 0.039) and higher ADL score (p < 0.001). Additionally, they showed a higher prevalence of prior MG medication use (p = 0.036) and prehospital infections (p < 0.001). Notably, no significant difference was observed in drug use (cholinesterase inhibitor, glucocorticoid, immunosuppressor, azathioprine, tacrolimus and intravenous immunoglobulin) between the two groups. Analysis of blood cell counts revealed significantly higher levels of neutrophils (p = 0.001), SIRI (p < 0.001), NLR (p < 0.001), PLR (p = 0.002), and SII (p < 0.001), along with lower levels of lymphocytes (p = 0.005) and LMR (p = 0.001) in patients with worse disease severity (Table 1).
 |
Table 1 Characteristics of Moderate and Severe MG Patients |
Employing a ROC curve-derived cutoff value of 2.753, we categorized the patients into two groups (SIRI ≤ 2.753, n = 123 and SIRI > 2.753, n = 20). Subsequent 1:3 propensity score matching based on age and sex yielded a balanced cohort of 57 patients (SIRI ≤ 2.753, n = 40, SIRI > 2.753, n = 17). Consistent with the MGFA ≤ III versus MGFA > III comparison, patients with higher SIRI exhibited longer disease duration (p = 0.005), increased prevalence of prior MG medication (p = 0.006), higher ADL scores (p < 0.001), and a greater frequency of prehospital infections (p = 0.001). Additionally, these individuals displayed elevated monocyte and neutrophil levels (p = 0.016, p < 0.001, respectively) and decreased lymphocyte levels (p < 0.001) (Table 2). Notably, compared to the MGFA ≤ III versus MGFA > III comparison, the higher SIRI group had a significantly higher proportion of patients with a history of thymectomy (p = 0.002). Moreover, a significant positive association was observed between the distribution of MGFA classification and SIRI (p < 0.001) (Table 2). Figure 1 depicts the detailed distribution of MGFA classifications within each SIRI group, presented as a stacked bar chart.
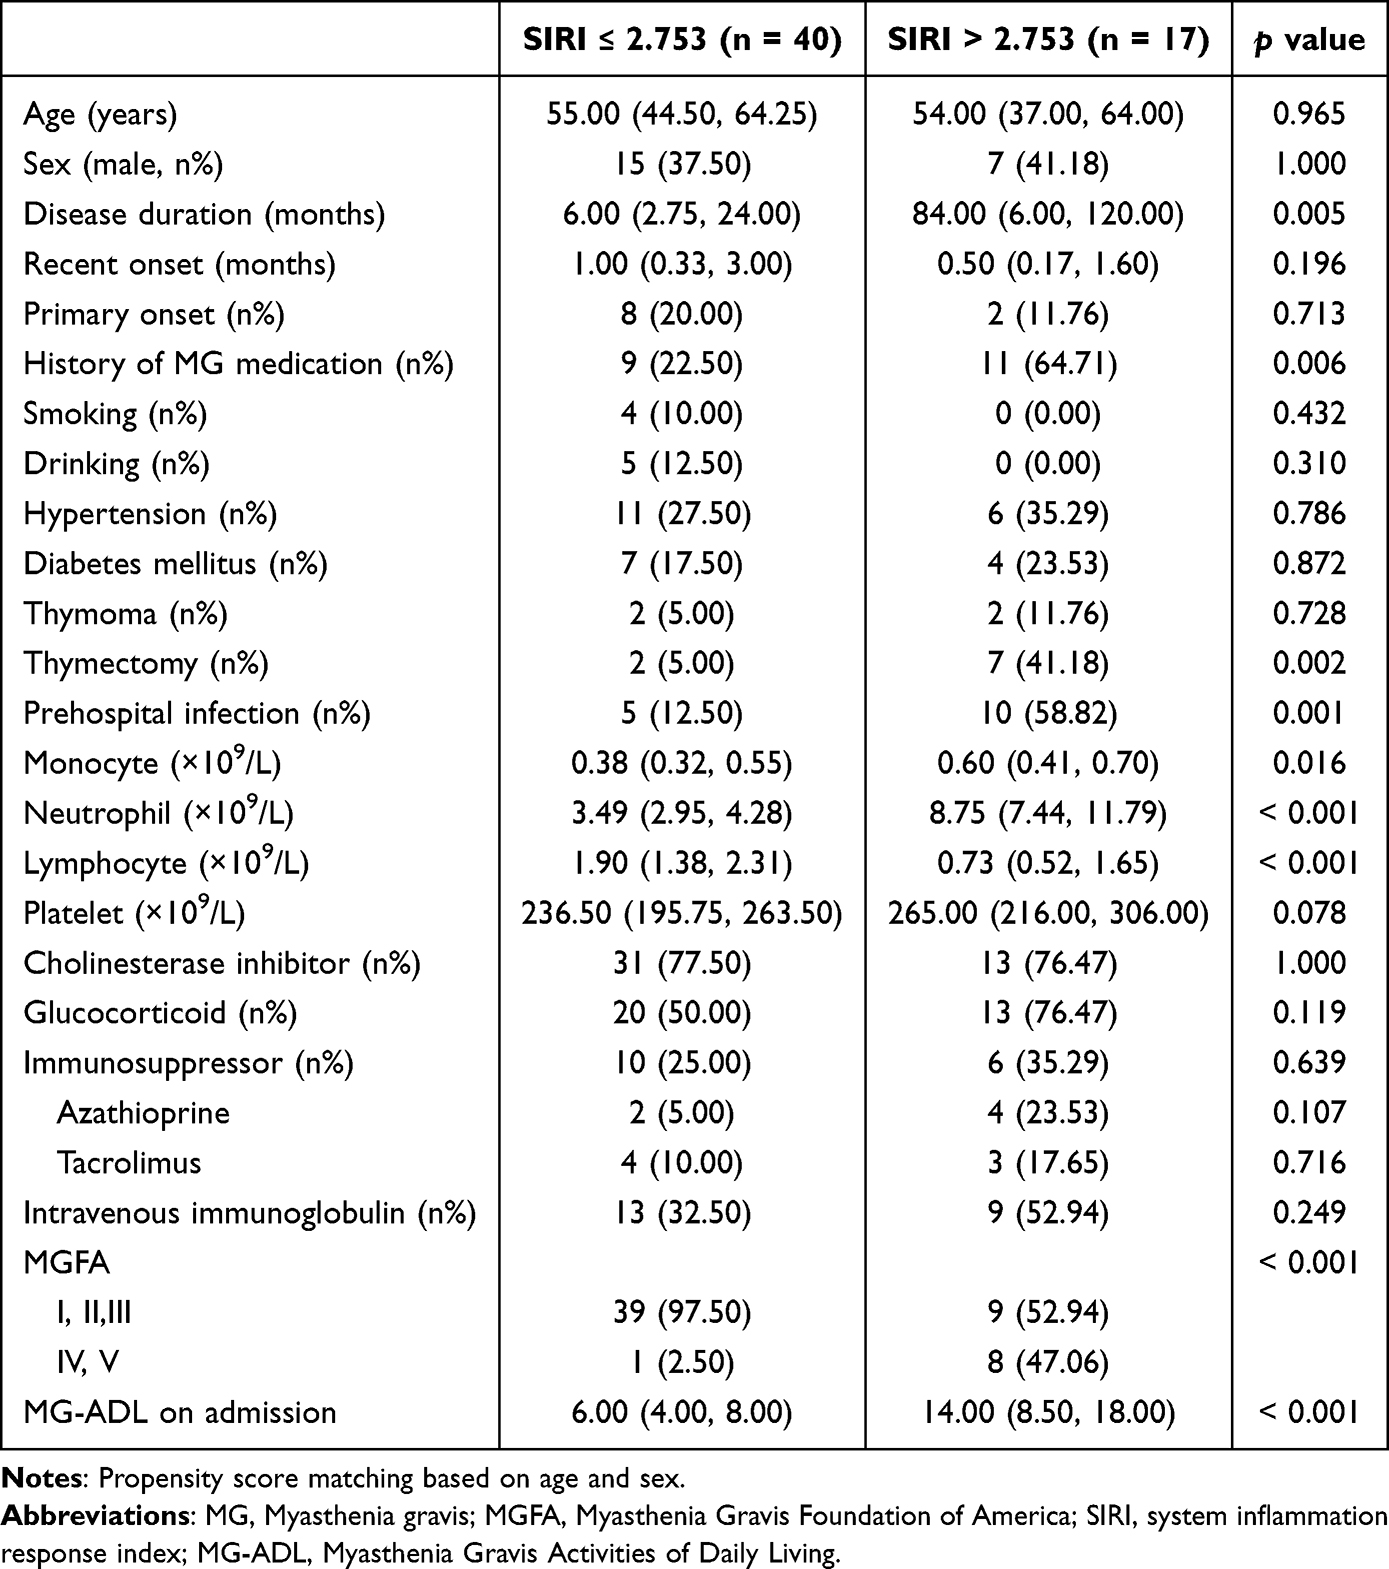 |
Table 2 Characteristics of MG Patients with High and Low SIRI |
 |
Figure 1 Stacked bar chart of MGFA distribution in patients with high and low SIRI. The number marked on the chart is the individuals of each classification. Patients with higher SIRI had higher disease severity (Chi square, p < 0.001). |
There were 30 AChR antibody-positive patients, accounted for 20.98%. 20 of them had antibody level tested, and the median level of AChR antibody was 8.744 nmol/L with inter-quartile range: 0.265–11.587 nmol/L. The level of AChR antibody had no correlation with SIRI (Spearman r = 0.196, p = 0.407). Due to a significant number of patients without antibody detection, and the level of AChR antibody heavily biased, further analysis could not be carried out.
Correlation between SIRI and disease severity
The association between SIRI and other potential influencing factors with disease severity was assessed using univariate and multivariate logistic regression analysis. In the univariate analysis, SIRI demonstrated a significant association with high disease severity (OR = 1.376, 95% CI 1.138–1.664, p = 0.001). Additionally, disease duration (OR = 1.009, 95% CI 1.003–1.016, p = 0.006), history of MG medication (OR = 3.725, 95% CI 1.205–11.517, p = 0.022) and prehospital infection (OR = 25.896, 95% CI 6.516–102.911, p < 0.001) were identified as independent predictors of high disease severity (Table 3).
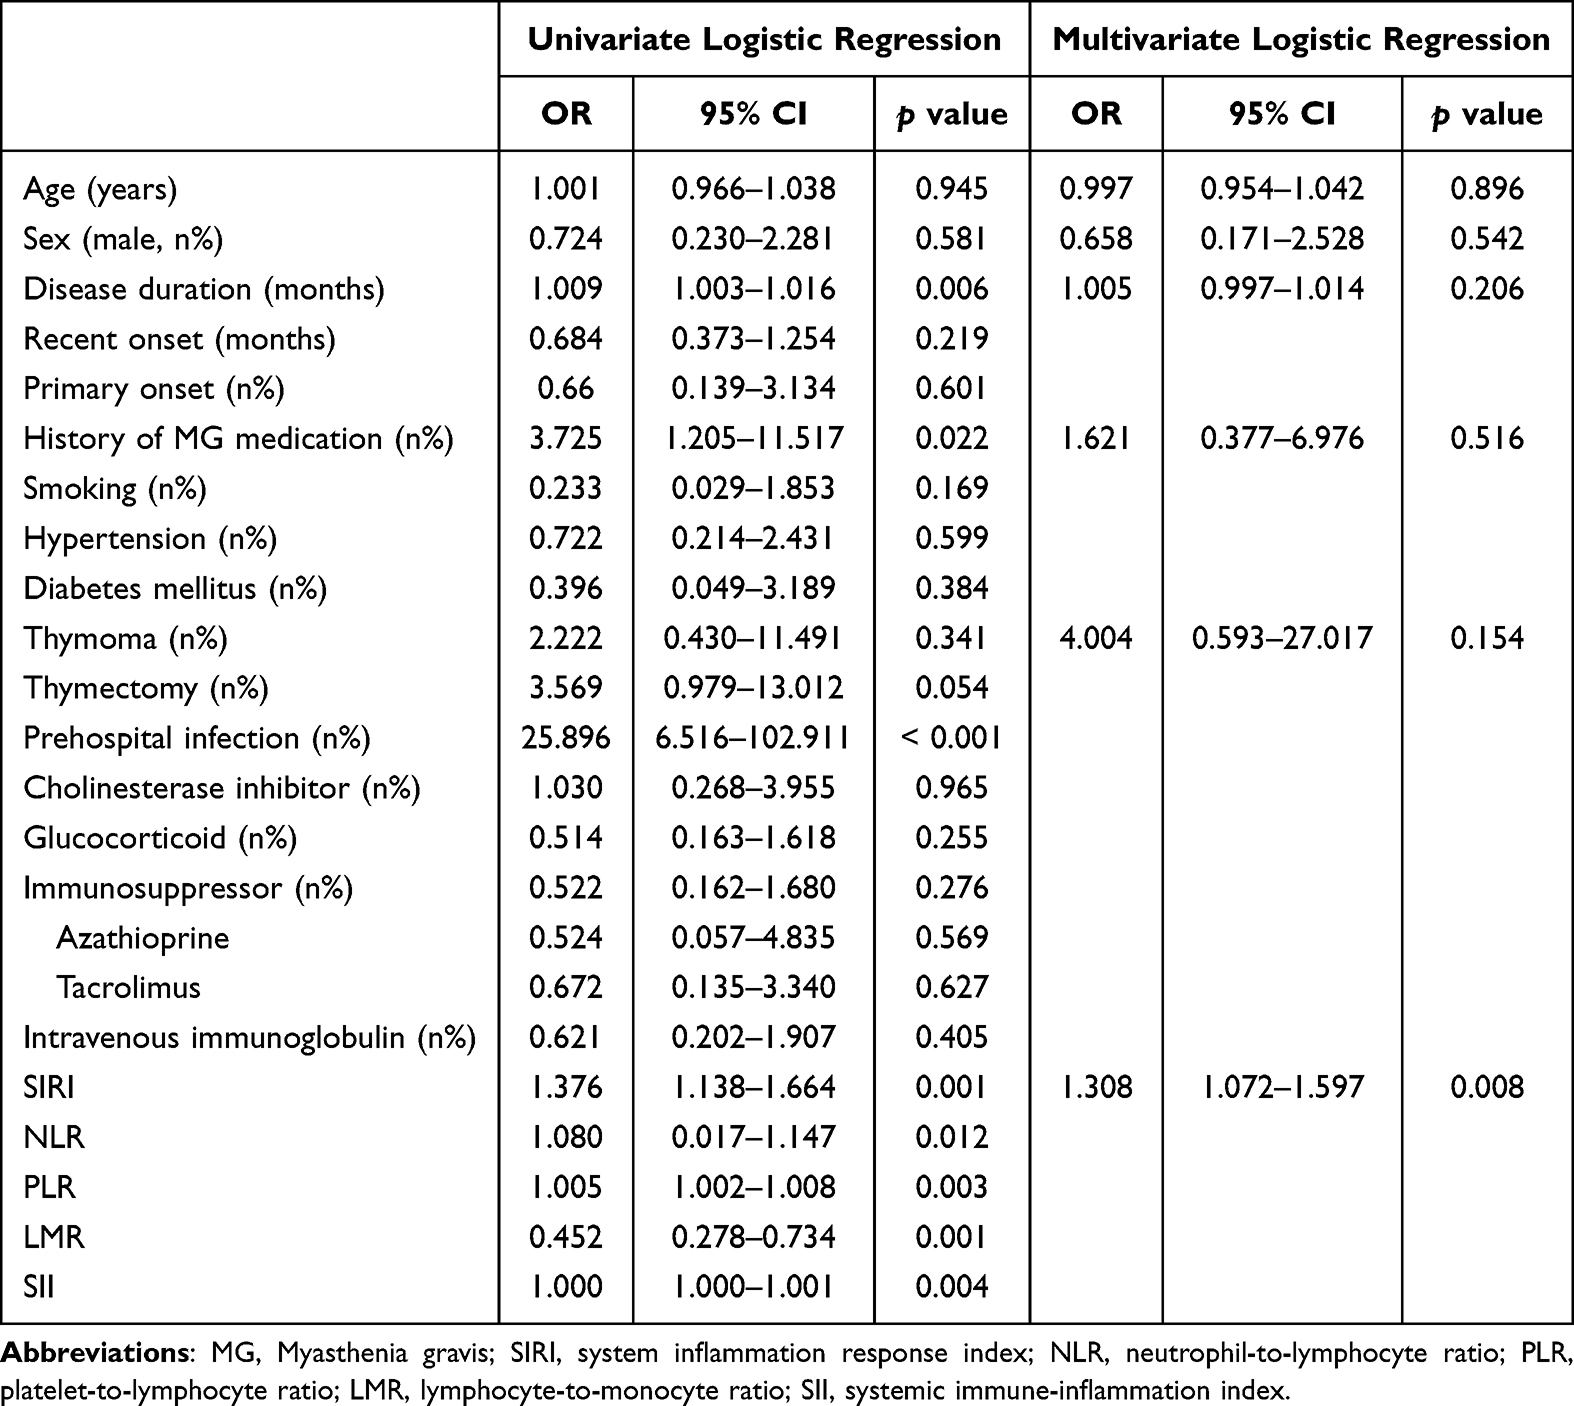 |
Table 3 Logistic Regression Analysis Assessing Different Factors of Worse Disease Severity |
To elucidate whether SIRI independently influenced disease severity, we performed multivariate logistic regressions adjusted for age, sex, disease duration, history of MG medication and thymoma. SIRI remained statistically significant after adjusting for these confounding factors (OR = 1.308, 95% CI 1.072–1.597, p = 0.008) (Table 3). This finding was further corroborated when excluding patients experiencing crisis, with SIRI again exhibiting independent statistical significance (OR = 1.592, 95% CI 1.166–2.174, p = 0.003) (Supplementary Table 1). These results suggest that, within our study, higher SIRI levels independently correlate with greater disease severity.
Correlation between SIRI and ADL score
The relationship between SIRI and ADL scores was explored using Spearman rank correlation analysis. A significant positive correlation was observed (Spearman’s r = 0.232, p = 0.008; linear fitting: Y = 0.1970*X + 0.3198, p < 0.001), as depicted in Figure 2A. This positive association persisted even after excluding patients experiencing crisis (Spearman’s r = 0.196, p = 0.028; linear fitting: Y = 0.1731*X + 0.4508, p < 0.001), as shown in Supplementary Figure 1. Further analysis within various subgroups revealed a similar positive correlation between SIRI and ADL scores in specific patient groups. This association was significant in patients under 60 years old (Spearman’s r = 0.211, p = 0.050), males (Spearman’s r = 0.319, p = 0.016), individuals without a history of MG medication (Spearman’s r = 0.227, p = 0.027), individuals with no smoking history (Spearman’s r = 0.235, p = 0.020), and patients without hypertension (Spearman’s r = 0.224, p = 0.036). Notably, a stronger positive correlation was observed in patients receiving glucocorticoids on admission (Spearman’s r = 0.329, p = 0.007) and those not receiving immunosuppressants (Spearman’s r = 0.282, p = 0.004) (Supplementary Table 2).
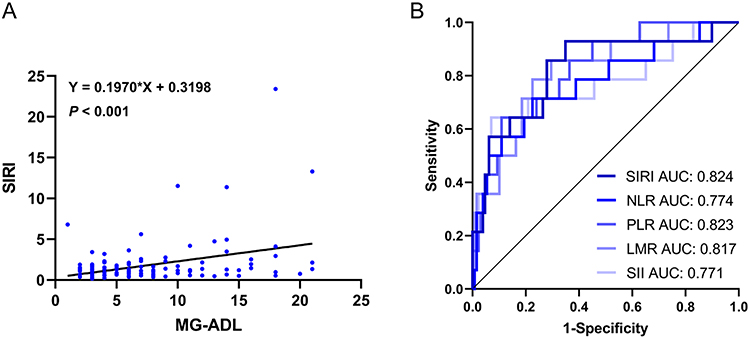 |
Figure 2 (A) Scatter plot of the correlation between SIRI and ADL. Spearman correlation analysis showed a strong correlation between SIRI and ADL (r = 0.232, p = 0.008). The results of linear fitting (Y = 0.1970*X + 0.3198, p < 0.001) also support the positive correlation between them. (B) The evaluation effectiveness of different models for disease severity. After adjusting for confounders (age, sex, disease duration, history of MG medication and thymoma), accuracy of models with different inflammation indicators varied in diagnosing disease severity of MG. The model with SIRI showed the highest AUC of all (AUC = 0.824, all p value of DeLong test > 0.05). |
Clinical efficiency comparison between SIRI and other inflammation indicators
To evaluate the diagnostic utility of SIRI compared to other established inflammation markers, ROC curve analysis and DCA were employed. Prior to constructing the ROC curves, prediction probabilities for each of the five indicators were generated, adjusting for age, sex, disease duration, history of MG medication, and thymoma. SIRI demonstrated the highest AUC (0.824, 95% CI 0.751–0.882, p = 0.003) and followed by PLR (0.823, 95% CI 0.751–0.882, p = 0.004), LMR (0.817, 95% CI 0.744–0.877, p = 0.003), NLR (0.774, 95% CI 0.696–0.839, p = 0.021) and SII (0.771, 95% CI 0.693–0.837, p = 0.008) (Figure 2B and Supplementary Table 3). Although pairwise comparisons did not reach statistical significance, due to potential data limitations, this ranking suggests SIRI’s potential as a superior diagnostic tool. Furthermore, within the adjusted models, SIRI exhibited the highest sensitivity (92.9%) and negative predictive value (98.83%). This superior performance indicates that SIRI may be a valuable screening indicator for diagnosing MG severity.
To comprehensively assess the practical utility of SIRI compared to other inflammation markers, we conducted DCA across multiple models: a baseline model (adjusting for age, sex, disease duration, history of MG medication and thymoma), the SIRI model (adding SIRI to the baseline), and individual models for each other marker (NLR, PLR, LMR, SII) (Figure 3). While the net benefit of intervention based on any model declines with increasing threshold probability, the SIRI model exhibits comparable or slightly superior performance to NLR, PLR, and LMR models for threshold probabilities above 0.25. Compared to the SII model, the SIRI model offers superior benefits around a 0.2 threshold probability. However, adding SIRI to the baseline model can yield negative impacts at probabilities exceeding 0.32, and the SIRI model’s net benefit is less stable at very low thresholds below 0.1. Overall, incorporating SIRI in the model demonstrates optimal performance across a wider range of threshold probabilities (0.1–0.25) and is not inferior to these models of other inflammation indicators.
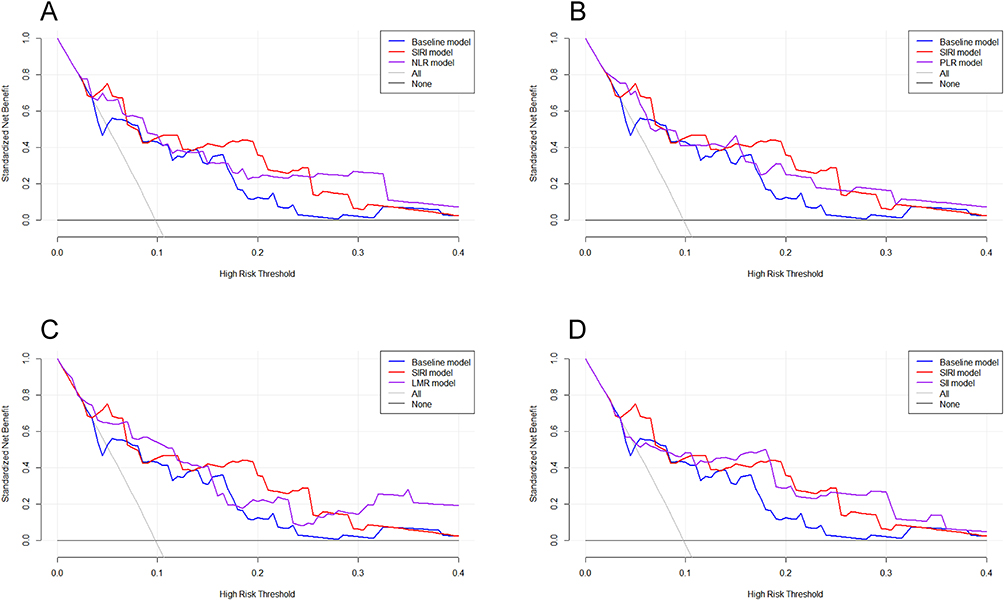 |
Figure 3 Decision curve analysis with SIRI and other inflammation indicators. All models adjusted with age, sex, disease duration, history of MG medication and thymoma. (A) SIRI compared with NLR, (B) SIRI compared with PLR, (C) SIRI compared with LMR, (D) SIRI compared with SII. Compared with NLR, PLR and LMR, SIRI showed more benefits in wide ranges of threshold probability (A–C). Compared with SII, SIRI performed better with a threshold probability at around 0.2. |
Subgroup analysis and interaction effects
To identify potential heterogeneity within subgroups of mild and moderate MG patients and explore interactions between these subgroups and SIRI, we conducted a subgroup analysis adjusted for age, sex, disease duration, history of MG medication and thymoma. The results revealed no statistically significant interaction between SIRI and age, gender, history of MG medication, smoking, hypertension, prehospital infection or glucocorticoid use (all p interaction > 0.05). However, significant interaction effects were observed with immunosuppressant use (p interaction = 0.001) and intravenous immunoglobulin use (p interaction = 0.005). This suggests that the findings were generally consistent across most subgroups, except for those receiving immunosuppressants and intravenous immunoglobulin, and strengthens the reliability of the conclusions. Further analysis identified specific patient groups within which SIRI demonstrated a stronger association with disease severity. This was evident in younger patients (≤ 60 years old) (OR = 0.630, 95% CI 0.432–0.921, p = 0.017), females (OR = 0.557, 95% CI 0.320–0.969, p = 0.038), individuals with a history of MG medication (OR = 0.771, 95% CI 0.596–0.997, p = 0.048), non-smokers (OR = 0.785, 95% CI 0.639–0.964, p = 0.021) and those without hypertension (OR = 0.671, 95% CI 0.474–0.949, p = 0.024). Interestingly, the association between SIRI and disease severity remained statistically significant in both groups receiving (OR = 0.789, 95% CI 0.626–0.994, p = 0.044) and not receiving (OR = 0.269, 95% CI 0.093–0.778, p = 0.015) glucocorticoids, suggesting a potential complex interplay between these factors. These findings are presented in detail in Table 4.
 |
Table 4 Subgroup Analysis of the Association Between SIRI and Mild and Moderate State |
Discussion
The innovation of our study was to explore the correlation between SIRI and MG disease severity, demonstrating its consistent independent association in adjusted models and often superior performance compared to NLR. Notably, subgroup analysis revealed SIRI’s lack of interaction with other factors and its enhanced prognostic value in younger patients, females, individuals with prior MG medication, and non-smokers or those without hypertension.
Monocytes, a subset of circulating leukocytes, play a pivotal role in both innate and adaptive immunity, primarily functioning in immune defense, inflammation, and tissue remodeling.20 Their categorization into classical, intermediate, and non-classical subsets is based on the expression of surface markers CD14 and CD16.21 Neutrophils, integral to innate immunity alongside monocytes, participate in infection defense through processes such as phagocytosis and the release of neutrophil extracellular traps (NETs), which may contribute to tissue damage inappropriately during inflammation.22 Neutrophils have also been viewed as terminal effector cells of an acute inflammatory response, playing a crucial role in the pathogenesis of a broad range of diseases, including those resulting from autoimmunity and chronic inflammation.23 It has been established that dysregulated neutrophil resolution programs, evidenced by elevated frequencies of neutrophil-associated proteases, cell-free DNA and autoantibodies in diverse pathologies, contribute to the exacerbation of multiple pathological conditions.24 In the context of innate immunity, matrix metalloproteinases (MMPs) have been implicated in immune cell infiltration, basement membrane breakdown and autoimmune pathogenesis. Studies have indicated elevated levels of MMP9, MMP2, and MMP3 in some subtypes of MG patients.25 The elevated levels of monocytes and neutrophils observed in MG patients might be partially explained by the increased MMP activity, which contributes to tissue inflammation. Additionally, the decrease in lymphocyte count, a hallmark of systemic inflammatory response,26 is commonly observed in MG. Notably, a growing body of evidence suggests significant variations within lymphocyte subpopulations in MG patients.27–29 Besides, elevated free light chains (FLC), a biomarker of B cell activation, have been detected in MG patients and hold promise as diagnostic indicators,30,31 suggesting the important role of lymphocytes in morbidity of MG. SIRI, by integrating three key inflammatory blood cell counts, provides a more comprehensive and sensitive reflection of the inflammatory state within the human body. The combined elevation of monocytes and neutrophils alongside the reduction in lymphocytes strengthens SIRI’s ability to monitor and potentially predict the inflammatory status in MG patients.
Decision curve analysis, introduced in 2006, is a valuable tool for evaluating the clinical utility of prediction models and diagnostic tests.32 It surpasses traditional statistical measures, which often lack direct translation to clinical benefit.33 DCA visualizes the relationship between threshold probability and net benefit, a metric incorporating both correctly identified and misdiagnosed patients.19 Threshold probability denotes the minimum disease probability at which an intervention is chosen. In our study, the SIRI model demonstrated favorable net benefit across a range of threshold probabilities (0.1–0.3), indicating clear clinical value. Notably, when compared to NLR, SIRI exhibited a slight advantage in terms of net benefit within the threshold range of 0.1 to 0.25.
While disease duration is a frequent metric in retrospective and cross-sectional studies, the influence of time since the last onset and history of MG medication remains less explored. This study demonstrates a significant association between both longer disease duration and higher SIRI with increased disease severity (p = 0.023, p = 0.005, respectively). Notably, it is highly conceivable that there is an interplay between these factors. Individuals experiencing their first MG episode generally exhibit a consistent disease course, where the “time of last onset” coincides with the overall disease duration. Conversely, for patients with recurrent episodes, the time gap between the most recent onset and study admission tends to be shorter than the total disease duration. These latter individuals are also more likely to have a history of MG medication use. Consistently, we found that patients with greater disease severity demonstrated a shorter time gap between onset and admission (p = 0.039) and a higher prevalence of MG medication history (p = 0.036). Similarly, a positive association between higher SIRI and MG medication history was observed (p = 0.006). In an overall review, while disease severity may not directly correlate with whether a patient is experiencing their first MG episode, it appears to be influenced by the time elapsed since the most recent onset and, more significantly, by a history of MG medication use. This suggests a potential link between disease severity and the cumulative effects of recurrent episodes and prior interventions.
MG is known to be associated with various comorbidities, including hypertension and diabetes.34 However, research on the specific impact of hypertension in MG remains relatively sparse. Herein, we observed a significant association between low SIRI and better disease severity solely in the subgroup of patients without hypertension (p = 0.024). This suggests a potential interaction between SIRI and hypertension that warrants further investigation. While existing literature supports the notion that diabetes mellitus exacerbates experimental autoimmune MG via modulating both adaptive and innate immunity and aggravates humoral immune response in MG by promoting differentiation and activation of circulating Tfh cells.35,36 Unfortunately, our study did not yield any statistically significant findings related to diabetes. This may be attributed to potential uneven data distribution due to the limited size of our cohort.
Previous research has established a robust association between thymoma and more severe clinical presentations in MG patients, with thymectomy demonstrating efficacy in improving prognosis regardless of thymoma presence.37–39 A pivotal study40 further highlighted the correlation between thymoma and worse myasthenic symptoms and long-term outcomes. Notably, within our cohort, although a higher SIRI was associated with a greater likelihood of thymectomy (p = 0.002), subgroup analysis including thymoma status was not feasible due to the limited number of participants with this comorbidity (7.69% compared to 10% reported in the literature1). This discrepancy may be attributed to two potential factors: firstly, a lower baseline prevalence of thymoma within our study population compared to others, and secondly, the possibility of undiagnosed cases due to infrequent pathological investigations in these patients. Unfortunately, our analysis did not reveal any significant associations between SIRI and diabetes, which may be due to potential imbalances within the data distribution resulting from the relatively small study population size.
The existing literature has established a connection between infection and MG exacerbations, with studies demonstrating the potential for infections to trigger MG onset and worsen its course.41,42 COVID-19 infection, in particular, has been associated with an increased risk of new-onset MG, myasthenic crisis, respiratory failure, and higher mortality rate due to cytokine storms in MG patients.43 These findings highlight the potential role of infection in MG pathogenesis. On the other hand, investigations have suggested immunosuppressive therapy, a mainstay treatment for MG, may be a risk factor for severe COVID-19 infection, though not for SARS-CoV-2 infection itself.44 This underscores the complex interplay between infection and the immune system in MG patients. Considering the established association between infection and MG, and its potential influence on disease severity, we undertook a sub-analysis within our study population focused on patients with pre-hospital infections. Our analysis revealed a significant association between pre-hospital infection and both disease severity and elevated SIRI levels (p < 0.001, p = 0.001). Given this strong correlation, we opted not to adjust for pre-hospital infection in our multivariate logistic regression analysis to avoid potential confounding bias. Our findings further support the hypothesis that infection plays a crucial role in the pathogenesis and progression of MG, warranting further investigation into its specific mechanisms and potential as a modifiable risk factor.
While highlighting the significant association between SIRI and MG severity, this study acknowledges certain limitations: (1) As a retrospective study, the selection of experimental population lacks randomness and the available clinical scores are limited. (2) The small amount of population cannot support more detailed statistics. (3) As a single-center study, there is a deficiency in external validation. (4) Due to the insufficient amount of antibody data, we are currently unable to carry out more detailed analysis. Future investigations are encouraged to explore the inflammatory pathogenesis of MG and elucidate the relationship between SIRI and other crucial aspects like prognosis.
Conclusion
In our study, we found that SIRI was independently associated with disease severity of MG on admission and while interacting with immunosuppressor and intravenous immunoglobulin, was robust in most populations, which indicates SIRI may be a reliable and effective biomarker in MG. In addition, the results of DCA supported the clinical value of SIRI.
Author Contributions
All authors made a significant contribution to the work reported, whether that is in the conception, study design, execution, acquisition of data, analysis and interpretation, or in all these areas; took part in drafting, revising or critically reviewing the article; gave final approval of the version to be published; have agreed on the journal to which the article has been submitted; and agree to be accountable for all aspects of the work.
Funding
Wenzhou Municipal Sci-Tech Bureau Program (No. Y2020426).
Disclosure
The authors pronounce that the research was directed without any commercial or financial relationships that could be interpreted as a potential conflict of interest.
References
1. Gilhus NE. Myasthenia Gravis. N Engl J Med. 2016;375:2570–2581. doi:10.1056/NEJMra1602678
2. Gilhus NE, Verschuuren JJ. Myasthenia gravis: subgroup classification and therapeutic strategies. Lancet Neurol. 2015;14:1023–1036. doi:10.1016/S1474-4422(15)00145-3
3. Huda R. Inflammation and autoimmune myasthenia gravis. Front Immunol. 2023;14:1110499. doi:10.3389/fimmu.2023.1110499
4. Uzawa A, Kuwabara S, Suzuki S, et al. Roles of cytokines and T cells in the pathogenesis of myasthenia gravis. Clin Exp Immunol. 2021;203:366–374. doi:10.1111/cei.13546
5. Wang Z, Yan Y. Immunopathogenesis in myasthenia gravis and neuromyelitis optica. Front Immunol. 2017;8:1785. doi:10.3389/fimmu.2017.01785
6. Jiang Z, Ning Z, Yang L, et al. The correlation of neutrophil-to-lymphocyte ratio with the presence and short-time curative effect of myasthenia gravis in children: a retrospectively study. Int J Neurosci. 2021;131:894–901. doi:10.1080/00207454.2020.1759592
7. Duan Z, Jia A, Cui W, Feng J. Correlation between neutrophil-to-lymphocyte ratio and severity of myasthenia gravis in adults: a retrospective study. J Clin Neurosci. 2022;106:117–121. doi:10.1016/j.jocn.2022.10.017
8. Yang DH, Qian MZ, Wei MM, et al. The correlation of neutrophil-to-lymphocyte ratio with the presence and activity of myasthenia gravis. Oncotarget. 2017;8:76099–76107. doi:10.18632/oncotarget.18546
9. Huang X, Xu M, Wang Y, et al. The systemic inflammation markers as possible indices for predicting respiratory failure and outcome in patients with myasthenia gravis. Ann Clin Transl Neurol. 2023;10:98–110. doi:10.1002/acn3.51706
10. Wei L, Xie H, Yan P. Prognostic value of the systemic inflammation response index in human malignancy: a meta-analysis. Medicine (Baltimore). 2020;99:e23486. doi:10.1097/MD.0000000000023486
11. Zhang Y, Xing Z, Zhou K, Jiang S. The predictive role of systemic inflammation response index (SIRI) in the prognosis of stroke patients. Clin Interv Aging. 2021;16:1997–2007. doi:10.2147/CIA.S339221
12. Jin Z, Wu Q, Chen S, et al. The associations of two novel inflammation indexes, sii and siri with the risks for cardiovascular diseases and all-cause mortality: a ten-year follow-up study in 85,154 individuals. J Inflamm Res. 2021;14:131–140. doi:10.2147/JIR.S283835
13. Dziedzic EA, Gąsior JS, Tuzimek A, et al. Investigation of the associations of novel inflammatory biomarkers-systemic inflammatory index (SII) and systemic inflammatory response index (SIRI)-with the severity of coronary artery disease and acute coronary syndrome occurrence. Int J Mol Sci;2022. 23. doi:10.3390/ijms24010023
14. Xu Y, He H, Zang Y, et al. Systemic inflammation response index (SIRI) as a novel biomarker in patients with rheumatoid arthritis: a multi-center retrospective study. Clin Rheumatol. 2022;41:1989–2000. doi:10.1007/s10067-022-06122-1
15. Zhao S, Dong S, Qin Y, Wang Y, Zhang B, Liu A. Inflammation index SIRI is associated with increased all-cause and cardiovascular mortality among patients with hypertension. Front Cardiovasc Med. 2022;9:1066219. doi:10.3389/fcvm.2022.1066219
16. Chao B, Ju X, Zhang L, Xu X, Zhao Y. A novel prognostic marker systemic inflammation response index (SIRI) for operable cervical cancer patients. Front Oncol. 2020;10:766. doi:10.3389/fonc.2020.00766
17. Liu Z, Ge H, Miao Z, Shao S, Shi H, Dong C. Dynamic changes in the systemic inflammation response index predict the outcome of resectable gastric cancer patients. Front Oncol. 2021;11:577043. doi:10.3389/fonc.2021.577043
18. Jaretzki A, Barohn RJ, Ernstoff RM, et al. Myasthenia gravis: recommendations for clinical research standards. task force of the medical scientific advisory board of the myasthenia gravis foundation of America. Neurology. 2000;55:16–23. doi:10.1212/WNL.55.1.16
19. Vickers AJ, Holland F. Decision curve analysis to evaluate the clinical benefit of prediction models. Spine J. 2021;21:1643–1648. doi:10.1016/j.spinee.2021.02.024
20. Kratofil RM, Kubes P, Deniset JF. Monocyte Conversion During Inflammation and Injury. Arterioscler Thromb Vasc Biol. 2017;37:35–42. doi:10.1161/ATVBAHA.116.308198
21. Ożańska A, Szymczak D, Rybka J. Pattern of human monocyte subpopulations in health and disease. Scand J Immunol. 2020;92:e12883.
22. Castanheira FVS, Kubes P. Neutrophils and NETs in modulating acute and chronic inflammation. Blood. 2019;133:2178–2185. doi:10.1182/blood-2018-11-844530
23. Mantovani A, Cassatella MA, Costantini C, Jaillon S. Neutrophils in the activation and regulation of innate and adaptive immunity. Nat Rev Immunol. 2011;11:519–531. doi:10.1038/nri3024
24. Singhal A, Kumar S. Neutrophil and remnant clearance in immunity and inflammation. Immunology. 2022;165:22–43. doi:10.1111/imm.13423
25. Helgeland G, Petzold A, Luckman SP, Gilhus NE, Plant GT, Romi FR. Matrix metalloproteinases in myasthenia gravis. Eur Neurol. 2011;65:53–58. doi:10.1159/000322737
26. Núñez J, Miñana G, Bodí V, et al. Low lymphocyte count and cardiovascular diseases. Curr Med Chem. 2011;18(21):3226–3233. doi:10.2174/092986711796391633
27. Aarli JA, Heimann P, Matre R, Thunold S, Tönder O. Lymphocyte subpopulations in thymus and blood from patients with myasthenia gravis. J Neurol Neurosurg Psychiatry. 1979;42:29–34. doi:10.1136/jnnp.42.1.29
28. Landi G, Galli M, Ciboddo G, Colombo G, Scarlato G. Lymphocyte subpopulations and surface membrane immunoglobulins in myasthenia gravis. J Neurol Neurosurg Psychiatry. 1982;45:158–161. doi:10.1136/jnnp.45.2.158
29. Robat-Jazi B, Hosseini M, Shaygannejad V, et al. High Frequency of Tc22 and Th22 cells in myasthenia gravis patients and their significant reduction after thymectomy. Neuroimmunomodulation. 2018;25:80–88. doi:10.1159/000490855
30. Gambino CM, Agnello L, Lo Sasso B, et al. The role of serum free light chain as biomarker of Myasthenia Gravis. Clin Chim Acta. 2022;528:29–33. doi:10.1016/j.cca.2022.01.004
31. Wilf-Yarkoni A, Alkalay Y, Brenner T, Karni A. High κ free light chain is a potential biomarker for double seronegative and ocular myasthenia gravis. Neurol Neuroimmunol Neuroinflamm. 2020;7. doi:10.1212/NXI.0000000000000831
32. Vickers AJ, Elkin EB. Decision curve analysis: a novel method for evaluating prediction models. Med Decis Making. 2006;26:565–574. doi:10.1177/0272989X06295361
33. Vickers AJ, van Calster B, Steyerberg EW. A simple, step-by-step guide to interpreting decision curve analysis. Diagn Progn Res. 2019;3:18. doi:10.1186/s41512-019-0064-7
34. Tanovska N, Novotni G, Sazdova-Burneska S, et al. Myasthenia gravis and associated diseases. Open Access Maced J Med Sci. 2018;6:472–478. doi:10.3889/oamjms.2018.110
35. Li T, Yang CL, Du T, et al. Diabetes mellitus aggravates humoral immune response in myasthenia gravis by promoting differentiation and activation of circulating Tfh cells. Clin Immunol. 2022;245:109141. doi:10.1016/j.clim.2022.109141
36. Zhang P, Yang CL, Du T, et al. Diabetes mellitus exacerbates experimental autoimmune myasthenia gravis via modulating both adaptive and innate immunity. J Neuroinflammation. 2021;18:244. doi:10.1186/s12974-021-02298-6
37. Ng WC, Hartley L. Effectiveness of thymectomy in juvenile myasthenia gravis and clinical characteristics associated with better outcomes. Neuromuscul Disord. 2021;31:1113–1123. doi:10.1016/j.nmd.2021.09.013
38. Mi W, Silvestri NJ, Wolfe GI. A neurologist’s perspective on thymectomy for myasthenia gravis: current perspective and future trials. Thorac Surg Clin. 2019;29:143–150. doi:10.1016/j.thorsurg.2018.12.003
39. Wolfe GI, Kaminski HJ, Aban IB, et al. Long-term effect of thymectomy plus prednisone versus prednisone alone in patients with non-thymomatous myasthenia gravis: 2-year extension of the MGTX randomised trial. Lancet Neurol. 2019;18:259–268. doi:10.1016/S1474-4422(18)30392-2
40. Álvarez-Velasco R, Gutiérrez-Gutiérrez G, Trujillo JC, et al. Clinical characteristics and outcomes of thymoma-associated myasthenia gravis. Eur J Neurol. 2021;28:2083–2091. doi:10.1111/ene.14820
41. Gilhus NE, Romi F, Hong Y, Skeie GO. Myasthenia gravis and infectious disease. J Neurol. 2018;265:1251–1258. doi:10.1007/s00415-018-8751-9
42. Gummi RR, Kukulka NA, Deroche CB, Govindarajan R. Factors associated with acute exacerbations of myasthenia gravis. Muscle Nerve. 2019;60:693–699. doi:10.1002/mus.26689
43. Tugasworo D, Kurnianto A, Andhitara Y, Ardhini R, Budiman J. The relationship between myasthenia gravis and COVID-19: a systematic review. Egypt J Neurol Psychiatr Neurosurg. 2022;58:83. doi:10.1186/s41983-022-00516-3
44. Stascheit F, Grittner U, Hoffmann S, et al. Risk and course of COVID-19 in immunosuppressed patients with myasthenia gravis. J Neurol. 2023;270:1–12. doi:10.1007/s00415-022-11389-0
 © 2024 The Author(s). This work is published and licensed by Dove Medical Press Limited. The full terms of this license are available at https://www.dovepress.com/terms.php and incorporate the Creative Commons Attribution - Non Commercial (unported, v3.0) License.
By accessing the work you hereby accept the Terms. Non-commercial uses of the work are permitted without any further permission from Dove Medical Press Limited, provided the work is properly attributed. For permission for commercial use of this work, please see paragraphs 4.2 and 5 of our Terms.
© 2024 The Author(s). This work is published and licensed by Dove Medical Press Limited. The full terms of this license are available at https://www.dovepress.com/terms.php and incorporate the Creative Commons Attribution - Non Commercial (unported, v3.0) License.
By accessing the work you hereby accept the Terms. Non-commercial uses of the work are permitted without any further permission from Dove Medical Press Limited, provided the work is properly attributed. For permission for commercial use of this work, please see paragraphs 4.2 and 5 of our Terms.