")
Back to Journals » International Journal of Nanomedicine » Volume 19
Preclinical Efficacy of Cabazitaxel Loaded Poly(2-alkyl cyanoacrylate) Nanoparticle Variants
Authors Valsalakumari R , Pandya AD , Prasmickaite L, Kvalvaag A, Myrann AG, Åslund AKO, Kjos MS, Fontecha-Cuenca C, Haroon HB, Ribeiro ARS , Horejs-Hoeck J, Moghimi SM, Mørch Ý, Skotland T , Sandvig K , Mælandsmo GM, Iversen TG
Received 30 November 2023
Accepted for publication 9 March 2024
Published 26 March 2024 Volume 2024:19 Pages 3009—3029
DOI https://doi.org/10.2147/IJN.S450283
Checked for plagiarism Yes
Review by Single anonymous peer review
Peer reviewer comments 4
Editor who approved publication: Prof. Dr. Anderson Oliveira Lobo
Remya Valsalakumari,1– 3 Abhilash D Pandya,3,* Lina Prasmickaite,3,* Audun Kvalvaag,1,2 Anne Grethe Myrann,1,2 Andreas KO Åslund,4 Marianne Steinsvik Kjos,4 Cristina Fontecha-Cuenca,5,6 Hajira B Haroon,5 Ana RS Ribeiro,7 Jutta Horejs-Hoeck,7,8 S Moein Moghimi,5,9,10 Ýrr Mørch,4 Tore Skotland,1,2 Kirsten Sandvig,1,2,11 Gunhild Mari Mælandsmo,3,12 Tore Geir Iversen1,2
1Department of Molecular Cell Biology, Institute for Cancer Research, Oslo University Hospital, Oslo, 0379, Norway; 2Centre for Cancer Cell Reprogramming, University of Oslo, Oslo, 0379, Norway; 3Department of Tumor Biology, Institute for Cancer Research, Oslo University Hospital, Oslo, 0379, Norway; 4Department of Biotechnology and Nanomedicine, SINTEF AS, Trondheim, 7034, Norway; 5School of Pharmacy, Newcastle University, Newcastle upon Tyne, NE1 7RU, UK; 6Department of Biomedical Science, University of Padova, Padova, Italy; 7Department of Biosciences and Medical Biology, Paris Lodron University Salzburg, Salzburg, 5020, Austria; 8Cancer Cluster Salzburg, Salzburg, 5020, Austria; 9Faculty of Health and Medical Sciences, Translational and Clinical Research Institute, Newcastle University, Newcastle upon Tyne, NE2 4HH, UK; 10Colorado Center for Nanomedicine and Nanosafety, University of Colorado Anschutz Medical Center, Aurora, CO, USA; 11Department of Biosciences, University of Oslo, Oslo, 0316, Norway; 12Department of Medical Biology, University of Tromsø, Tromsø, 9019, Norway
*These authors contributed equally to this work
Correspondence: Tore Geir Iversen, Department of Molecular Cell Biology, Institute for Cancer Research, Oslo University Hospital, Oslo, 0379, Norway, Tel +47 22781826, Email [email protected]
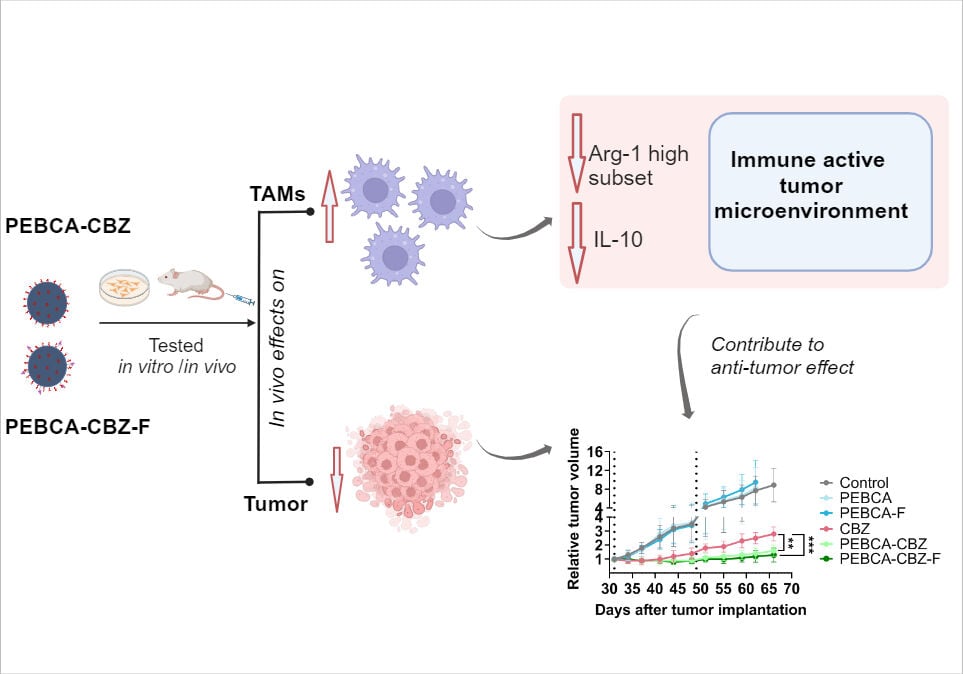
Background: Biodegradable poly(alkyl cyanoacrylate) (PACA) nanoparticles (NPs) are receiving increasing attention in anti-cancer nanomedicine development not only for targeted cancer chemotherapy, but also for modulation of the tumor microenvironment. We previously reported promising results with cabazitaxel (CBZ) loaded poly(2-ethylbutyl cyanoacrylate) NPs (PEBCA-CBZ NPs) in a patient derived xenograft (PDX) model of triple-negative breast cancer, and this was associated with a decrease in M2 macrophages. The present study aims at comparing two endotoxin-free PACA NP variants (PEBCA and poly(2-ethylhexyl cyanoacrylate); PEHCA), loaded with CBZ and test whether conjugation with folate would improve their effect.
Methods: Cytotoxicity assays and cellular uptake of NPs by flow cytometry were performed in different breast cancer cells. Biodistribution and efficacy studies were performed in PDX models of breast cancer. Tumor associated immune cells were analyzed by multiparametric flow cytometry.
Results: In vitro studies showed similar NP-induced cytotoxicity patterns despite difference in early NP internalization. On intravenous injection, the liver cleared the majority of NPs. Efficacy studies in the HBCx39 PDX model demonstrated an enhanced effect of drug-loaded PEBCA variants compared with free drug and PEHCA NPs. Furthermore, the folate conjugated PEBCA variant did not show any enhanced effects compared with the unconjugated counterpart which might be due to unfavorable orientation of folate on the NPs. Finally, analyses of the immune cell populations in tumors revealed that treatment with drug loaded PEBCA variants affected the myeloid cells, especially macrophages, contributing to an inflammatory, immune activated tumor microenvironment.
Conclusion: We report for the first time, comparative efficacy of PEBCA and PEHCA NP variants in triple negative breast cancer models and show that CBZ-loaded PEBCA NPs exhibit a combined effect on tumor cells and on the tumor associated myeloid compartment, which may boost the anti-tumor response.
Keywords: poly(alkyl cyanoacrylate), cabazitaxel, breast cancer, patient-derived xenograft, tumor microenvironment
Graphical Abstract:
Introduction
Engineered nanomaterials for efficient tumor drug delivery have gained much attention during the last two decades. Even though the success rate of clinical translation is still low1 many preclinical studies are ongoing and there is an increasing focus on modulating the tumor microenvironment.2–4 Several polymer-based NPs have been explored during the past years for their ability to deliver drugs to tumors and modulate the tumor microenvironment.5,6 A few of them entered clinical trials, and the PACA-based nanoformulation of doxorubicin called Livatag® entered Phase III, but the development was terminated due to low efficacy.7 PACA polymers are biocompatible8,9 and biodegradable,8–10 and nanomaterials based on different ACA monomers have been used for tumor drug delivery and wound healing. We have previously published several articles, involving PEGylated PACA variants, and reported their biological effects in different cancer cells9,11,12 and also enhanced therapeutic efficacy of CBZ loaded PEBCA NPs in a patient-derived triple negative breast cancer xenograft model.10 Another recent article demonstrates the potential of CBZ loaded PACA NPs to improve treatment response in in vivo models of peritoneal metastases.13
An appealing factor to conduct more studies with such delivery systems would be their proven capacity to favorably alter the pharmacokinetics and bioavailability of chemotherapies already used in the clinic, thereby reducing the need for higher drug doses. CBZ is a second generation taxane currently in clinical use for metastatic castration resistant prostate cancer14 and in clinical trials for breast cancer.15,16 The main advantage of CBZ compared with other taxanes is its low affinity towards p-glycoprotein (P-gp), thus increasing the retention in cells.14 Still, low aqueous solubility, high plasma protein binding and toxic effects of CBZ limit the clinical use and demand alternate methods to improve its efficacy.17 In addition, these NPs can also offer an alternative therapeutic strategy for hard to treat and resistant cancers. Triple negative breast cancer (TNBC) is one such type which accounts for about 15–20% of all breast cancers. They tend to be more common in younger women, very aggressive with high mortality and therapeutically challenging because of very low or no expression of ER, PR and HER2 proteins.18 Thus, until recently no targeted therapy has been available, and the treatment has traditionally been chemotherapy. Many NPs have been engineered with a goal to overcome such hurdles by integrating physical, chemical or pharmacological targeting of tumors or/and their microenvironment to result in tumor regression.4
Folate receptor (FolR) mediated targeting using NPs has risen as an attractive and one of the most evaluated methods because of the overexpression of these receptors (FolR1) in many cancer cell types.19 Herein, we report pre-clinical evaluation of two different PACA NP variants (PEBCA and PEHCA), both with or without folate on their PEGylated surface and loaded with CBZ into their hydrophobic core. The cellular uptake and cytotoxicity of these NPs were assessed in vitro using breast cancer cell lines with different molecular characteristics. In vivo biodistribution and therapeutic efficacy were validated mainly using the patient-derived xenograft (PDX) model HBCx39.
The role of tumor infiltrated immune cells in tumor progression is a hot topic and scientific knowledge in this field forms the basis for emerging immunotherapies.20 Different NPs have shown the ability to modulate the tumor immune microenvironment and thereby contribute to tumor regression in pre-clinical studies.21 Our previous reports showed that treatment with PEBCA-CBZ NPs induced a significant decrease of the pro-tumorigenic M2 phenotype and a corresponding increase of the anti-tumorigenic M1 phenotype within the macrophage population associated with MAS98.12 PDX tumors.10 A beneficial influence of different NPs on macrophage recruitment, differentiation and polarization has also been reported in several other studies.22,23 Furthermore, CBZ independently of its cancer killing effects, can also “push” macrophages towards M1 phenotype and potentiate their anti-cancer functions.24 Hence, optimal effects of NPs on tumor associated myeloid cells can be exploited to achieve therapeutic benefit. Different monomers have been explored to synthesize PACA variants, their biological effects were assessed and PEBCA and PEHCA were observed to be more favorable.8,9 The present study compares the in vitro and in vivo efficacy of CBZ loaded PEBCA and PEHCA variants with or without folate conjugation. Our results demonstrate the potential of CBZ loaded PEBCA NPs for use in treatment of TNBC and highlight their impact on the tumor-associated myeloid compartment, which may positively contribute to the therapeutic outcome.
Materials and Methods
Materials
RPMI 1640 medium, 10X folate free RPMI, DMEM medium, bovine serum albumin (BSA), fetal bovine serum (FBS), dimethyl sulfoxide (DMSO), 3-(4,5-dimethyl-2-thiazolyl)-2,5-diphenyltetrazolium bromide (MTT; cat#M5655), and penicillin/streptomycin (Pen/Strep P4333) were purchased from Merck (Darmstadt, Germany). DMEM F12 medium was procured from ThermoFisher Scientific (Waltham, MA, USA). Milli-Q water was freshly prepared by Millipore Milli-Q Biocell purification system. All other chemicals were of analytical quality. Materials used for NP synthesis, other reagents such as antibodies and buffers are mentioned together with the respective methods.
Cell Lines
A panel of breast cancer cell lines, which differ in their molecular characteristics and FolR1 status were used. MDA-MB-231, (claudin low, ER-, PR-, Her 2-), MDA-MB-468 (basal, ER-, PR-, Her 2-), MCF-7 (luminal A, ER+, PR+, Her 2-) and T-47D (luminal A, ER+, PR+, Her 2-) were cultured in RPMI 1640 supplemented with 10% (v/v) FBS and 100 units/mL penicillin/streptomycin). HEK293 cells used for analyses of lipopolysaccharide (LPS)/Toll like receptor (TLR4)-induced NF-κB activation, were cultured in a similar way in DMEM but additionally supplemented with 2 mM L-glutamine and 2 mM MEM non-essential amino acids. All cell lines were purchased from ATCC and were routinely subjected to mycoplasma testing.
Synthesis and Characterization of NP Variants
PEGylated PEBCA and PEHCA NPs were synthesized using a miniemulsion polymerization technique (Figure 1A). An oil phase (2.7 mL), containing 0.9 g of 2-ethylbutyl cyanoacrylate (EBCA), or 2-ethylhexyl cyanoacrylate (EHCA) (Cuantum Medical Cosmetics, Bellaterra, Spain) and the co-stabilizer Miglyol® 812 (1.1% (w/w), Cremer Oleo GmbH & Co. KG, Hamburg, Germany) was mixed with a water phase (6.5 mL) consisting of the non-ionic PEG stabilizers such as Brij® L23 (5 mM, Sigma-Aldrich), Kolliphor® HS 15 (6 mM, Sigma-Aldrich) or Pluronic F68 (2 mM, Sigma Aldrich) in 0.1 M HCl. NPs containing the mixture of Brij and Kolliphor were used in all studies, whereas NPs containing the mixture of Pluronic and Kolliphor were included in the complement activation studies only.
Compounds to be encapsulated (NR668,25 0.2% (w/w), or CBZ, 10% (w/w)) were added to the oil phase prior to mixing. Preparation of folate conjugated NPs include addition of 1,2-distearoyl-3-sn-glycerophosphoethanolamine coupled to PEG 2000, with folate in the end (DSPE-PEG 2000-folate; 0.6–2.2 mol % of total surfactant, Creative Enzymes, Shirley, NY, USA), to the aqueous solution prior to mixing. The aqueous phase was added to the oil phase and immediately sonicated for 3 min on ice (6 × 30 sec intervals, 60% amplitude, Branson Ultrasonics digital sonifier 450, USA). The solution was then rotated (15 rpm, SB3 rotator, Stuart, UK) at room temperature (RT) overnight before adjusting the pH to 5.0 using 1M NaOH and continuing the polymerization for further 5 h on rotation. The emulsions were extensively dialyzed (Spectra/Por dialysis membrane MWCO 100000 Da, Spectrum Labs, USA) against 1 mM HCl (pH 3.0). Loading of CBZ within PACA NPs was quantified by mass spectrometry analysis and encapsulation efficiency was determined as described earlier.10 It was observed that both PEBCA and PEHCA NPs obtained a high encapsulation efficiency of approximately 90% and 75% respectively, and drug loading of 10% and 8% respectively. The size (diameter; z-average), polydispersity index (PDI) and the zeta potential of the NPs were measured in 0.01 M phosphate buffer, pH 7.0 by dynamic light scattering using a Zetasizer Nano ZS (Malvern Instruments, Malvern, UK). The NP batches were generally found to be stable for at least 6 months when stored at 4°C in 1mM HCl (pH 3.0). All NP batches were used within 3.5 months after their synthesis for different biological experiments.
Measurement of Folate Content on NPs Using ICP-MS Analyses
As mentioned above, each folate molecule is attached at the distal end of DSPE-PEG 2000. Since DSPE contains one phosphate group and no other ingredients used for NP synthesis contain phosphor, we quantified the amount of folate on NPs as an indirect measurement of their phosphor content using inductively coupled plasma mass spectrometry (ICP-MS). All standard solutions and dilutions were prepared using ultra purified water (18.2 MΩ) from a OmniaTap 6 system (Stakpure, Germany) and 65% HNO3 (Merck Millipore, Germany, purified using a Savillex DST-1000 Acid Purification System, USA). Standards for calibration curves were prepared in 5% HNO3 (v/v) from stock solutions from Inorganic Ventures (USA). Indium (In) was used as internal standard. Metal free polypropylene tubes (Labcon, USA) were used for all standards and samples. Particle suspensions were digested with HNO3 in quartz tubes at 250°C (hold time 10 min) in a UltraWAVE microwave oven from Milestone (Italy) and diluted with water upon analysis.
All elements were measured by using Agilent 8800 Triple Quadrupole ICP-MS system (Agilent Technologies, USA) with a SPS4 autosampler and a standard sample introduction system (Micro Mist glass concentric nebulizer, quartz double pass spray chamber, quartz torch with 2.5 mm inner diameter and standard nickel cones). He and O2 modes were used in this method. The following system parameters were used: RF Power 1550 W; carrier gas flow 1.05 L/min; He flow rate 4.3 mL/min; O2 flow rate was 30% of the helium flow rate; nebulizer pump 0.1 rps; sample depth 8.0 mm; cell tuning mode He/O2; S/C temp 2°C; scan type MS/MS; replicate/peak pattern/sweeps 4/3/30. Using these setting the limit of quantification (LOQ) was 1 ng/mL.
LPS Analyses of NPs
To detect potential LPS contaminations, an NF-κB-luc TLR4 reporter gene assay was performed as described previously.26,27 Briefly, HEK293 cells (culture passage (5–15)) were seeded at a density of 1.5 × 10⁵ in 500 mL per well in DMEM medium. The next day, the cells were transfected with Lipofectamine 2000 reagent (Thermo Fischer Scientific) according to the manufacturer’s instructions. 500 ng of DNA and 1.5 µL of Lipofectamine 2000 reagent were diluted in 25 µL of Opti-MEM (Gibco). In this assay, an NF-kB Luciferase reporter (kindly provided by Min Li-Weber and cloned into pGL3Neo by the Horejs-Hoeck group) and a TLR4 receptor mix were used in a ratio of 4:1. The TLR4 receptor mix consists of expression plasmids for TLR4 (in pCDNA3), CD14 (in pCDNA3) and MD2 (in pEFBOS) (kind gifts from Andrei Medvedev and Douglas Golenbock) in a ratio of 3:1:1. Both suspensions were pooled into one tube and incubated for 10 min at RT before being added dropwise to the wells. 24 h later, the cells were treated with defined concentrations of LPS or with 1 µg/mL of different NPs and incubated overnight. After 20 h of induction, cells were lysed in 100 µL of lysis buffer (100 mM potassium phosphate, 0.1% Triton X-100, 1 mM DTT) after discarding supernatants. The lysates were then transferred to white polystyrene flat-bottom 96 well plates in duplicates. Luciferase activity was measured in a Tecan Infinite 200 Pro microplate reader, upon addition of 50 µL of luciferase substrate by an automated dispenser.
Complement Activation Studies
Human blood was collected from healthy consented donors in 9 mL VACITTE® Tube with no additive (Greiner Bio-One International GmbH, Germany) at Newcastle University under the approval of the Faculty of Medical Sciences Ethics Committee of Newcastle University. Only age and gender were made available to the investigators. Details for blood clotting, serum preparation and validation of complement pathways were as before.28,29 Serum was aliquoted in sterile low retention 1.5 mL microcentrifuge tubes (ThermoFisher Scientific, UK) and stored at –80°C. For complement assays, serum was thawed at 37°C in a water bath prior to incubation with NPs. For determination of complement activation undiluted serum was mixed with NPs (volume ratio of 4:1) and samples were incubated in a shaking water bath at 37°C for 30 min. Reactions were stopped by addition of 950 µL ice-cold 25 mM EDTA. Following NP removal by centrifugation, sC5b-9 and Bb levels were measured using respective ELISA kits (Quidel, USA) as detailed previously.29,30 Quantification of sC5b-9 and Bb was based on construction of standard curves with standard complement activation products supplied with the ELISA kits. For positive control, activated Zymosan (0.25 mg/mL serum) was used. As an internal negative control, EDTA (25 mM final concentration) was used. In some experiments, serum was pre-treated with EGTA/Mg2+ (10 mM/2.5 mM) to differentiate between NP-mediated complement activation through calcium-sensitive and alternative pathways.30
Cellular Uptake Assay
PEBCA/PEHCA NP variants loaded with the fluorescent dye, NR668 were used for the cellular uptake studies. Briefly, cells were seeded in 12 well plates at a density of 2 × 10⁵ cells/well, followed by incubation with different PEBCA/PEHCA NPs (loaded with NR668) for 4 h at 37°C. Alternatively, incubations were also done with NPs suspended in folate free RPMI media, whenever needed. Similar sets were maintained as controls incubated at 4°C. Cells were then harvested using Accutase® Cell Detachment Solution (Sigma-Aldrich, St Louis, MO), washed with phosphate buffered saline (PBS; pH 7.2 containing 0.1% bovine serum albumin (BSA) and resuspended in the same buffer. Fluorescence intensity of cells was measured at an excitation of 561 nm using a yellow green laser and detected in the PE-Texas red channel of BD® LSR II Flow Cytometer. The NP variants had different fluorescence intensities which were normalized. Data are represented as mean fluorescence intensity (MFI) of at least 10,000 events recorded per sample. Data acquisition was done using BD FACSDiva™ software.
Cell Viability Assays
Cell viability was evaluated by the MTT assay (measures metabolic activity) and [3H]thymidine incorporation assay (measures DNA synthesis).
MTT Assay
Cells were seeded at a density of 1×10⁴ cells/well of 96 well plates (200 µL medium) and incubated for another 24 h before starting the treatment. CBZ loaded PEBCA/PEHCA NP variants or free CBZ were added to cells with respect to increasing concentrations of CBZ (0.01–100 nM) and the cells were further incubated for 72 h. The medium was removed and followed by addition of 100 µL MTT solution (0.25 mg/mL in serum free, phenol red free medium) and incubated for 3 h at 37 °C. Afterwards, the formazan crystals formed were dissolved in DMSO with 0.5% ammonia solution. Absorbance was read at 570 nm against 650 nm reference wavelength using Synergy2 microplate reader (Biosys Ltd, Essex, UK).
[3H]thymidine Incorporation Assay
Cell viability was also measured by [3H] thymidine incorporation assay as described previously.31 Cells were seeded at a density of 5 × 10⁴ cells/well of 24 well plates (500 µL medium) and incubated for another 24 h before starting the treatment. CBZ loaded PEBCA/PEHCA NP variants or free CBZ were added to cells with respect to increasing concentrations of CBZ (0.1–30 nM) and the incubation was continued for 24 h. Media were removed, followed by addition of 3 μg/mL of [3H]thymidine (in serum free media; 75 μCi/mL) and incubated for 30 min at 37 °C. This solution was removed and 5% TCA (800 µL/well) was added to the wells and left for 10 min at room temperature to precipitate nucleic acids and proteins. After one more wash with the TCA solution, 0.1 M KOH (200 µL) was added to the wells followed by incubation for 15 min at room temperature in order to solubilize the precipitated nucleic acids and proteins. The solution was then removed and transferred to scintillation vials containing 3 mL of scintillation fluid (Perkin Elmer, USA), mixed well and the radioactivity was measured using a scintillation counter (Tri-Carb 2100TR, Packard Bioscience, USA).
Binding of 125I-Labeled Folate Binding Protein (FBP) to Folate-Conjugated NPs
FBP (from bovine milk, F0504-1mg) was purchased from Sigma-Aldrich. FBP was 125I-labeled by using Pierce Iodination Tubes (cat. No 28601, Thermo Fisher Scientific, Rockford, IL, USA) according to the protocol from the manufacturer. FBP binding to the PACA NPs was measured by adding 125I-FBP (final conc. 30 nM (=780 ng/mL; ~23,000 cpm/ng) to PACA NPs (1 mg/mL; 200 µL) in PBS (10 mM phosphate, 137 mM NaCl, 2.7 mM KCl) or 50% FBS in PBS and incubated at 37°C for 2 h. PACA NPs were pelleted by high speed centrifugation (15,000 rpm, 30 min), washed two times with PBS and then the radioactivity of 125I-FBP in NP fraction and supernatant was measured using a Hidex Automatic Gamma Counter (Hidex).
Fluorescence Microscopy
Excised HBCx39 tumor tissue from mice pre-treated for 48 h with NR668 loaded PEBCA NPs was cryosectioned at a thickness of 4 µm and kept at −80°C. Two days prior to imaging, they were thawed for 15 min at RT before they were fixed in 4% paraformaldehyde for 30 min and permeabilized for 2 min in PBS containing 0.1% Triton X-100 at RT. They were then blocked in PBS containing 5% v/v FBS for 1 h and stained with a primary rat anti-CD31 antibody (Thermo Fisher Scientific, clone TLD-3A12; dilution 1:50) overnight at 4°C. The following day, the sections were washed 3 × 5 min in PBS and incubated with a secondary anti-rat Alexa Fluor 647 antibody (Life Technologies). Following another round of washing 3 × 5 min in PBS, they were mounted with ProLong Gold Anitfade Mountant with DAPI (Thermo Fisher Scientific) and incubated overnight at 4°C. The stained samples were then examined using a VS200 Research Slide Scanner fluorescence microscope with VS200 DESKTOP ASW 3.2 software (Olympus).
Immunohistochemistry
Tumor tissues were excised and fixed in formalin. They were then embedded in paraffin, sectioned at a thickness of 5 µm and kept at 4°C until use. Prior to staining, the sections were deparaffinized using Neo-clear (VWR, Radnor, PA, USA), followed by heat-induced epitope retrieval by immersing the slides in Tris-EDTA buffer (pH 9; 10 mM Tris and 1 mM EDTA) in a water bath for 20 min at 100 °C. The slides were then incubated with hydrogen peroxide solution provided with HRP/DAB (horseradish-peroxidase/3,3′-Diaminobenzidine) micro-polymer detection kit (ab236469, Abcam, Cambridge, CB, UK) for 10 min to block the endogenous peroxidase activity. Afterwards, the sections were washed in Tris-buffered saline (TBS; pH 7.6; 50 mM Tris-Cl, 150 mM NaCl) and blocking was performed according to manufacturer’s protocol using protein block provided with the kit. This was followed by staining with the primary anti-FOLR1 antibody (1:100; ab230469, Abcam, Cambridge, UK) diluted in TBS containing 1% BSA for 60 min. The primary antibodies were detected as per manufacturer’s protocol using DAB chromogen solution provided with the kit. Counterstaining of the sections was performed using hematoxylin (Sigma-Aldrich, Germany) followed by quick immersion in 37 mM ammonium hydroxide solution (Sigma-Aldrich). The sections were then mounted using Neo-mount (VWR, Radnor, PA, USA) and were digitized using Olympus VS200 Slide Scanner (Tokyo, Japan), using a 20X objective. Images were analyzed using QuPath-0.3 software (open source).
In vivo Experiments
All animal experiments were performed with prior approval from Norwegian Animal Research Authority (FOTS; approval no. 28224) and were conducted according to the regulations of Federation of European Laboratory Animal Science Association (FELASA) and ARRIVE guidelines. Female athymic Foxn1nu nude mice (N = 106, age: 6–8 weeks, weight: 20–25 g) were acquired from the Department of Comparative Medicine, Oslo University Hospital, Norway. They were kept under pathogen-free conditions, at constant temperature (22 ± 1°C) and humidity (62 ± 5%); 15 air changes/h and a 12 h light/dark cycle. Food and water were supplied ad libitum. Cardboard houses and paper were provided within the cages for environmental stimulation. Mice were ear marked before start of any experiment. Maximum 8 mice were housed in each cage and different treatment groups were mixed within the cages. Mice implanted with tumors were supplemented with 17-β-estradiol at a concentration of 4 mg/l, mixed with drinking water. In any procedures where anesthesia was required, 4% sevofluran was used along with 3 liters of nitrous oxide and 1 liter oxygen per min and directed to the mice using inhalation masks. Mice were comforted with gentle heating pad and suitable eye ointment during anesthesia. Mice were sacrificed by cervical dislocation at the experimental or humane endpoint. For the studies included in this article, humane endpoint is the time point when tumors reach 15 mm diameter or if the animals show any severe clinical or behavioral changes (signs of suffering) according to standard criteria.
Implantation of PDX Tumors
MAS98.12 triple negative PDX model was established in-house as described previously.32 HBCx39 triple negative PDX model was established at the Institute Curie (Paris, France)33 and was obtained through collaboration with Dr. Elisabetta Marangoni. The xenografts were maintained by serial passage in female athymic nude mice. Athymic Nude Foxn1nu mice were implanted bilateral tumors into the second mammary fat pad. Briefly, tumor pieces for implantation were prepared by gently chopping a freshly excised tumor from mice. Mice used for tumor implantation were given anesthesia as mentioned above, directed using inhalation masks. The ventral skin was disinfected by gently wiping with 70% ethanol. A small incision was made on the skin above the sternum and a single piece of tumor tissue (1–2 mm3 each) was implanted into both mammary fat pads. The incision was closed with surgical glue and when necessary, the wound was additionally sewed with 1–2 stitches. Animals were closely monitored for the wound closure and their general health for the next 3–4 days. Tumor diameter was measured using digital calipers and tumor volume was calculated using the formula 0.5 × length × width2. When tumors reached approximately 5–6 mm in diameter, mice were randomly assigned to different treatment groups.
In vivo Imaging
Biodistribution studies involved in vivo imaging of mice administered with PEBCA/PEHCA NP variants loaded with the fluorescent dye NR668 in both MAS98.12 and HBCx39 tumor bearing athymic nude mice. Before injection of fluorescent NPs, mice were fed with low fluorescent diet (2016S, Envigo, Madison, WI, USA) for one week. Imaging was performed using an IVIS® Spectrum in vivo imaging system (Perkin Elmer). Briefly, mice were administered (i.v. injection) single dose of NR668 loaded PEBCA/PEHCA NPs (80 mg/kg b.wt of NPs). Mice were subjected to whole body imaging prior to sacrifice followed by imaging of organs (such as liver, spleen, lymph nodes, heart and kidneys) and tumors after sacrifice, at 4 h, 24 h and 48 h after injections. Imaging was performed at an excitation/emission wavelength pair of 535/640 nm which provides the best signal-to-noise ratio. Relative signal intensities of the organs were calculated using Living Image software (Perkin Elmer), as radiant efficiency (Emission light [photons/s/cm2/str] / Excitation light [μW/cm2]×10) per pixel of the region of interest, which was drawn around the image of respective organ.
Treatment Efficacy Study in vivo
Nude mice bearing HBCx39 PDX tumors were either treated with saline, empty PEBCA/PEHCA variants, CBZ loaded PEBCA/PEHCA variants or free CBZ. First dose was equivalent to 20 mg/kg b.wt. of CBZ, which was administered to mice by diluting the NPs in saline to obtain a concentration of 2 mg/mL and 200–250 µL of the solution was injected intravenously (10 µL/g of mice). Comparable concentrations of empty NPs were administered for the NP control groups in a similar way. Free CBZ was prepared from a stock solution of 40 mg/mL (in Polysorbate 80), which was further diluted with 13% (v/v) ethanol to obtain a sub-stock of 10 mg/mL. This was diluted further in saline to obtain a working solution of 2 mg/mL which was then used for i.v. injection. Similarly, a second dose (equivalent to 10 mg/kg b.wt. of CBZ) was administered around 3 weeks after first treatment using working stock solution equivalent to 1 mg/mL of CBZ or comparable concentrations of empty NPs. Body weight and tumor diameter were measured on Day 0 of treatment and continued twice a week, till the end of experiment. Relative tumor volume was calculated with respect to the tumor volume on Day 0 of treatment.
Analysis of Tumor Associated Immune Cells
Tumors were collected either at an early time point of 96 h after a single treatment (20 mg/kg b.wt with respect to CBZ) or at the end of the efficacy study mentioned above. Individual tumors were minced into small pieces and washed once with wash buffer (PBS (pH 7.4) containing 0.2% BSA and 1 mM EDTA). The tissue pieces were collected in gentleMACS C tubes (Miltenyi Biotec) and dissociated using gentleMACSTM tissue dissociator for 37 sec, using the pre-set program “m_imp Tumor 04”. This mixture was then incubated in 10 mL with an enzyme cocktail containing 2 mg/mL collagenase type IV (Sigma Aldrich, MO, United States) and 100 µg/mL of DNase I (Sigma-Aldrich, Germany; in DMEM F12 medium containing 2 mg/mL BSA) with gentle mixing at 37°C (5% CO2) for 40–50 min. The tubes were intermittently mixed using the dissociator 2–3 times during the incubation, with minimum 15 min intervals, to accelerate tissue dissociation into single cells. Afterwards, the cell suspension was diluted two times using wash buffer and was filtered using 70 µm nylon filter. The filtrate was centrifuged at 1000 rpm for 5 min and the supernatant was discarded. If the pellet appears reddish because of the presence of red blood cells (RBCs), Ammonium-Chloride-Potassium lysis buffer (ACK lysis buffer, GIBCO) was used; 0.5–1 mL lysis buffer was added to the pellet and left for 3 min at room temperature. This mixture was resuspended in 10 mL wash buffer and centrifuged to obtain a clean pellet which was frozen down using freezing media (DMEM F12+20% FBS+10%DMSO) and stored at −80°C. Maximum of 10 million cells suspended in 1.5 mL freezing media was frozen in single vial. Samples were analyzed by multicolor flow cytometry within a week of storage. Alternatively, samples were freshly stained for the early time point analysis.
All staining procedures were done at 4°C and staining volumes were 100 µL/sample. Two sets of antibody cocktails were used: Set 1 includes all antibodies meant for cell surface staining (BUV395-CD45, BUV496-F4/80, BV605-CD11c, PE-Cy7-Ly6C, APC-Cy7-Ly6G, BUV737-MHC II, AF700-CD206) and Set 2 consists of all antibodies meant for intracellular staining (BV711-IFN-γ, AF488-TNF-α, PE-Dazzle594-IL-10, APC-arginase-1). Antibody details and working dilutions are described in the (Table S1). Tumor samples were thawed using 20% DMEM F12 medium and washed once with wash buffer. The cell pellet was first stained with the live/dead dye, Pacific Orange (Invitrogen, Cat no. P30253; stock diluted in PBS, 0.4 µg/mL), for 15 min. Samples were washed once with PBS and stained with Set 1 antibody cocktail suspended in Brilliant stain buffer (BD Biosciences) diluted with wash buffer (1:1) and incubated for 30 min in the dark at 4°C. Cells were washed once with wash buffer, fixed and permeabilized by incubation with Fixation/Permeabilization buffer (BD Biosciences; prepared as per the instructions mentioned in the kit) for 15 min. Cells were spun down and further stained with Set 2 antibody cocktail suspended in Perm/Wash™ Buffer (BD Biosciences) and incubated for 30 min in the dark at 4°C. Cells were washed again using wash buffer and resuspended in the same buffer. Samples were transferred to flow cytometry tubes with filter caps and analyzed using BD FACSymphony™ A5. Data acquisition was done using FACSDiva software and data analysis was performed using Flowjo software (FlowJo™ v10.8). Defined gating strategies were used to distinguish immune cells from tumor cells and to identify different immune cell- and other subsets.
Statistical Analysis
Statistical analysis was performed using GraphPad Prism v7 (GraphPad Software, La Jolla, California, USA). Anti-tumor efficacy was evaluated by calculating the area under the curve for each tumor starting from Day 0 of treatment till the end of experiment and the mean values of the groups were compared by t-test using Welch unequal variance. Analyses of immune cell populations across treatment groups were done by one-way ANOVA followed by Tukey-Kramer multiple comparison test. Unpaired t-test with Welch correction was also performed for analyzing some populations, wherever needed (specifically mentioned in respective figure legends), and p-values < 0.05 were considered statistically significant.
Results and Discussion
Physiochemical Characterization of NPs
The physiochemical properties of the NPs used are given in Figure 1B. PEBCA and PEHCA variants are structurally similar with similar PEGylation but differ in the alkyl side chain of the monomer (Figures 1A and S1). All NPs exhibit a size range of 100–160 nm with PDI less than 0.27 in PBS. The folate conjugated NPs showed a slightly more negative surface charge (−6.5- to −7.6) compared with the unconjugated variants (−1.6 to −3.1). The folate content of the NPs was quantified by using ICP-MS analyses of phosphor, since the folate moiety was bound to a lipid containing the only P atom in the NPs. It should be noted that the PEBCA NPs containing folate are abbreviated PEBCA-F and those without folate are abbreviated PEBCA (similarly for the PEHCA NPs). In addition to the NPs listed in Figure 1B, we also tested some NPs containing different amounts of folate; information about other batches than those listed in Figure 1B are described in the legends to the figures where these NPs were used.
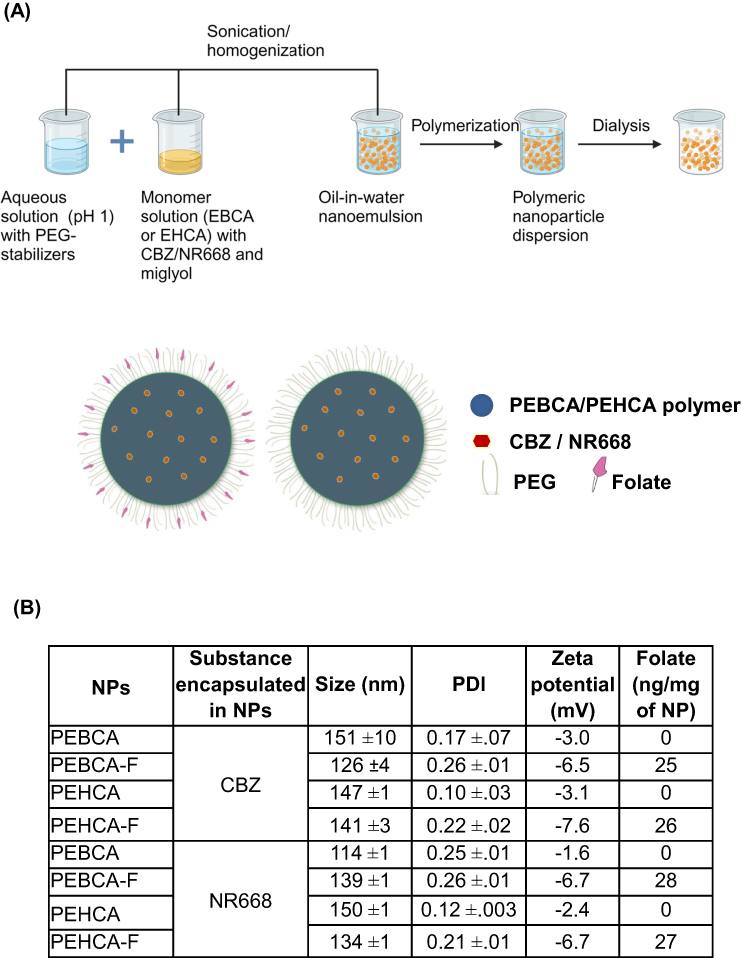 |
Figure 1 Schematic illustration and physicochemical properties of NPs. (A) Scheme of the production protocol for PACA NPs by nanoemulsion, and drawings of PEBCA or PEHCA NPs with and without folate conjugation. Both NPs are PEGylated and loaded with either CBZ or NR668 for different studies. The PEBCA or PEHCA polymer forms the hydrophobic core where CBZ/NR668 is encapsulated, and the NPs have PEG stabilizers at the surface. For folate decorated NPs, the folate ligands are attached to the distal end of DSPE-PEG 2000 chain. (B) Size, PDI and zeta potential of the NPs were determined by Zetasizer Nano ZS. The size and PDI with their respective standard errors were calculated on the basis of three independent experiments performed every month over the experimental period. Zeta potential was measured on the freshly prepared NPs. Folate was quantified by ICP-MS. |
LPS and Complement Activation Analyses
LPS is an integral component of the outer cell wall of Gram-negative bacteria. Because LPS is ubiquitously expressed, highly heat-stable, and can strongly affect biological processes,34,35 testing NP suspensions for the presence of residual LPS is essential to ensure the quality of all used NP preparations. The luciferase-based NF-κB/TLR4 reporter gene assay is a highly sensitive method to detect low amounts of LPS contamination and to even identify masked endotoxin.27 As shown in Figure S2, stimulation of transfected HEK293 cells with LPS concentrations ranging from 0.001 ng/mL to 100 ng/mL results in a dose dependent increase of NF-κB reporter gene activity, while none of the tested NP batches was able to induce NF-κB activity when applied at a dose of 1 µg/mL. This clearly shows that all used NP formulations are free of residual LPS.
The results in Figure 2A show the extent of NP-mediated activation of the terminal complement pathway (50 µg NPs/mL of serum) as a measure of the soluble (fluid-phase) S protein (vitronectin)-bound C5b-9 over the background level. Both Pluronic-coated PEBCA and PEHCA nanoparticles trigger complement activation. These observations are in line with the established ability of Pluronic F68 to trigger complement activation in human serum.36 In order to gain further insight into the pathway of complement activation, NP-mediated serum rises of Bb (a split-product of complement activation through the alternative pathway30 was evaluated both in the absence and the presence of EGTA/Mg2+ (Figure 2B). With Pluronic-coated PEBCA NPs, rises in serum Bb levels were comparable both in the absence and the presence of EGTA/Mg2+. This suggests complement activation is predominantly through the alternative pathway.30 The Pluronic-coated PEHCA NPs also elevated serum Bb levels, but Bb levels were significantly lower when EGTA/Mg2+ was present. This indicates the involvement of calcium-sensitive and alternative pathways in complement activation where a small fraction of Bb is generated through the amplification loop of the alternative pathway.30 Collectively, these observations suggest that Pluronic-coated PEBCA and PEHCA NPs could serve as positive controls for comparing complement activation with alternative coatings.
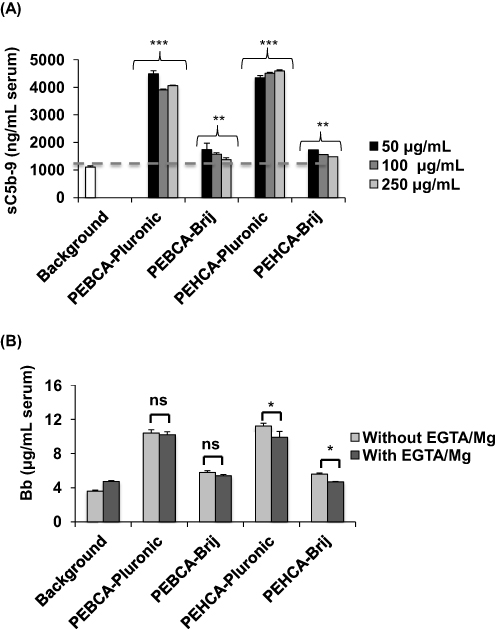 |
Figure 2 Complement activation by NPs. (A) The effect of NP concentration on human serum complement activation as a measure of the soluble membrane attack complex (sC5b-9) formation. Bars represent mean ± SD (n = 3) and the p values (unpaired, two-sided) are compared with serum background. Activated zymosan (0.25 mg/mL serum) was used as positive control, yielding 11,457 ± 2908 ng/mL sC5b-9. (B) NP-mediated complement activation as a measure of liberated split-product Bb. In all panels, the final NP concentration in the incubation was 50 µg/mL. Bars show mean ± SD (n =3). Activated zymosan (0.25 mg/mL serum) was used as positive control, yielding 43.05 ± 3.05 µg/mL Bb. All p values (unpaired, two-sided) are compared between indicated groups. For all incubations with and without EGTA/Mg2+ p values were also compared with the respective serum background incubation (p < 0.05 for all incubations except PEHCA-Brij with EGTA/Mg2+, where p > 0.05). The NP batches used have similar size and zeta potential as the batches shown in Figure 1B. *p < 0.05, **p < 0.01, ***p < 0.001. Abbreviation: ns, non-significant. |
In contrast to Pluronic-coated NPs, Brij coating has a mild effect on complement activation as reflected in small rises in serum fluid-phase levels of both sC5b-9 and Bb. Similar to Pluronic-coated PEBCA NPs, complement activation by Brij-coated PEBCA NPs is predominantly due to the alternative pathway, since slight rises in serum Bb levels are comparable both in the absence and presence of EGTA/Mg2+ (Figure 2B). On the other hand, with Brij-coated PEHCA NPs complement activation is predominantly due to calcium-sensitive pathways, since Bb liberation is halted in the presence EGTA/Mg2+. These differences might suggest a different arrangement for surface adsorbed Brij molecules between PEBCA and PEHCA NPs, which in turn could affect the type and extent of serum protein binding.28 Notwithstanding, these observations confer Brij as a better stabilizing agent in minimizing complement activation by NPs. Compared with Pluronic-coated NPs, minor complement responses with Brij-coated NPs could be due to efficient surface deposition of the complement regulators such as factor H and factor I,30 but this was not investigated.
PEBCA and PEHCA NP Variants Showed Dissimilar Cellular Uptake
The uptake of PEBCA and PEHCA variants were assessed by flow cytometry in a panel of breast cancer cell lines which differ in the molecular characteristics and FR expression on their surface (Figure S3). NR668 loaded NPs were used for the study and the uptake was measured after incubation for 4 h. Intracellular accumulation of these NPs was quantitatively evaluated as a measurement of NR668 fluorescence of the cells during the initial hours of incubation in media with or without folate supplementation. As shown in Figure 3A, PEBCA and PEHCA variants showed different levels of uptake in a cell line-dependent manner. The two PEHCA NPs gave a similar uptake pattern in media with or without folate, whereas the uptake of the PEBCA NPs varied with the media used. Surprisingly, folate conjugated variants did not show an enhanced uptake in any of the cell lines, irrespective of their FR status. This demonstrates that folate conjugation did not give an enhanced receptor mediated endocytosis of such NPs but resulted in a reduced uptake. We speculate that the folate moieties are not sufficiently exposed on the surface, as supported by Figure S4, showing lack of binding of folate NPs to radiolabeled FBP, and also by Figure 3B which shows that surplus amounts of free folate supplementation in the medium did not affect the uptake of these NPs. In agreement with these data is a similar study where the authors investigated the surface availability of conjugated folate molecules on PEG-ylated PLGA-NPs and found that 80% of the conjugated folate moieties apparently were buried in the NP core due to hydrophobic interactions and not available on the NP surface.37 For some unknown reason, incubation in folate free media caused higher intracellular accumulation of unconjugated PEBCA NPs than other NP variants in MDA-MB-231 and MDA-MB-468 cells. The control samples incubated at 4°C showed only negligible signals indicating that the NP variants do not bind to the cell surface. However, the difference in the uptake pattern of the NP variants was not reflected in the cytotoxicity studies, where they showed similar toxicity after long term incubation with the cells (Figure 4).
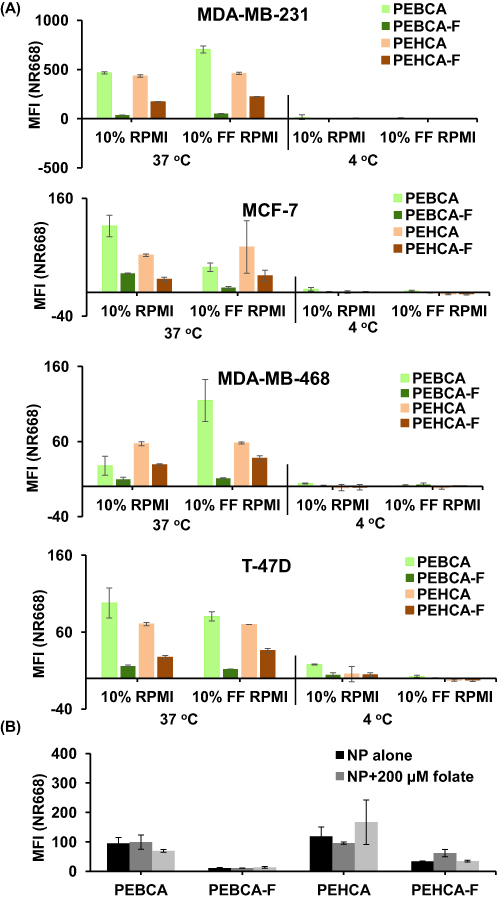 |
Figure 3 PACA NP variants exhibit different levels of cellular internalization. (A) Association of NP variants with breast cancer cells after 4 h incubation at 37 °C of cells with different NPs loaded with NR668 (10 µg/mL in regular 10% RPMI or folate free (FF) 10% RPMI), and measured as cell fluorescence by flow cytometry. Similar set up incubated at 4 °C was used as controls to distinguish between extracellular binding and intracellular accumulation of NPs. The measurements were normalized to those of untreated control. Values are mean fluorescence intensities (MFI) ± SD. (B) Association of NR668 loaded NP variants with T-47D cells after 4 h incubation (10 µg/mL) at 37 °C in FF RPMI supplemented with high concentration of free folate, measured by flow cytometry. Values are mean fluorescence intensities ± SD; data shown represent one out of three independent experiments. |
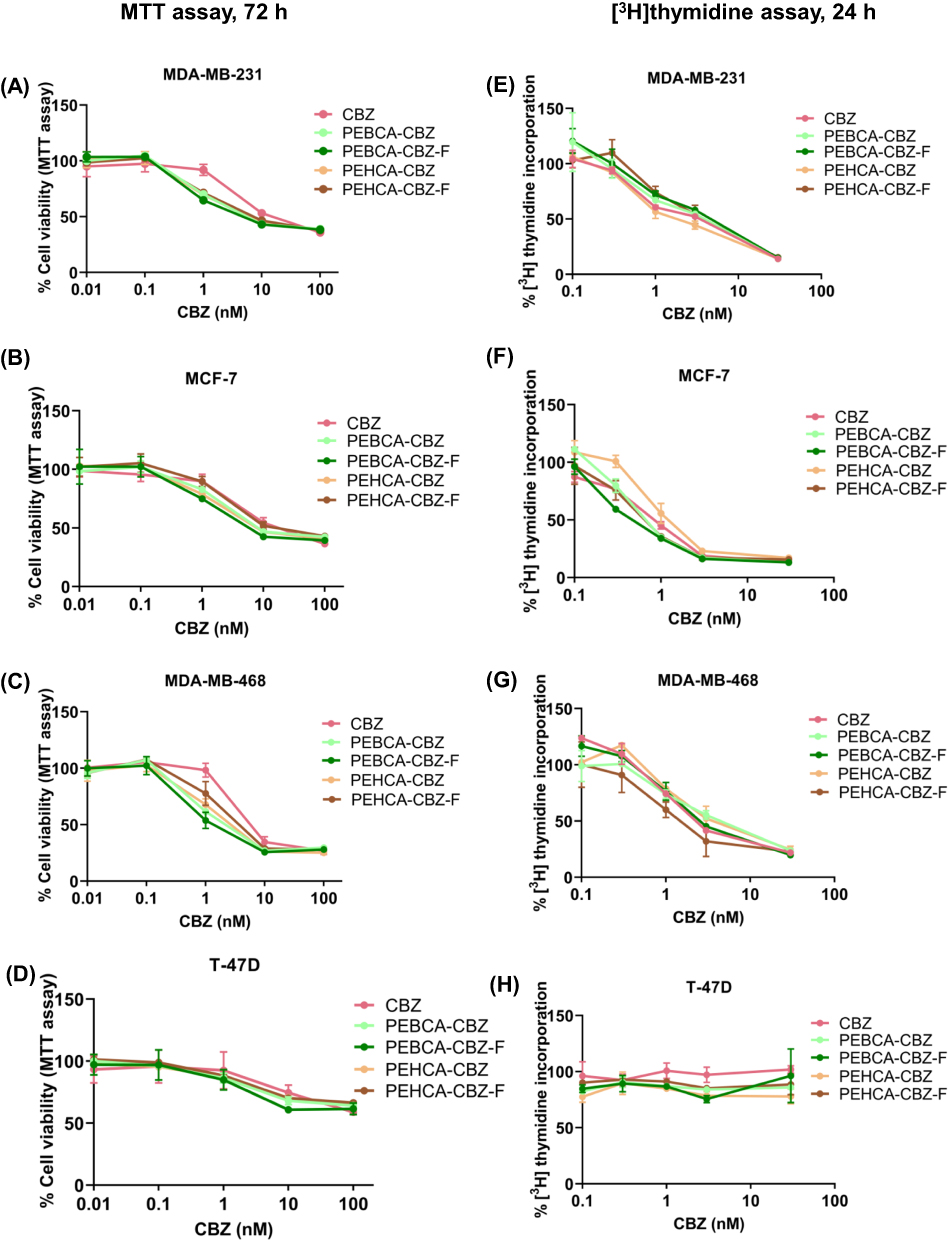 |
Figure 4 Toxicity induced by CBZ-loaded PACA-NP variants in breast cancer cell lines. (A–D) Cell viability measured by MTT assay after exposing the cells to increasing concentration of CBZ-containing NP variants for 72 h at 37 °C. (E–H) Cell viability measured by [3H]thymidine incorporation assay after exposing the cells to increasing concentration of CBZ-containing NP variants for 24 h at 37 °C. Values were expressed as mean ± SD. Experiments were repeated three times. Data shown represent one out of three independent experiments. |
CBZ Loaded PEBCA and PEHCA NP Variants Showed Similar Pattern of Cytotoxicity
Cytotoxicity of CBZ loaded NP variants were measured by MTT assay and [3H]thymidine incorporation assay. MTT assay measurements were performed after incubating the cells with free CBZ or NP variants at a concentration range of 0–100 nM (equivalent concentrations of CBZ) for 72 h. As shown in Figure 4A–D, free CBZ as well as CBZ loaded NP variants reduced cell viability in a dose-dependent and cell-dependent manner. MDA-MB-468 was the most sensitive and T-47D was the least sensitive cell line. Importantly, all NP variants showed comparable cytotoxicity as free CBZ. Similar results have been previously published for PEBCA NPs by our group.12 The current result also implicates that slower or faster cellular uptake during the early hours did not significantly affect the cytotoxic effects caused by any of these NP variants after a longer incubation time. It should also be noted that the cytotoxicity caused by folate conjugated variants was not different from their unconjugated counterparts. This demonstrates that they do not show any targeting through FolR in 2D cell culture, and also proves that the slower uptake not significantly hamper the biological effects.
To directly measure the effect of the different NPs on DNA synthesis we also measured incorporation of [3H]thymidine. Results from the [3H]thymidine incorporation assay (using 0–30 nM equivalent concentrations of CBZ) after treatment for 24 h also showed similar toxicity for CBZ and all of the NP variants (Figure 4E–H). But differing from the MTT results, the MCF-7 cell line showed higher sensitivity than the others, while T-47D still remained least sensitive. When comparing these methods, MCF-7 might be more susceptible to immediate effects of CBZ induced cell arrest while MDA-MB-468 might be more affected after longer incubations. This might be a general response to taxanes in these cell lines, as we previously have seen similar effects after treatment with paclitaxel loaded lipid nanocapsules.31
PEBCA and PEHCA NP Variants Showed Similar Biodistribution in Mice
Biodistribution of PEBCA and PEHCA variants were studied by injecting NR668 loaded NPs in mice bearing MAS98.12 tumors and subsequent ex vivo imaging of organs after 4, 24 and 48 h, followed by quantification of fluorescence as mean radiant efficiency of region of interest in selected organs. As shown in Figure 5Ai–iii, PEBCA and PEHCA NPs exhibit similar biodistribution patterns in mice with the MAS98.12 PDX. The uptake was much higher in liver than in the other tissues, and the data show only minor changes for the samples analyzed 4, 24 and 48 h post injection.
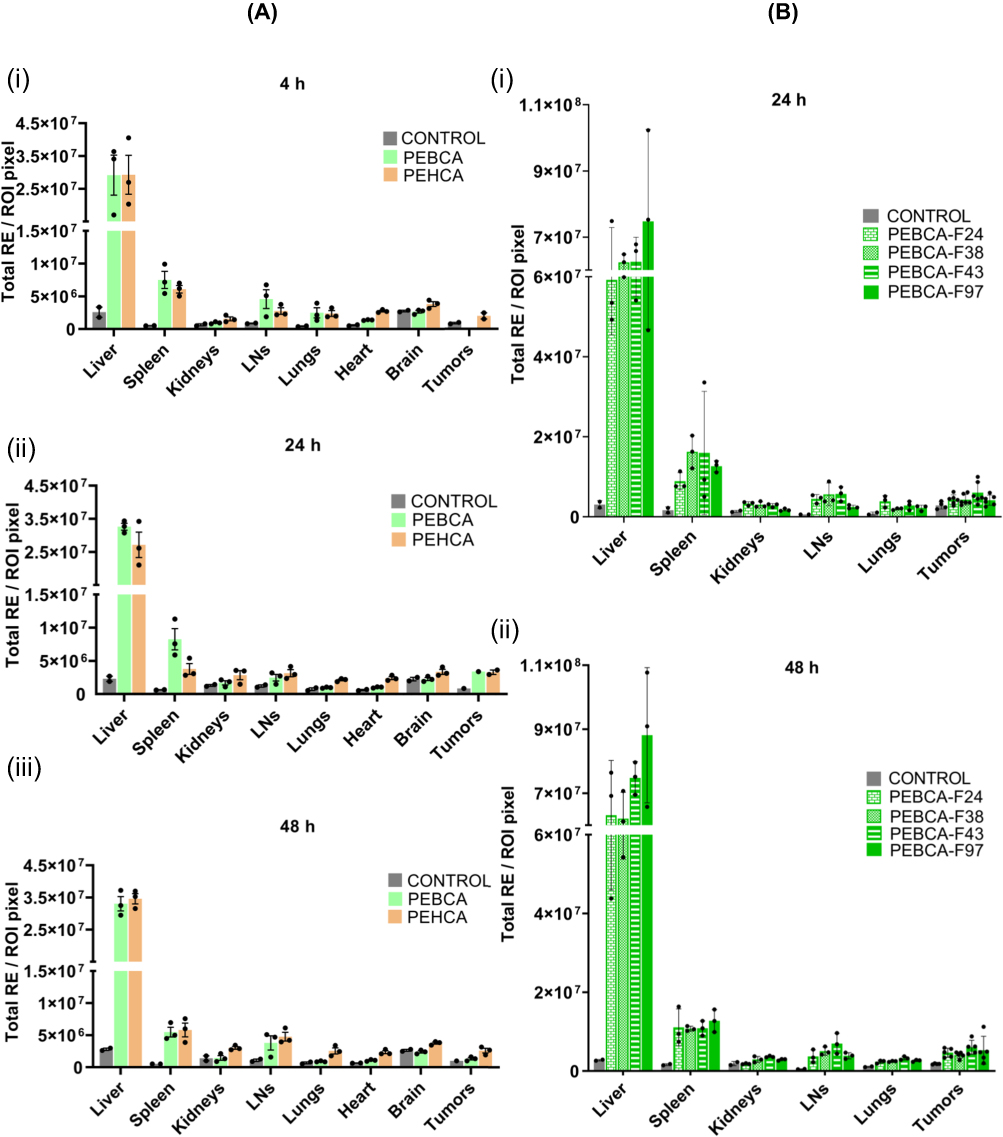 |
Figure 5 Biodistribution of PEBCA or PEHCA NP variants. NPs were loaded with NR668 and the experiments were performed in athymic nude mice. (Ai–iii) Mice bearing MAS98.12 PDX tumors were treated with NPs (without folate conjugation). Organs and tumors were collected at different time points (4 h, 24 h, 48 h, N=2 for control and N=3 for treated groups per time point) after i.v. administration. (Bi–ii) Mice bearing HBCx39 tumors were treated with PEBCA NPs conjugated with different amounts of folate on their surface. NPs were labelled as PEBCA-FX, where X represents ng folate per mg of NPs. Organs and tumors were collected after 24 h and 48 h (N=2 for control and N=3 for treated groups) after i.v. administration. Fluorescence of the tissues was quantified using IVIS® Spectrum in vivo imaging system. Values were expressed as radian efficiency per region of interest ± SD. Abbreviation: LNs, lymph nodes. |
In addition, NR668 loaded PEBCA NPs, conjugated with different amounts of folate on their surface, were used to study their biodistribution in HBCx39 tumor bearing mice. HBCx39 tumors possess higher expression of FolR than MAS98.12 tumors (Figure S5), which was the rationale for choosing HBCx39 for this study. Mice were injected with the NPs followed by ex vivo imaging of organs after 24 h and 48 h. As shown in Figure 5B, all four variant NPs showed a similar profile for all organs studied, indicating that up to 4-fold increase in folate conjugation do not result in any significant increase in NP accumulation within the tumors or other organs. The biodistribution profile of the PEBCA and PEHCA NPs here studied all show a similar biodistribution as previously reported with PEBCA NPs.10
Intra-Tumoral Distribution of PEBCA NPs
Tumor vasculature plays a major role in the accumulation of NPs. In order to investigate the vascularization in HBCx39 tumors and the distribution of NPs within the tumor, mice bearing HBCx39 tumors were treated with NR668 loaded PEBCA NPs. Tumors excised after 48 h were sectioned, stained for the endothelial marker CD31 and imaged by fluorescence microscopy. As shown in Figure 6, the HBCx39 tumor appears to be highly vascularized and most of the NPs were as expected observed in proximity to endothelial cells. A few of the NPs could also be seen associated with the tumor cells. One may speculate that the drug-loaded NPs will penetrate deeper into the tumor due to their toxicity.
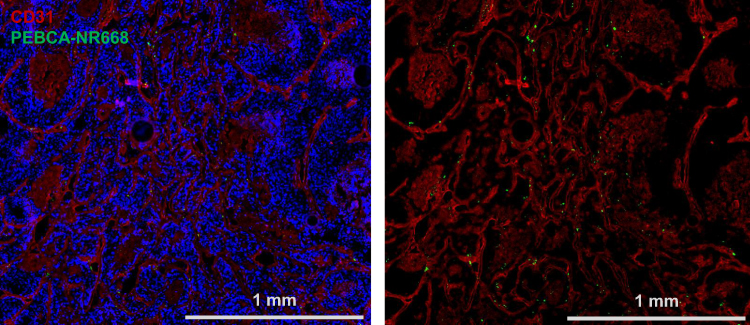 |
Figure 6 Fluorescence imaging of HBCx39 tumor tissue. Mice bearing HBCx39 tumors were injected with NR668 loaded PEBCA NPs without folate conjugation. Tumors were excised after 48 h and snap frozen in liquid nitrogen. They were then cryosectioned at 4 µm thickness, thawed, fixed in 4% PFA, permeabilized in 0.1% Triton X-100 and immunostained for DAPI and CD31 before we imaged them with an Olympus VS200 Research Slide Scanner fluorescence microscope. The two panels represent the same section showing nucleus (blue), CD31 and PEBCA-NR668 NPs (green). The NPs used have similar size and zeta potential as the batch shown in Figure 1B. |
CBZ-Loading of PEBCA NPs Improve Anti-Tumor Effects in vivo
Anti-tumor efficacy of PEBCA and PEHCA variants were studied in the HBCx39 PDX tumor model. Nude mice were implanted with tumors in the mammary fat pad and treated with either free CBZ or CBZ loaded PEBCA or PEHCA variants. Empty NPs and saline were included as controls. Treatment was done twice by i.v. injections. As shown in Figure 7A, CBZ-loaded PEBCA NPs showed significantly better inhibition of tumor growth compared to free CBZ, indicating improved therapeutic efficacy. Moreover, the anti-tumor effect of PEBCA-CBZ-F is found to be similar to PEBCA-CBZ, suggesting that the targeting approach did not improve the therapeutic effect of the NPs. This is in line with the findings in vitro (Figures 3 and 4) and suggests that the folate molecules on the surface of NPs might possess an unfavorable or hidden conformation which makes them unavailable for binding to the FolRs. Hence, optimizing the physical and chemical properties of such targeted NPs for effective clinical translation is challenging. Also, it is notable that the treatment with CBZ-loaded PEBCA NPs and free CBZ caused a similar decrease in body weight during the initial days after treatment, but the weight was regained during the next days (Figure 7B). Moreover, preliminary studies with CBZ loaded PEHCA NPs did not show any improved effect compared to free CBZ (data not shown). Injection of such NP variants also caused some transient discomfort to the mice, and we therefore decided to perform further studies only with PEBCA NP variants. Empty PEBCA NPs neither showed any therapeutic effect nor toxicity (Figure 7).
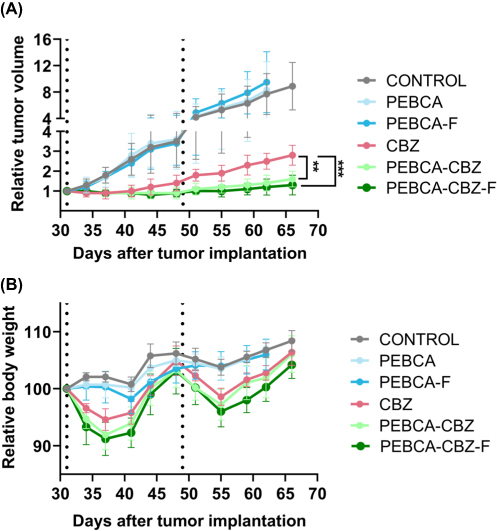 |
Figure 7 In vivo efficacy of PACA NP variants. Athymic nude mice were implanted with HBCx39 tumors on the mammary fat pad. Treatment with various CBZ loaded NPs/free CBZ (i.v. administration) was started approximately 4 weeks after implantation when palpable tumors were developed and reached a diameter of around 5–6 mm. Treatment doses equivalent to 20 mg/kg b.wt of CBZ were given as first dose and half of this dose was administered later as a second dose, approximately in week 7 after implantation (indicated by dotted lines). Empty NPs (labelled as PEBCA and PEBCA-F) and saline were used as controls. (A and B) Relative tumor volume and body weight changes respectively with respect to treatments with CBZ loaded PEBCA NP variants (N=8–10 tumors/group). Data are presented as mean of relative tumor volume ± SD. Statistical analysis was based on p-values generated by one-way ANOVA followed by Tukey’s multiple comparison test (**p = 0.006, ***p = 0.0006). The NP batches used here (including empty NPs) have similar size and zeta potential as the batches shown in Figure 1B. |
CBZ Loaded PEBCA NPs Affect Tumor Associated Immune Cells
Given the previously reported effects of PEBCA NPs on macrophages,10 we analyzed how CBZ loaded PEBCA variants modulate immune microenvironment in HBCx39 PDX tumors. A panel of markers (specified in Table S1) was used to detect various innate immune cell subsets in treated tumors and the untreated controls using multi-parameter flow cytometry. The tumors were collected 17 days after the last treatment to detect the long-term effects. Using the gating strategy presented in Figure S6, we distinguished total leukocytes (CD45+) and further neutrophils (CD45+ Ly6C− LY6G+), dendritic cells (DCs) (CD45+ F4/80−, CD11c+), inflammatory monocytes5 (CD45+, Ly6G−, CD11c±, F4/80+, Ly6Chigh) and macrophages (MΦ) (CD45+, Ly6G−, CD11c+, F4/80+, Ly6Clow/moderate). The percentage of each cell population among total leukocytes was calculated and plotted as shown in Figure 8. We observed a decrease in the DCs subset in all the treated groups (Figure 8B). Also, iMO showed same decrease, particularly in the CBZ and PEBCA-CBZ-F groups (Figure 8C). In contrast, the MΦ subset was congruently increased in all the treated groups (Figure 8D), likely due to stimulated differentiation from monocytes to macrophages. The highest significance of MΦ enrichment was observed in the tumors treated with CBZ loaded PEBCA variants (Figure 8D). Since these variants also showed the highest anti-tumor efficacy in vivo (Figure 7A), we speculate that macrophages could contribute to their therapeutic effect. Apparently, no changes were observed in the neutrophil population (Figure 8A).
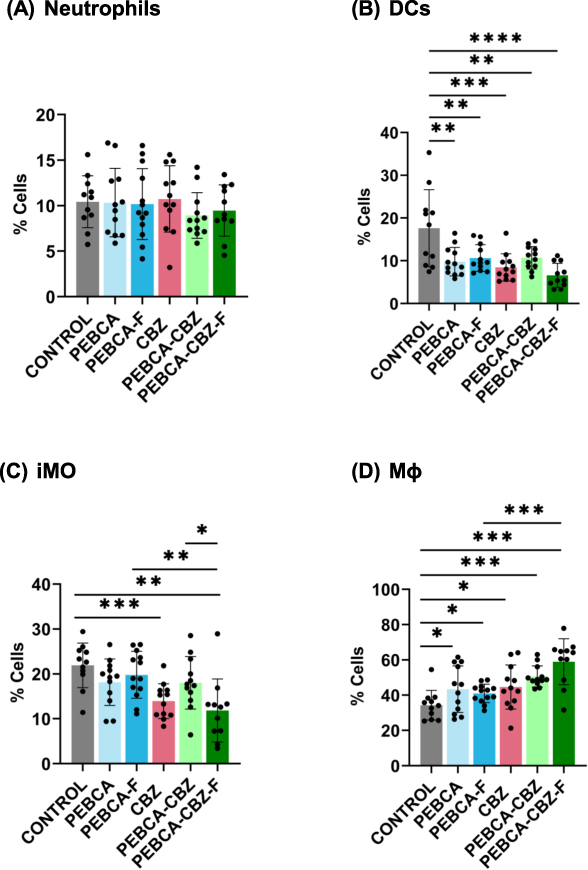 |
Figure 8 Long-term effects of treatment on tumor associated immune cells in vivo. HBCx39 tumors from the aforementioned efficacy study, treated either with PEBCA-CBZ variants/free CBZ/empty PEBCA variants along with controls were collected at the endpoint (17 days after last treatment). Individual tumors were gently dissociated to single cells and were stained with a panel of fluorescent antibodies corresponding to phenotypic and functional markers which could identify/characterize live immune cells. Samples were then analyzed by multicolor flow cytometry and data analysis was done by Flowjo. At least 5×10⁵ events were collected from each tumor sample. As shown here, represented are percent of different immune cell subsets in control or treated samples. (A) neutrophils, (B) DCs, (C) iMO and (D) Mɸ. All subsets are normalized to total leukocytes. *p < 0.05, **p < 0.01, ***p < 0.001, ****p < 0.0001. |
To further investigate the treatment-associated changes in the iMO and MΦ, we analyzed intracellular levels of pro-inflammatory (TNF-α and IFN-γ) and anti-inflammatory (IL-10) cytokines. The levels of these cytokine were significantly higher in MΦ compared to iMO (Figure 9A–C), confirming their functional differences. Intracellular levels of TNF-α and IFN- γ were not significantly modulated by the treatment (Figure 9A and B). However, since the percentage of MΦ was increased by the CBZ loaded PEBCA variants (Figure 8D), an elevation of TNF-α and IFN-γ levels in the treated tumors can be expected. In contrast, the intracellular levels of IL-10 in iMO and MΦ were reduced by the treatment, particularly with CBZ loaded PEBCA variants (Figure 9C).
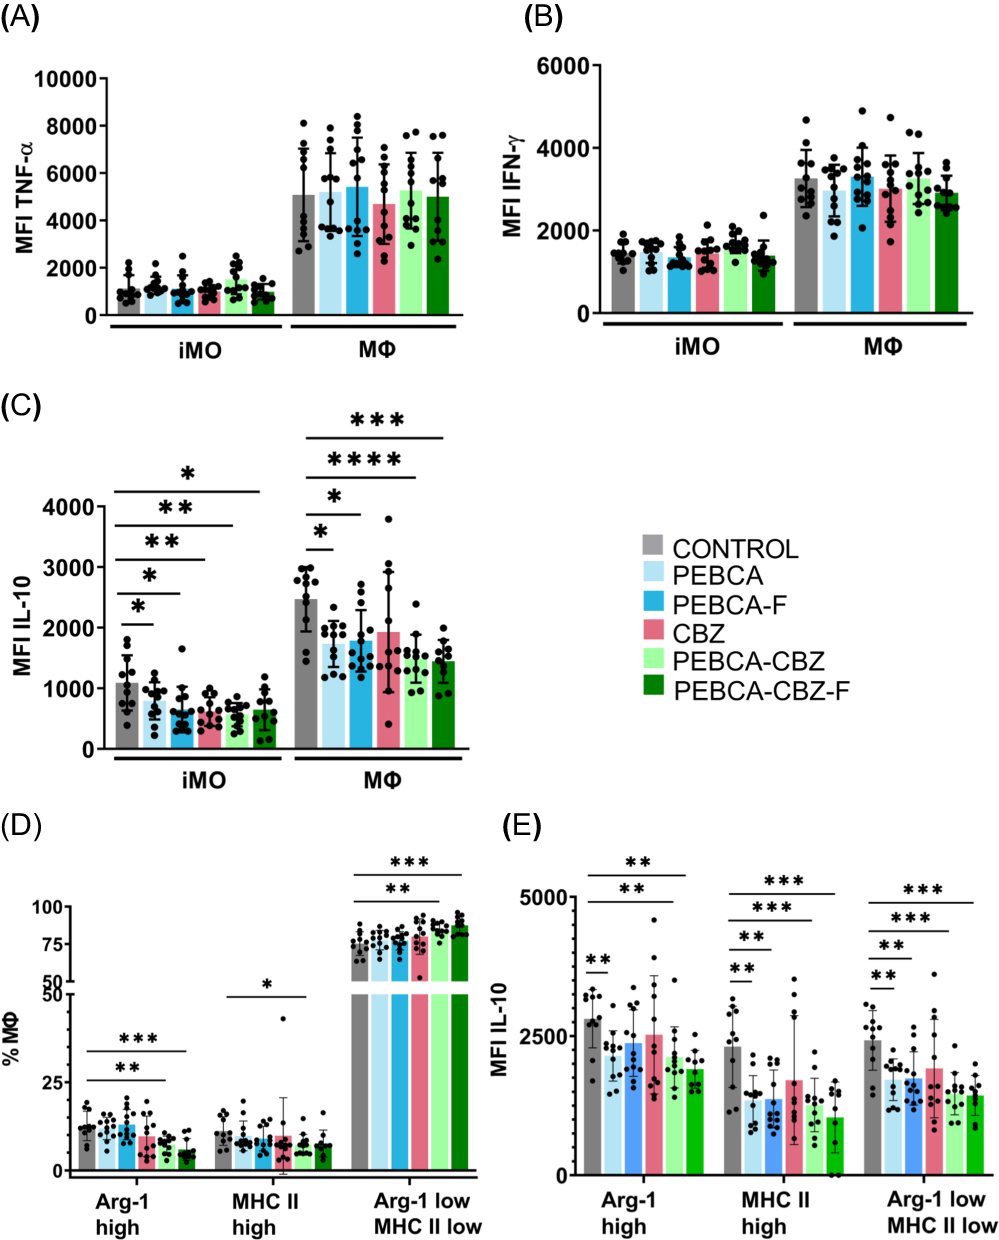 |
Figure 9 Long-term effects of treatment on inflammatory monocytes and macrophages. Represented here are (A and B) MFI of iMO and Mɸ with respect to TNF-α and IFN-γ, respectively. (C) MFI of iMO and Mɸ with respect to IL-10, (D) % cell subsets out of total Mɸ and (E) MFI of the Mɸ subsets with respect to IL-10. Statistical analysis within the same cell type was performed by unpaired t-test with Welch correction. P values ≤ 0.05 were considered statistically significant. *p < 0.05, **p < 0.01, ***p < 0.001, ****p < 0.0001. |
TNF-α/IFN-γ and IL10 are linked to anti-tumorigenic M1- and pro-tumorigenic M2-polarization of MΦ, respectively. Therefore, we extended the analysis of the MΦ population with respect to their polarization states by using known markers linked to M1- and M2-polarization, Major Histocompatibility Complex II (MHC II) and Arginase-1 (Arg-1) respectively. In the non-treated tumors, we distinguished 3 subpopulations of MΦ, such as Arg-1high (17%), MHC IIhigh (13%), and the remaining main population MHC II low/Arg-1 low (70%) (Figures 9D and S7). Treatment with the CBZ-loaded PEBCA variants had the strongest effect on the M2-like Arg-1high MΦs, significantly reducing their abundance, while the reduction of M1-like MHC II high MΦs was less significant (Figure 9D). Simultaneously, the treatment enhanced the major subpopulation situated in the middle of the polarization spectrum (Figure 9D). Furthermore, CBZ loaded PEBCA variants also significantly reduced IL-10 levels in MΦs of all three subpopulations (Figure 9E). IL-10 is an anti-inflammatory immunosuppressive cytokine that promotes tumor growth and therapeutic resistance.38,39 Similarly, Arg-1 also contributes to immunosuppression and resolution of inflammation.40,41 Thus, depletion of Arg-1 high MΦ and reduction of IL10 levels by the CBZ loaded PEBCA variants, may facilitate inflammatory milieu and immune activation.
It should also be noted that empty PEBCA NPs increased the abundance of MΦ (Figure 8D) and reduced IL-10 levels (Figure 9C and E). Even though the significance levels were less than in the CBZ loaded PEBCA variants, this implies that PEBCA alone has immunomodulatory influence.
We have also performed a similar analysis on the tumors collected 96 h after single treatment to explore the short-term effects. We did not observe any significant changes in MΦs, whereas empty PEBCA NPs caused a slight increase of iMO and PEBCA-CBZ caused some reduction of the same (Figure S8). The most obvious change was the drastic decrease of neutrophils upon treatment with CBZ and PEBCA-CBZ (Figure S8A). Similar observations regarding monocytes and neutrophils have also been reported recently, where the hematology of rats was analyzed at different time points after injection of either free CBZ or empty PEBCA NPs or PEBCA-CBZ NPs.13 The decrease of neutrophils is also in line with clinical observations, where CBZ treatment is known to induce early neutropenic effects.42 Thus, our data suggest that even though encapsulation of CBZ into PEBCA NP has improved the efficacy compared to free CBZ, it may not reduce the immediate side effects caused by the drug.
Taken together, our data suggest that treatment with CBZ loaded PEBCA NPs cause long-term effects on the myeloid compartment, particularly macrophages, affecting their abundance, polarization and production of immunosuppressive anti-inflammatory factors. The observed alterations suggest that CBZ loaded PEBCA NPs favor the formation of inflammatory, immune active milieu that can potentiate the anti-tumor effect.
Conclusion
Targeting of tumor and its microenvironment using NPs is an attractive strategy for advanced drug delivery, even though clinical success is still limited. Herein, in vitro and in vivo studies using two different variants of PACA NPs demonstrated that encapsulation of CBZ within PEBCA NPs could significantly improve the therapeutic efficacy in triple negative breast cancer PDX models (this study and10). Moreover, the CBZ-loaded PEBCA NPs caused an effect not only on the tumor, but also exert biological effects on tumor associated immune cells, especially macrophages with a prominent reduction of immunosuppressive function. Such effects may provide a favorable contribution to enhance the therapeutic efficacy. However, the folate-engineered targeting strategies used on the same NPs did not further improve the therapeutic effect. The NPs used did not contain any detectable lipopolysaccharides and gave very low complement activation. The latter is beneficial, since NP-mediated intratumoral complement activation could promote tumor growth. The observed immune responses warrant further investigation.
Abbreviations
ACK lysis buffer, Ammonium-chloride-potassium lysis buffer; Arg-1, Arginase-1; BSA, Bovine serum albumin; CBZ, Cabazitaxel; DCs, Dendritic cells; DMEM, Dulbecco’s Modified Eagle’s Medium; DMSO, Dimethyl sulfoxide; DSPE; 1.2-distearoyl-3-sn-glycerophosphoethanolamine; EBCA, 2-ethylbutyl cyanoacrylate; EHCA, 2-ethylhexyl cyanoacrylate; FBS, Fetal bovine serum; FolR, Folate receptor; iMO, Inflammatory monocytes; LPS, Lipopolysaccharide; MEM, Minimum Essential Medium; MFI, Mean fluorescence intensity; MHC II, Major histocompatibility complex II; MTT, 3-(4,5-dimethyl-2-thiazolyl)-2,5-diphenyltetrazolium bromide; MΦ, Macrophages; NPs, Nanoparticles; PACA, Poly(alkyl cyanoacrylate); PDX, Patient derived xenograft; PEBCA, Poly(2-ethylbutyl cyanoacrylate); PEG, polyethylene glycol; PEHCA, Poly(2-ethylhexyl cyanoacrylate); Pen/Strep, Penicillin/Streptomycin; RBCs, Red blood cells; RPMI, Roswell Park Memorial Institute; RT, Room temperature; TLR4, Toll like receptor 4; TNBC, Triple negative breast cancer.
Data Sharing Statement
All data supporting the findings are shown in the paper and further queries can be directed to the corresponding author, if needed.
Acknowledgments
We thank Geir Frode Øy, Solveig Pettersen and Marek Feith, Department of Tumor Biology, Institute for Cancer Research, Oslo University Hospital and Anne Rein Hatletveit, SINTEF for their technical assistance. We also acknowledge Kotryna Seip (Department of Tumor Biology, Institute for Cancer Research, Oslo University Hospital) for discussions regarding flow cytometry, Martina Landschoof Skrede (Department of Cancer Genetics, Institute for Cancer Research, Oslo University Hospital) and Department of Pathology (Oslo University Hospital) for help with the cryosectioning of tumor tissues. We also thank Sofie Snipstad (NaDeNo Nanoscience AS) for valuable input on the manuscript and the Flow Cytometry Core Facility at Oslo University Hospital for technical advice and support. Graphical abstract and the scheme in Figure 1A were drawn using BioRender software.
Author Information
Ýrr Mørch is from August 2022 CTO and co-founder of the SINTEF spin-off NaDeNo Nanoscience AS commercializing PACA NPs for cancer treatment.
Author Contributions
All authors made a significant contribution to the work reported, whether that is in the conception, study design, execution, acquisition of data, analysis and interpretation, or in all these areas; took part in drafting, revising or critically reviewing the article; gave final approval of the version to be published; have agreed on the journal to which the article has been submitted; and agree to be accountable for all aspects of the work.
Funding
The work was supported by a grant from The Norwegian Cancer Society (Project no. 208239) to KS/TGI and from the Regional Health Authorities in South-East Norway (Project no. 2022069) to GMM/LP. GMM, SMM and JHH also acknowledge support from the Maria Sklodowska-Curie Actions (MSCA-ITN-2020 grant agreement ID: 956544 (DIRNANO: Directing the Immune Response through Designed Nanomaterials)). JHH additionally acknowledges support by the County of Salzburg, Cancer Cluster Salzburg (grant number 20102-P1601064-FPR01-2017) and by the Priority program ACBN, University of Salzburg. AK was supported by a grant from The Research Council of Norway (Project no. 346892).
Disclosure
Dr Ýrr Mørch reports NaDeNo Nanoscience is a SINTEF-spin off established in 2022 commercializing PACA-encapsulated cabazitaxel nanoparticles (currently in pre-clinical phase). In addition, Dr Ýrr Mørch has a patent WO 2014/191502 issued to NaDeNo Nanoscience AS, a patent WO 2019/185685 pending to NaDeNo Nanoscience AS. The authors declare that they have no other competing interests.
References
1. Youn YS, Bae YH. Perspectives on the past, present, and future of cancer nanomedicine. Adv Drug Del Rev. 2018;130:3–11. doi:10.1016/j.addr.2018.05.008
2. van der Meel R, Sulheim E, Shi Y, Kiessling F, Mulder WJM, Lammers T. Smart cancer nanomedicine. Nat Nanotechnol. 2019;14(11):1007–1017. doi:10.1038/s41565-019-0567-y
3. Nam J, Son S, Park KS, Zou W, Shea LD, Moon JJ. Cancer nanomedicine for combination cancer immunotherapy. Nat Rev Mater. 2019;4(6):398–414. doi:10.1038/s41578-019-0108-1
4. Shi J, Kantoff PW, Wooster R, Farokhzad OC. Cancer nanomedicine: progress, challenges and opportunities. Nat Rev Cancer. 2017;17(1):20–37. doi:10.1038/nrc.2016.108
5. Gagliardi A, Giuliano E, Venkateswararao E, et al. Biodegradable polymeric nanoparticles for drug delivery to solid tumors. Front Pharmacol. 2021;12:601626. doi:10.3389/fphar.2021.601626
6. Li S, Feng X, Wang J, et al. Polymer nanoparticles as adjuvants in cancer immunotherapy. Nano Res. 2018;11(11):5769–5786. doi:10.1007/s12274-018-2124-7
7. Merle P, Camus P, Abergel A, et al. Safety and efficacy of intra-arterial hepatic chemotherapy with doxorubicin-loaded nanoparticles in hepatocellular carcinoma. ESMO open. 2017;2(4):e000238. doi:10.1136/esmoopen-2017-000238
8. Hyldbakk A, Mørch Y, Snipstad S, et al. Identification of novel cyanoacrylate monomers for use in nanoparticle drug delivery systems prepared by miniemulsion polymerisation–A multistep screening approach. Int J Pharm X. 2022;4:100124. doi:10.1016/j.ijpx.2022.100124
9. Sulheim E, Iversen T-G, To Nakstad V, et al. Cytotoxicity of poly (alkyl cyanoacrylate) nanoparticles. Int J Mol Sci. 2017;18(11):2454. doi:10.3390/ijms18112454
10. Fusser M, Øverbye A, Pandya AD, et al. Cabazitaxel-loaded Poly (2-ethylbutyl cyanoacrylate) nanoparticles improve treatment efficacy in a patient derived breast cancer xenograft. J Control Release. 2019;293:183–192. doi:10.1016/j.jconrel.2018.11.029
11. Szwed M, Sønstevold T, Øverbye A, et al. Small variations in nanoparticle structure dictate differential cellular stress responses and mode of cell death. Nanotoxicology. 2019;13(6):761–782. doi:10.1080/17435390.2019.1576238
12. Øverbye A, Torgersen ML, Sønstevold T, et al. Cabazitaxel-loaded poly (alkyl cyanoacrylate) nanoparticles: toxicity and changes in the proteome of breast, colon and prostate cancer cells. Nanotoxicology. 2021;15(7):865–884. doi:10.1080/17435390.2021.1924888
13. Hyldbakk A, Fleten KG, Snipstad S, et al. Intraperitoneal administration of cabazitaxel-loaded nanoparticles in peritoneal metastasis models. Nanomed Nanotechnol Biol Med. 2023;48:102656. doi:10.1016/j.nano.2023.102656
14. Abidi A. Cabazitaxel: a novel taxane for metastatic castration-resistant prostate cancer-current implications and future prospects. J Pharmacol Pharmacother. 2013;4(4):230–237. doi:10.4103/0976-500X.119704
15. Huober J, Janni W, Untch M, et al. 168P Long-term survival of a randomised, open-label, Phase II study comparing the efficacy and safety of cabazitaxel versus weekly paclitaxel given as neoadjuvant treatment in patients with operable triple-negative or luminal B/HER2-negative breast cancer (GENEVIEVE). Ann Oncol. 2022;33:S615.
16. Bahl A, Wilson W, Ball J, et al. Concept: a randomised multicentre trial of first line chemotherapy comparing three weekly cabazitaxel versus weekly paclitaxel in HER2 negative metastatic breast cancer. Breast. 2022;66:69–76. doi:10.1016/j.breast.2022.09.005
17. Pourmadadi M, Ghaemi A, Shaghaghi M, Rahdar A, Pandey S. Cabazitaxel-nano delivery systems as a cutting-edge for cancer therapy. J Drug Deliv Sci Technol. 2023;82:104338. doi:10.1016/j.jddst.2023.104338
18. Almansour NM. Triple-negative breast cancer: a brief review about epidemiology, risk factors, signaling pathways, treatment and role of artificial intelligence. Front Mol Biosci. 2022;9:32. doi:10.3389/fmolb.2022.836417
19. Bahrami B, Mohammadnia-Afrouzi M, Bakhshaei P, et al. Folate-conjugated nanoparticles as a potent therapeutic approach in targeted cancer therapy. Tumor Biol. 2015;36(8):5727–5742. doi:10.1007/s13277-015-3706-6
20. Zhang Y, Zhang Z. The history and advances in cancer immunotherapy: understanding the characteristics of tumor-infiltrating immune cells and their therapeutic implications. Cell Mol Immunol. 2020;17(8):807–821. doi:10.1038/s41423-020-0488-6
21. Lee NK, Kim S-N, Park CG. Immune cell targeting nanoparticles: a review. Biomater Res. 2021;25(1):1–11. doi:10.1186/s40824-021-00246-2
22. Sun W, Yang J, Hou M, et al. A nano “Immune‐Guide” recruiting lymphocytes and modulating the ratio of macrophages from different origins to enhance cancer immunotherapy. Adv Funct Mater. 2021;31(23):2009116. doi:10.1002/adfm.202009116
23. Reichel D, Tripathi M, Perez JM. Biological effects of nanoparticles on macrophage polarization in the tumor microenvironment. Nanotheranostics. 2019;3(1):66. doi:10.7150/ntno.30052
24. Cao X, Li B, Chen J, et al. Effect of cabazitaxel on macrophages improves CD47-targeted immunotherapy for triple-negative breast cancer. J Immunother Cancer. 2021;9(3):e002022. doi:10.1136/jitc-2020-002022
25. Klymchenko AS, Roger E, Anton N, et al. Highly lipophilic fluorescent dyes in nano-emulsions: towards bright non-leaking nano-droplets. RSC Adv. 2012;2(31):11876–11886. doi:10.1039/c2ra21544f
26. Michelini S, Barbero F, Prinelli A, et al. Gold nanoparticles (AuNPs) impair LPS-driven immune responses by promoting a tolerogenic-like dendritic cell phenotype with altered endosomal structures. Nanoscale. 2021;13(16):7648–7666. doi:10.1039/D0NR09153G
27. Schwarz H, Gornicec J, Neuper T, et al. Biological activity of masked endotoxin. Sci Rep. 2017;7(1):1–11. doi:10.1038/srep44750
28. Moghimi SM, Simberg D. Critical issues and pitfalls in serum and plasma handling for complement analysis in nanomedicine and bionanotechnology. Nano Today. 2022;44:101479. doi:10.1016/j.nantod.2022.101479
29. Wibroe PP, Anselmo AC, Nilsson PH, et al. Bypassing adverse injection reactions to nanoparticles through shape modification and attachment to erythrocytes. Nat Nanotechnol. 2017;12(6):589–594. doi:10.1038/nnano.2017.47
30. L-P W, Ficker M, Christensen JB, Simberg D, Trohopoulos PN, Moghimi SM. Dendrimer end-terminal motif-dependent evasion of human complement and complement activation through IgM hitchhiking. Nat Commun. 2021;12(1):4858. doi:10.1038/s41467-021-24960-6
31. Valsalakumari R, Yadava SK, Szwed M, et al. Mechanism of cellular uptake and cytotoxicity of paclitaxel loaded lipid nanocapsules in breast cancer cells. Int J Pharm. 2021;597:120217. doi:10.1016/j.ijpharm.2021.120217
32. Bergamaschi A, Hjortland GO, Triulzi T, et al. Molecular profiling and characterization of luminal-like and basal-like in vivo breast cancer xenograft models. Mol Oncol. 2009;3(5–6):469–482. doi:10.1016/j.molonc.2009.07.003
33. Marangoni E, Vincent-Salomon A, Auger N, et al. A new model of patient tumor-derived breast cancer xenografts for preclinical assays. Clin Cancer Res. 2007;13(13):3989–3998. doi:10.1158/1078-0432.CCR-07-0078
34. Schwarz H, Schmittner M, Duschl A, Horejs-Hoeck J, Li L. Residual endotoxin contaminations in recombinant proteins are sufficient to activate human CD1c+ dendritic cells. PLoS One. 2014;9(12):e113840. doi:10.1371/journal.pone.0113840
35. Gorbet MB, Sefton MV. Endotoxin: the uninvited guest. Biomaterials. 2005;26(34):6811–6817. doi:10.1016/j.biomaterials.2005.04.063
36. Moghimi SM, Hunter AC, Dadswell CM, Savay S, Alving CR, Szebeni J. Causative factors behind poloxamer 188 (Pluronic F68, Flocor™)-induced complement activation in human sera: a protective role against poloxamer-mediated complement activation by elevated serum lipoprotein levels. Biochim Biophys Acta Mol Basis Dis. 2004;1689(2):103–113. doi:10.1016/j.bbadis.2004.02.005
37. Valencia PM, Hanewich-Hollatz MH, Gao W, et al. Effects of ligands with different water solubilities on self-assembly and properties of targeted nanoparticles. Biomaterials. 2011;32(26):6226–6233. doi:10.1016/j.biomaterials.2011.04.078
38. Liu Q, Yang C, Wang S, et al. Wnt5a-induced M2 polarization of tumor-associated macrophages via IL-10 promotes colorectal cancer progression. Cell Commun Signal. 2020;18(1):51. doi:10.1186/s12964-020-00557-2
39. Yang C, He L, He P, et al. Increased drug resistance in breast cancer by tumor-associated macrophages through IL-10/STAT3/bcl-2 signaling pathway. Med Oncol. 2015;32(2):14. doi:10.1007/s12032-014-0352-6
40. Steggerda SM, Bennett MK, Chen J, et al. Inhibition of arginase by CB-1158 blocks myeloid cell-mediated immune suppression in the tumor microenvironment. J Immunother Cancer. 2017;5(1):1–18. doi:10.1186/s40425-017-0308-4
41. Menjivar RE, Nwosu ZC, Du W, et al. Arginase 1 is a key driver of immune suppression in pancreatic cancer. Elife. 2023;12:e80721. doi:10.7554/eLife.80721
42. Fumoleau P, Trigo JM, Isambert N, Sémiond D, Gupta S, Campone M. Phase I dose-finding study of cabazitaxel administered weekly in patients with advanced solid tumours. BMC Cancer. 2013;13:1–9. doi:10.1186/1471-2407-13-460
 © 2024 The Author(s). This work is published and licensed by Dove Medical Press Limited. The full terms of this license are available at https://www.dovepress.com/terms.php and incorporate the Creative Commons Attribution - Non Commercial (unported, v3.0) License.
By accessing the work you hereby accept the Terms. Non-commercial uses of the work are permitted without any further permission from Dove Medical Press Limited, provided the work is properly attributed. For permission for commercial use of this work, please see paragraphs 4.2 and 5 of our Terms.
© 2024 The Author(s). This work is published and licensed by Dove Medical Press Limited. The full terms of this license are available at https://www.dovepress.com/terms.php and incorporate the Creative Commons Attribution - Non Commercial (unported, v3.0) License.
By accessing the work you hereby accept the Terms. Non-commercial uses of the work are permitted without any further permission from Dove Medical Press Limited, provided the work is properly attributed. For permission for commercial use of this work, please see paragraphs 4.2 and 5 of our Terms.