")
Back to Journals » International Journal of Nanomedicine » Volume 19
Polarized HLA Class I Expression on Renal Tubules Hinders the Detection of Donor-Specific Urinary Extracellular Vesicles
Authors Wu L , van Heugten MH, van den Bosch TPP, Duimel H, López-Iglesias C, Hesselink DA, Baan CC, Boer K
Received 31 October 2023
Accepted for publication 27 March 2024
Published 12 April 2024 Volume 2024:19 Pages 3497—3511
DOI https://doi.org/10.2147/IJN.S446525
Checked for plagiarism Yes
Review by Single anonymous peer review
Peer reviewer comments 2
Editor who approved publication: Professor Lijie Grace Zhang
Liang Wu,1,2 Martijn H van Heugten,3 Thierry PP van den Bosch,4 Hans Duimel,5 Carmen López-Iglesias,5 Dennis A Hesselink,2 Carla C Baan,2 Karin Boer2
1Department of Nephrology, the First Affiliated Hospital of Shaoyang University, Shaoyang, Hunan, People’s Republic of China; 2Erasmus MC Transplant Institute, University Medical Center Rotterdam, Department of Internal Medicine, Division of Nephrology and Transplantation, Rotterdam, the Netherlands; 3University Medical Center Rotterdam, Department of Internal Medicine, Division of Nephrology and Transplantation, Rotterdam, the Netherlands; 4Department of Pathology, University Medical Center Rotterdam, Rotterdam, the Netherlands; 5The Microscopy CORE Laboratory at the Faculty of Health, Medicine and Life Sciences, Maastricht University, Maastricht, the Netherlands
Correspondence: Liang Wu, Erasmus MC Transplant Institute, Department of Internal Medicine, University Medical Center Rotterdam Erasmus MC, Room No. Na-514, Doctor Molewaterplein 40, 3015 GD, Rotterdam, the Netherlands, Tel +31 0622145029, Email [email protected]
Purpose: Kidney transplantation is the optimal treatment for patients with end-stage kidney disease. Donor-specific urinary extracellular vesicles (uEVs) hold potential as biomarkers for assessing allograft status. We aimed to develop a method for identifying donor-specific uEVs based on human leukocyte antigen (HLA) mismatching with the kidney transplant recipients (KTRs).
Patients and Methods: Urine and plasma were obtained from HLA-A2+ donors and HLA-A2- KTRs pre-transplant. CD9 (tetraspanin, EV marker) and HLA-A2 double-positive (CD9+ HLA-A2+) EVs were quantified using isolation-free imaging flow cytometry (IFCM). Healthy individuals’ urine was used to investigate CD9+ HLA-class-I+ uEV quantification using IFCM, time-resolved fluoroimmunoassay (TR-FIA), and immunogold staining cryo-electron microscopy (cryo-EM). Culture-derived CD9+ HLA-class-I+ EVs were spiked into the urine to investigate urine matrix effects on uEV HLA detection. Deceased donor kidneys and peritumoral kidney tissue were used for HLA class I detection with histochemistry.
Results: The concentrations of CD9+ HLA-A2+ EVs in both donor and recipient urine approached the negative (detergent-treated) control levels for IFCM and were significantly lower than those observed in donor plasma. In parallel, universal HLA class I+ uEVs were similarly undetectable in the urine and uEV isolates compared with plasma, as verified by IFCM, TR-FIA, and cryogenic electron microscopy. Culture supernatant containing HLA class I+ vesicles from B, T, and human proximal tubule cells were spiked into the urine, and these EVs remained stable at 37°C for 8 hours. Immunohistochemistry revealed that HLA class I was predominantly expressed on the basolateral side of renal tubules, with limited expression on their urine/apical side.
Conclusion: The detection of donor-specific uEVs is hindered by the limited release of HLA class I+ EVs from the kidney into the urine, primarily due to the polarized HLA class I expression on renal tubules. Identifying donor-specific uEVs requires further advancements in recognizing transplant-specific uEVs and urine-associated markers.
Keywords: kidney transplantation, donor-specific biomarker, HLA, extracellular vesicles, human urine, renal tubule
Introduction
Kidney transplantation is the optimal treatment for patients with end-stage kidney disease. A percutaneous biopsy of the transplanted kidney is the gold standard for investigating the etiology of kidney dysfunction following transplantation.1 However, this invasive diagnostic procedure is confined by various limitations, including patient discomfort, high costs, and sampling bias.2 Moreover, the reliance on skilled professionals and the need for a hospital setting, primarily for ultrasound guidance, further restrict its accessibility and convenience.3,4 For these reasons, minimally invasive biomarkers to monitor transplant organ function are sought after. Such a “liquid biopsy” may reflect the integrity of the graft without the limitations of a biopsy.2,5,6
Extracellular vesicles (EVs) are phospholipid bilayer particles of approximately 50 to 500 nm. EVs are released by all mammalian cells and contain tissue-derived protein or RNA.7 EVs also convey parent-cell-derived surface molecules and cargo and are involved in cell-to-cell communication.8,9 Tetraspanins such as CD9 and CD63 are generally expressed membrane proteins in major EV subpopulations and are often used for EV recognition.7 In immunity, EVs serve as mediators of immune responses and show promise as biomarkers and potential therapeutic tools.10–12 EVs derived from the kidney transplant have the potential to inform on the condition of the kidney, predict kidney function (eg, delayed graft function), and facilitate the early diagnosis of transplant rejection.13–15 Recent work reporting on urinary EV proteomics suggests that donor-derived EVs include human leukocyte antigen (HLA)-peptide complexes, which can trigger the host immune response and induce rejection of the transplanted kidneys.16
The difference in HLA between donor and recipient contributes to alloimmune activation but also provides the opportunity to identify donor-specific EVs.17,18 Individual HLA consists of class I (including HLA-A, B, and C loci) and II (including HLA-DR, DP, and DQ loci). HLA class I is expressed by most human cells, while HLA class II is restrictively expressed by antigen-presenting cells under physiological conditions.19 As HLA class I is more abundant than HLA class II in the kidney and expressed by tubular epithelial cells and the glomerulus, differences in donor and recipient HLA class I could facilitate donor-specific EV identification in urine.19,20
Previously, we demonstrated the presence of donor-derived HLA class I+ EVs in the circulation of kidney transplant recipients using imaging flow cytometry (IFCM).21 IFCM is a sensitive tool that can directly measure nanosized particles such as EVs from unprocessed or minimally processed human plasma, urine, and cell culture supernatants.22–24 The use of urine as the source of EV may be preferred over blood because of the limited passage of circulating EV into the urine, specifically increasing the abundance of EVs derived from glomeruli or tubular epithelial.25 Urine collection has the additional benefit of being noninvasive and easy.26 Here, we explore the use of graft-derived uEVs in kidney transplantation by detecting donor-specific urinary EVs (uEVs) by their donor-specific HLA class I molecules.
Materials and Methods
Due to its high abundance in kidney tissue and high frequency within the population,27–30 HLA-A2 was selected as the candidate for identifying donor-specific EVs. Twelve HLA-A2+ kidney transplant donors and their corresponding HLA-A2- kidney transplant recipients (KTR) were selected. All recipients had received their first transplant. Donors and KTRs participated in an observational study that aimed to identify minimally invasive biomarkers for the diagnosis of acute kidney transplant rejection (Medical Ethical Review number 2018–035). In addition, ten healthy individuals were included (Medical Ethical Review number 2018–1623). This study was approved by the Institutional Review Board of Erasmus MC, University Medical Center, Rotterdam, the Netherlands. Prior to participation, written informed consent was obtained from all individuals involved. The study adhered to the principles outlined in the Declaration of Helsinki. Supplementary Table S1 summarizes the participants’ clinical features.
Deceased donor kidneys (n = 3) not approved for transplantation and peritumoral kidney tissue from oncological nephrectomies (n = 2) were used to assess the localization of HLA class I. Peritumoral renal tissue was collected from two kidney tumor patients: one male, aged 78, diagnosed with renal cell carcinoma ISUP grade 2, and the other female, aged 56, diagnosed with a low-grade oncocytic tumor. The collection of discarded donor kidneys adhered to the Dutch Code of Conduct legislation, which permits the utilization of leftover material for research purposes and in accordance with the Declaration of Istanbul.
We have submitted all relevant data of our EV measurements to the EV-TRACK knowledgebase (EV-TRACK ID: EV231000).31
Sample Collection
Spot urine samples were collected from KTRs and their donors before transplantation, and fasting morning urine was collected from healthy individuals. Urine (13 mL) was centrifuged at 1915 × g for 10 min at room temperature to remove cells and debris and supplemented with a 25×-concentrated proteinase inhibitor (PI) solution (cOmplete Protease inhibitor cocktail; Merck Life Science, Darmstadt, Germany) at a 4% v/v. Samples were then stored at −70 °C until further analysis. The collecting and processing procedures for all urine samples are illustrated in Figure 1.
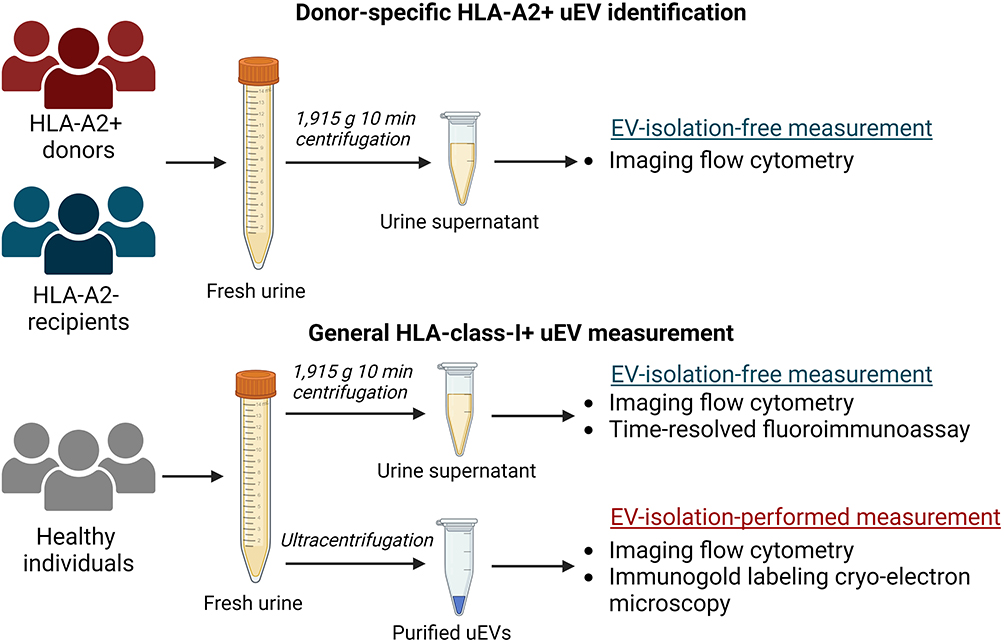 |
Figure 1 Schematic overview of urine collection, processing, and EV measurement techniques. Created with BioRender.com. |
As a positive control containing abundant HLA class I+ EVs, platelet-poor plasma (PPP) samples were collected from all enrolled individuals as described previously.24 For verifying the antibody specificity, peripheral blood mononuclear cells (PBMCs) were isolated from HLA-A2+ and HLA-A2- individuals.32
This study utilized phosphate-buffered saline (PBS; Thermofisher Scientific, Waltham, MA, USA) as a dilution buffer and negative control. The PBS was filtered through a 0.2-µm-pore syringe filter (Corning Life Sciences, Glendale, AZ, USA) to remove possible confounding nanoparticles.
Cell Culture and Collection of the Cell Supernatant
Raji cells (human B lymphoblast, CCL-86; ATCC, Manassas, VA, USA) and Jurkat cells (human T lymphoblast, E6-1; ATCC) were grown in RPMI 1640 GlutaMAX, Thermofisher Scientific) and supplemented with 10% fetal bovine serum (Thermofisher Scientific) and 1% Penicillin-Streptomycin (Thermofisher Scientific) at 37 °C, 5% CO2. HK-2 cells (human renal proximal tubule, CRL-2190, ATCC) were cultured in Keratinocyte Serum Free Medium supplied with bovine pituitary extract and human recombinant epidermal growth factor (Thermofisher Scientific) at 37 °C, 5% CO2. When the cell density of Jurkat and Raji cultures reached 500,000/mL and for HK-2 70% confluency, 1 µL/mL IFN-γ was added to the cell medium for 24 hours to stimulate membrane HLA class I expression (Supplementary Figure S1). Subsequently, Jurkat and Raji cell culture media were replaced with a serum-free medium.33,34 After 24 h, 13-mL supernatant was isolated from all three cell lines and stored after the same pre-storage protocol as the urine samples.
In the spike-in experiments, supernatant collected from each cell line was added to healthy urine in a 1:4 volume ratio, followed by incubation at 37 °C for either 1 or 8 hours to simulate bladder storage conditions.
uEV Isolation Using Differential Ultracentrifugation
uEVs were isolated using differential ultracentrifugation according to a reported protocol.35 Forty-milliliter spot urine samples from healthy individuals were transferred to clean 45Ti tubes (Beckman Coulter, Brea, CA, USA) and first spun at 17,000 × g at 4°C for 20 min (45Ti-rotor, Optima XE-90 ultracentrifuge; Beckman Coulter) to precipitate cell debris and Tamm-Horsfall protein (THP) polymers known to entrap uEVs.36 The supernatant (Supernatant 1) was transferred to a clean container and stored at 4°C. The pellet was dissolved in 250 μL 200 mg/mL dithiothreitol (DTT; Merck Life Science) and incubated at 37°C for 7 min to dissociate the THP and release trapped uEVs.36 Subsequently, 5 mL of isolation buffer (10 mM triethanolamine, 250 mM sucrose, pH 7.6; Merck Life Science) was added to the pellet-DTT solution, which was then transferred into a 70.1Ti tube (Beckman Coulter) and centrifuged at 17,000 × g, at 4°C, for 20 min to remove remaining debris and THPpolymers, producing Supernatant 2. Supernatants 1 and 2 were subsequently combined and centrifuged at 200,000 × g, at 4°C, for 120 minutes. The resulting uEV pellet was suspended in 150 µL PBS and stored at −70 °C until further use.
Labeling EVs for IFCM
For EV staining for IFCM, 112 µL of the sample was incubated with 4 µL of anti-tetraspanin (CD9 or CD63) antibody and 4 µL of the second antibody at 4 °C in the dark overnight (details provided in Supplementary Table S2). All antibodies were centrifuged at 16,000 g for 10 min, and only the top liquid was pipetted and diluted by PBS to reduce the false-positive detection of antibody aggregates. For phenotyping kidney-derived uEVs, unprocessed urine samples from donors and recipients were stained with CD63-APC and AQP2-Alexa488.
For the experiments investigating donor-kidney-specific uEVs, unprocessed donor and recipient urine was incubated with HLA-A2-VioBlue combined with anti-CD9-Alexa488 or anti-CD63-Alexa488. The antibody specificity of HLA-A2-VioBlue was confirmed by its positive staining on HLA-A2+ PBMCs and an inverse result on HLA-A2- PBMCs (Supplementary Figure S2).
General HLA class I+ uEVs were quantified in both the unprocessed urine and ultracentrifuge-isolated uEVs from healthy controls, with uEVs labeled with CD9-APC and universal HLA class I-Alexa488. For uEV isolation measurement using IFCM, 10 µL of the total 150 µL uEV solution was diluted in 990 µL of PBS to prevent swarm detection resulting from an excess concentration of EVs (approximately 1×10⁹ objects/mL).23,24,37 To account for the 40 mL of urine used for EV isolation, the final concentration of uEV isolates used for IFCM staining is 2.67-fold more concentrated than the initial urine. Similarly, as a positive control, platelet-poor plasma was diluted 12.7-fold to avoid the swarm effect. In the subsequent comparison of uEV concentration among the aforementioned samples, the EV concentration of uEV isolates and plasma samples was corrected based on their respective concentration/dilution factors.
For showing non-biological background signals, such as antibody aggregates, samples were treated with detergent to lyse phospholipid and lipid particles.23,38 After each IFCM measurement, all labeled samples were incubated with TritonX-100 (final concentration of 0.05%) at room temperature for 30 min and measured again.
Isotypic staining was conducted to verify the labeling specificity and backgrounds.38 Isotypes were used with the same fluorophore, final concentrations, and volumes as the corresponding antibodies. We used the following antibodies: IgG1-APC (200 µg/mL, clone RMG1-1, Biolegend), IgG1-Alexa488 (200 µg/mL, clone P3.6.2.8.1, ThermoFisher Scientific), and IgG1-VioBlue (300 µg/mL, clone REA293, Miltenyi Biotec).
EV Acquisition and Data Analysis for IFCM
IFCM acquisition was performed on an ImageStreamX Mark II imaging flow cytometer (ISx; Cytek Biosciences, Fremont, CA, USA) using INSPIRE® software (version 200.1.0.765; Cytek Biosciences) as reported previously for measuring unprocessed urine and plasma.21,23 Purified uEVs were measured with the same acquisition protocol as urine and cell supernatant. In brief, the settings of INSPIRE® were: flow speed velocity of 40 mm/s, 6 μm diameter of the flow core, 60× magnification, 405-nm laser at channel 01 (Ch01) with power: 120 mW, 488-nm laser at channel 02 (Ch02) with power: 200 mW, 642-nm laser at channel 05 (Ch05) with power: 150 mW, 785-nm laser for exciting side scatter (SSC) at channel 06 (Ch06) with power: 1.25 mW, and channel 04 (Ch04) used for presenting bright field. The fluorescence signals of Vioblue, Alexa488, and APC were collected in Ch01, Ch02, and Ch05, respectively. To ensure the highest sensitivity, the High Gain Model was used. This model lowers the fluorescence detection threshold and thus can acquire low-intensity fluorescent objects.
Sample quantification was performed using Amnis IDEAS software (version 6.2; Cytek Biosciences).21,23 In brief, to ensure the quantification of single EVs, the following gating strategy was used: 1) particles with SSC intensities ≤ 5279 a.u., corresponding to EVs ≤ 1200 nm based on calibration, were selected; 2) only singlets were selected and objects with multiple fluorescent spots excluded; 3) A-F particles in unprocessed urine samples were excluded; 4) finally, gating was performed for single- and double-positives based on unstained, isotype-stained, and single-stained samples.
Time-Resolved Fluorescence Immunoassay
TR-FIA was performed using a protocol as previously described,39 using for capturing 770 ng/ul of biotinylated anti-HLA-ABC (clone 209306; Bio-Techne) or 770 ng/ul biotinylated anti-IgG1 (isotype control, clone 460305, Bio-Techne).
Briefly, in this approach, EVs were captured from the urine and plasma of healthy individuals using an anti-HLA class I heavy-chain antibody. Subsequently, EVs were labeled with Eu-conjugated antibodies targeting either CD9 or CD63. The resultant signal was quantified as Eu intensity, represented in arbitrary units (a.u.). To validate the specificity of the capture process, the HLA class I antibody was replaced with its isotype, IgG1. Additionally, negative control experiments were conducted using PBS to ascertain baseline detection levels.
HLA Class I Gold Labeling and Cryo-Electron Microscopy
For cryo-electron microscopy (cryo-EM) experiments, uEV samples isolated using ultracentrifugation were labeled with anti-HLA class I antibody (clone TP25.99SF, Bio-Techne) conjugated with 6-nm gold nanoparticles (NPs). The supernatant of Jurkat (5 mL) was pipetted into an ultrafiltration spin column (Vivaspin 20 MWCO 100 kDa, Cytiva, MA, USA) and centrifuged at 3000 × g for 10 min. The liquid (50 µL) retained on the top of the filter was used as a positive control for the immunogold labeling protocol.
Gold nanoparticle conjugation was performed by AURION Immuno Gold Reagents & Accessories (Wageningen, The Netherlands). 8 μL of the uEV solution was mixed with 1 μL of 20 mM CaCl2 and 1 μL of HLA class I-gold-NPs at a concentration of 1 to 4×10¹⁶ NPs/L.40 This mixture was incubated at room temperature for 15 minutes. Subsequently, 3 μL of the labeled sample was deposited onto a cryo-EM grid coated with perforated carbon film (category number: LC300-CU-100, Electron Microscopy Sciences, PA, USA) within the chamber of a Vitrobot Mark IV, a vitrification robot manufactured by FEI.41 The chamber conditions were maintained at 22°C with a relative humidity of 95%. To remove excess liquid, the grid was gently blotted, after which it was immediately frozen by immersion in liquid ethane at −180°C. The vitrified sample on the grid was then transferred to the cold autoloader of a cryo-transmission electron microscope, the Tecnai Arctica (Thermofisher Scientific). High-resolution images were acquired with a Direct Detector Device, Falcon 4, from the same company.
HLA Class I Histochemistry of Kidney Tissue
The cellular localization of HLA class I was assessed on paraffin-embedded sections obtained from non-transplantable donor kidneys and peritumoral tissue derived from nephrectomies performed for oncological reasons.
Immunohistochemistry was conducted using the OptiView Universal DAB Detection Kit and an automated staining system, the Ventana Benchmark ULTRA (Ventana Medical Systems, Oro Valley, AZ, USA), following previously established protocols.42,43 With this published protocol, the kidney samples were stained using an anti-HLA class I antibody (clone TP25.99SF, Bio-Techne). For verification purposes, an anti-HLA class I with a different clone (clone EMR8-5, Abcam, Cambridge, UK) was also employed.
Statistical Analysis
Statistical analysis was performed using GraphPad Prism 9.0 (GraphPad Software, San Diego, CA, USA). EV number distributions were tested for normality using the Shapiro–Wilk test. Normally distributed data are presented as mean ± standard deviation (SD), and data with a non-normal distribution are shown as median [25th – 75th percentile; Q1 – Q3]. For normally distributed comparison, a two-tailed unpaired Student’s t-test or ANOVA with Tukey’s multiple-comparison test was used. For non-normally-distributed data, the Wilcoxon matched-pairs signed rank test was conducted to compare matched groups, and the Mann–Whitney U-test was performed to test the difference between two unmatched groups. A Kruskal–Wallis ANOVA was conducted to examine the differences between multiple groups when variables were not normally distributed. A two-tailed p-value of <0.05 was considered significant.
Results
HLA-A2+ and HLA Class I+ EV Measurement by IFCM
To identify individuals based on the difference in HLA-A2 expression, both HLA-A2+ donors’ and HLA-A2- recipients’ pre-transplant plasma and urine were labeled for the EV marker CD9 and HLA-A2. Figure 2 depicts HLA-A2-expressing CD9+ EVs in both HLA-A2+ and HLA-A2- platelet-poor plasma (PPP, Figures 2A and B), as well as the corresponding urine samples (Figures 2C and D). Detergent- and isotype controls of PPP or urine samples are depicted in Figures 2E–L.
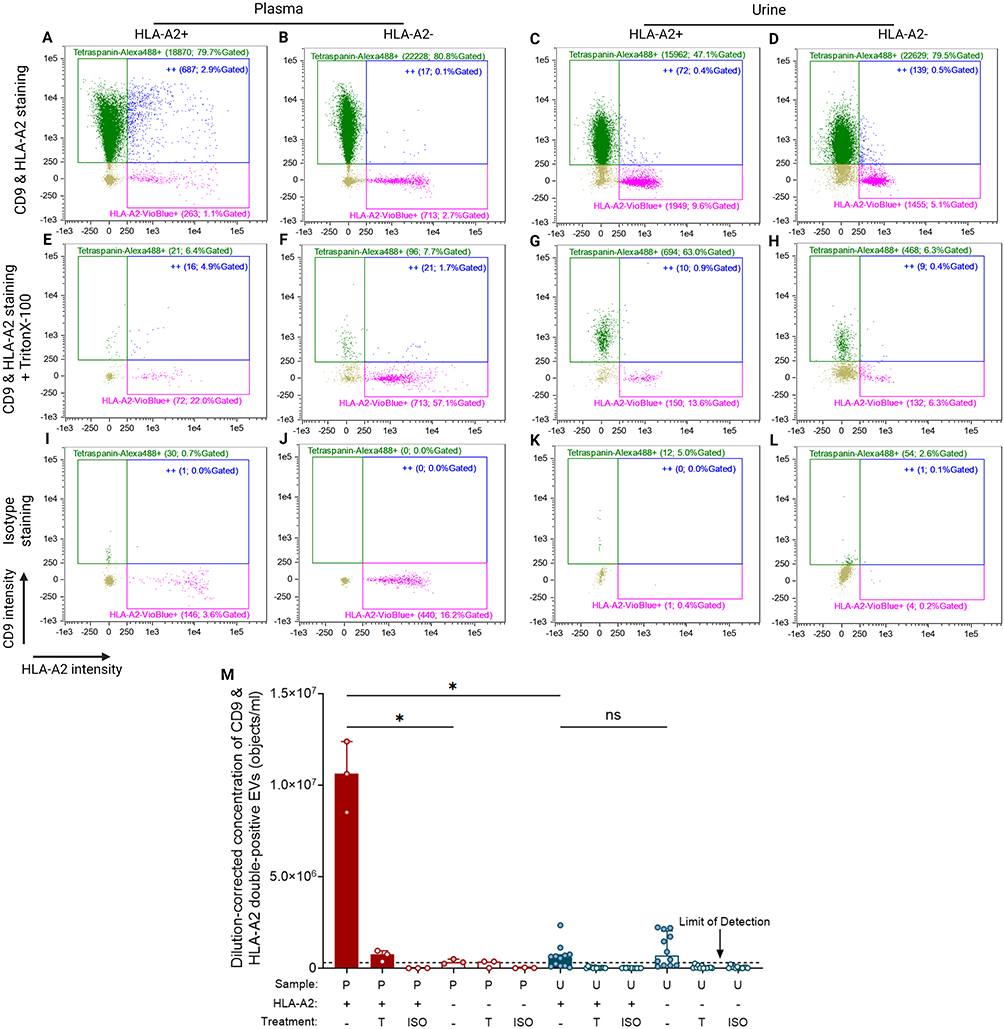 |
Figure 2 HLA-A2 expressing CD9+ EVs quantified in plasma and urine samples using IFCM. (A – D) Representative readout scatterplots presenting three populations of events measured in HLA-A2+ plasma (A), HLA-A2- plasma (B), HLA-A2+ urine (C), and HLA-A2- urine (D). The scatterplots consist of tetraspanin/CD9-Alexa488 single-positives (green dots), HLA-A2-Vioblue single-positives (pink dots), and double-positives (“++”; blue dots). Each gate’s name shows the number and the percentage of gated objects. (E – H) The measurement of (A) – (D) after detergent (TritonX-100) treatment. (I – J) Isotype staining of all samples. (M) Dilution-corrected concentration of CD9 & HLA-A2 double-positives in HLA-A2+ or HLA-A2- plasma (n = 3, red bars) and urine (n = 12, blue bars). Plasma and urine are collected from the same individuals. Data are presented as median [Q1 – Q3]. The black dot line depicts the limit of reliable detection of uEV concentration, representing the background levels observed in detergent-treated and isotype-staining controls (3 × 10⁵ objects/mL). Created with BioRender.com. Marks: *, p < 0.05; ns, no significant difference. Abbreviations: ISO, isotype staining; P, plasma; T, TritonX-100 treatment; U, urine. |
In contrast to the presence of HLA-A2+CD9+ EVs in plasma from HLA-A2+ donors (Figure 2A) no significant numbers of HLA-A2+ EVs could be detected in their urine samples (Figure 2C). Overall, the median concentration of double positive EVs in plasma was 1.0 [Q1 – Q3: 0.8–1.2] × 107 objects/mL, which was approximately 20-fold higher compared to urine at 5.9 [Q1 – Q3: 1.3–7.4] × 105 objects/mL (p = 0.013; Figure 2M), which was similar to the levels observed in pre-transplant urine from HLA-A2- recipients (6.8 [Q1 – Q3: 1.6–20.4] × 105 objects/mL (p > 0.99 versus HLA-A2+; Figure 2M)). These two urine levels were found to be near the limit of reliable detection of uEV concentration (the background levels observed in detergent-treated and isotype-staining controls).23,38 Together, these observations demonstrate the presence of HLA-A2+ EVs in plasma while they were absent or possibly only present in limited numbers in urine.
Since HLA-A2 is an HLA class I molecule,44 IFCM measurements were repeated using a universal HLA class I antibody to identify HLA class I+ EVs in both PPP and the whole urine samples. Typical examples of HLA class I EV measurements are depicted in Figure 3. Consistent with our findings labeling HLA-A2, EVs labeled using antibodies against a common epitope of HLA class I were identified in plasma (Figure 3A), whereas these EVs were not detectable in the whole urine (Figures 3B) or ultracentrifuge-isolated uEVs (Figure 3C). The corresponding negative controls, including detergent-treated samples and isotype controls, demonstrated a comparable, minimal number of positive objects as the double-stained whole urine and uEV isolate samples (Figures 3D–I).
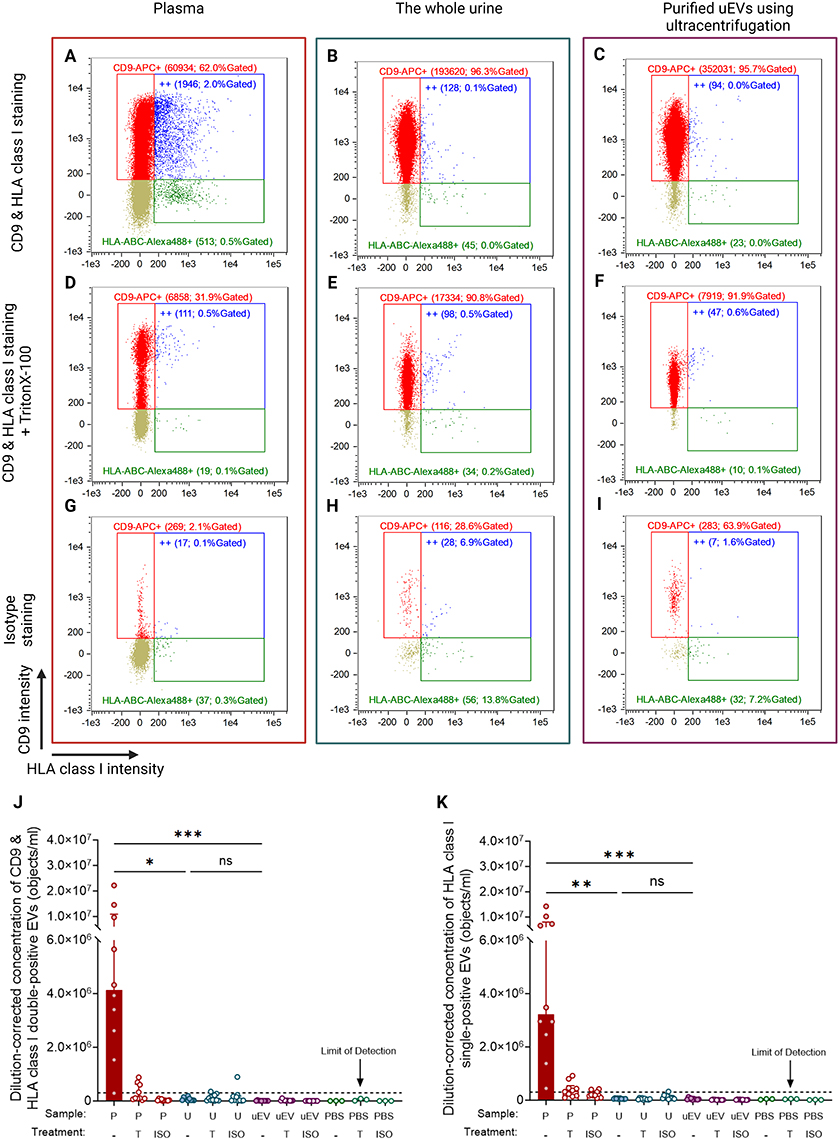 |
Figure 3 HLA class I-expressing CD9+ EVs quantified in plasma, whole urine, and ultracentrifuge-purified uEVs using IFCM. (A – C) The scatterplots present three final readouts from IFCM: CD9-APC single-positives (red dots), HLA class I (HLA-ABC-Alexa488) single-positives (green dots), and double-positives (“++”; blue dots). Each gate’s name shows the number and the percentage of gated objects. (D – F) The measurement of (A) – (C) after detergent (TritonX-100) treatment. (G – I) Isotype staining of all samples. Purified uEVs are obtained using ultracentrifugation and are concentrated 2.67 times compared to unprocessed urine. (J & K) The dilution-corrected concentration of CD9 & HLA class I double-positives (J) and HLA class I single-positives (K) in healthy plasma (n = 10, red bars), urine (n = 10, blue bars), and purified uEVs (n = 10, purple bars). Samples are collected from the same individuals. Data are presented as median [Q1 – Q3]. The black dot line depicts the limit of reliable detection of uEV concentration, representing the background levels observed in detergent-treated and isotype-staining controls (3 × 10⁵ objects/mL). Created with BioRender.com. Marks: ***, p < 0.001; **, p < 0.01; *, p < 0.05; ns, no significant difference. Abbreviations: ISO, isotype staining; P, plasma; T, TritonX-100 treatment; U, urine; uEV, purified uEVs. |
The median concentration [Q1 – Q3] of double-positive HLA class I+ CD9+ EVs in plasma was 4.1 [2.3–10.9] × 106 objects/mL (Figure 3J). In contrast, the whole urine samples contained only 5.5 [2.5–11.1] × 104 objects/mL of double-positive events, a nearly 100-fold difference compared to plasma (p = 0.030). Following the isolation of EVs from urine, the concentration of double-positive objects was still at a level comparable with the whole urine measurement (p = 0.07) and much lower than the plasma, at 5.6 [4.1–10.7] × 103 objects/mL (p = 0.028). Given that not all HLA class I-positive EVs express CD9 or other tetraspanins,43 we also investigated HLA single-positive uEVs (Figure 3K). The median concentration of HLA single-positive uEVs in plasma was higher (3.2 [2.2–8.0] × 106 objects/mL) than the concentrations in unprocessed urine (5.1 [4.5–7.8] × 104 objects/mL, p = 0.003) and purified uEVs (3.6 [2.3–6.3] × 104 objects/mL, p < 0.001). These findings indicate that HLA class I-positive uEVs are undetectable using IFCM regardless of co-labeling with tetraspanin or the purification of uEVs.
IFCM Matrix Effects of Urine on HLA Class I+ EVs
We explored the unique matrix characteristics of urine in pH, osmotic effects, or an unknown urine matrix effect on the detection of fluorescently labeled EV.45 The expression of EV positive for the collecting duct water channel Aquaporin 2 (AQP2) was determined with IFCM, and a spike-in experiment was performed by adding HLA class I+ EVs from multiple cell lines into urine samples.
In the first experiment, AQP2+ CD63+ uEVs in urine from healthy controls urine were quantified, finding a concentration of 5.8 [1.8–15.5] × 105 objects/mL (Figures 4A–D). These findings confirmed the feasibility of detecting kidney-derived transmembrane proteins other than tetraspanins on uEVs using IFCM.
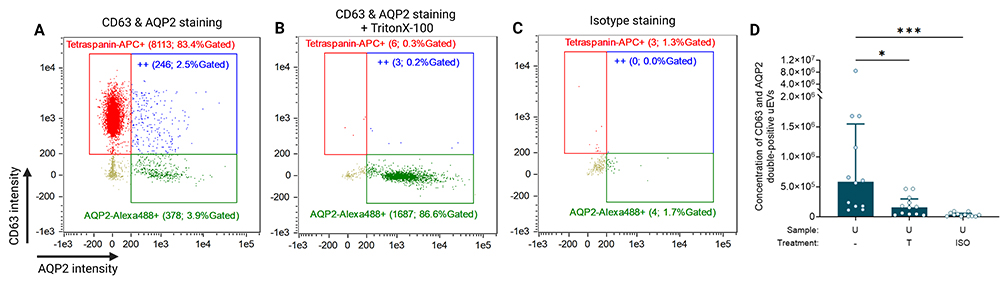 |
Figure 4 The verification of IFCM capability of characterizing kidney-derived uEVs. (A) CD63 and AQP2 double-positive events in healthy urine samples measured by IFCM. The scatterplots present three final readouts from IFCM: CD63-APC single-positives (red dots), AQP2-Alexa488 single-positives (green dots), and double-positives (“++”; blue dots). Each gate’s name shows the number and the percentage of gated objects. (B & C) Representative examples of detergent (TritonX-100) treated and isotype-stained controls. (D) The concentration of CD63 & AQP2 double-positives in healthy urine (n = 12). Data were presented as median [Q1 – Q3]. Created with BioRender.com. Marks: ***, p < 0.001; *, p < 0.05. Abbreviations: ISO, isotype staining; T, TritonX-100 treatment; U, urine. |
For the second experiment, EV-containing culture supernatants from Raji, Jurkat, and HK-2 cell lines were added to urine and PBS samples before incubation at 37°C for up to 8 hours (Supplementary Figure S3A). All cell lines released EVs with a substantial population staining double-positive for CD9 and HLA class I (Supplementary Figure S3B).
The concentration of Raji-derived HLA class I+ EVs remained unchanged after 1-hour incubation in urine, measuring 4.3 [Q1 – Q3: 3.6–4.5] × 106 objects/mL, compared to 1-hour incubation in PBS, which resulted in 4.2 [2.7–6.8] × 106 objects/mL (p = 0.99, Supplementary Figure S3C). Following an 8-hour urine incubation, the EV concentration remained well above the detergent lysis and isotype control at 2.7 [1.8–5.6] × 106 objects/mL and did not significantly decrease compared to the 1-hour urine incubation (p = 0.99, Supplementary Figure S3C). The Jurkat cell-line supernatant showed a slightly reduced concentration of HLA class I+ EVs after 1-hour urine incubation of 3.2 [2.5–3.4] × 106 objects/mL, compared to 1-hour PBS incubation (4.3 [4.0–4.3] × 106 objects/mL, p = 0.16; Supplementary Figure S3D). However, prolonged incubation showed that HLA class I+ EVs remained detectable in urine after an 8-hour incubation, maintaining a concentration of 2.1 [1.4–3.1] × 106 objects/mL, with no significant decline compared to the 1-hour point (p = 0.44; Supplementary Figure S3D). Finally, HLA class I+ EVs from HK-2 cells similarly exhibited stability in urine over 8 hours, resulting in a concentration of 9.3 [6.6–17.4] × 105 objects/mL, without notable difference from 1-hour urine incubation at 9.2 [4.9–13.0] × 105 objects/mL (p = 0.83; Supplementary Figure S3E). These findings show that urine does not significantly affect the stability or recovery of HLA class I+ EV during 8 hours.
HLA Class I+ uEV Detection Using Time-Resolved Fluoroimmunoassay (TR-FIA)
To verify the findings from IFCM using another platform, we employed a previously described Europium TR-FIA.39 This method enables the capture of EVs by binding to surface proteins of interest and facilitates the quantification of captured EVs by labeling them with additional proteins, generally tetraspanins, also confirming their colocalization (see Figure 5A for protocol).
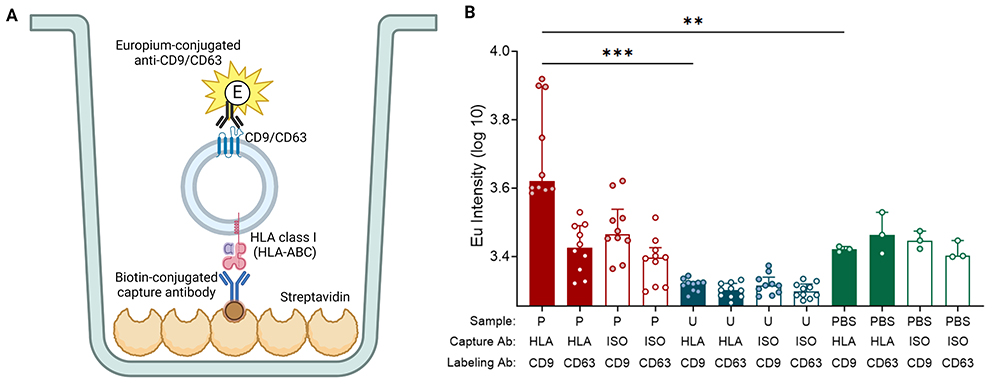 |
Figure 5 TR-FIA. (A) Schematic overview of TR-FIA. (B) Summary of europium intensity of unprocessed plasma and urine. Plasma and urine are collected from the same healthy individuals (n = 10). EVs from samples are captured by anti-HLA class I or its isotype and then labeled by Europium (Eu)- conjugated anti-CD9 or anti-CD63. Data are presented as median [Q1 – Q3]. “HLA” means capturing EVs using anti-HLA class I antibody (Ab); “ISO” denotes capturing using isotype, IgG1. Created with BioRender.com. Marks: ***, p < 0.001; **, p < 0.01. |
The median [Q1 – Q3] Eu intensity value for HLA-class I-capture TR-FIA of plasma was 4171 [3448–7891] a.u., significantly higher than urine, measuring 2098 [1999–2123] a.u. (p < 0.001; Figure 5B). Irrespective of whether CD9 or CD63 was used for staining, all urine samples displayed Eu intensity levels comparable to the negative PBS control, indicating that either HLA class I is too scarcely present on urinary EVs for quantification or that HLA does not colocalize with both CD9 and CD63 on these EVs.
Visualization of HLA Class I Epitopes on uEVs Using Immunogold Staining Cryo-EM
Cryo-EM enables the direct visualization of EVs and facilitates the confirmation of their presence through the observation of their distinctive and consistent bilayer morphology.40,46 To visualize HLA class I epitopes on uEVs, gold particles were conjugated to the anti-HLA class I antibody (clone TP25.99SF) and then used for staining uEVs. HLA class I positivity was confirmed on T cell-derived EVs, and T cell supernatant was used as a positive control.
Abundant gold nanoparticles were observed on T cell-derived EVs, signifying the presence of HLA class I on their EV membrane (Figure 6A). In contrast, very few uEVs showed gold nanoparticle colocalization (Figure 6B). Additional cryo-EM images of captured EVs can be found in the (Supplementary Figure S4).
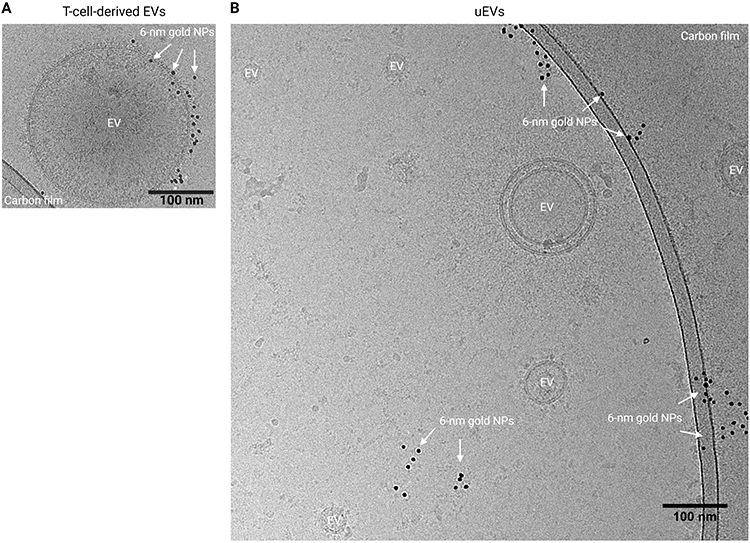 |
Figure 6 Immunogold labeling for HLA class I on EVs and visualization using cryo-EM. (A) Representative image of an HLA class I+ EV in T cell supernatant. (B) Purified uEV sample. Created with BioRender.com. Abbreviations: EV, extracellular vesicles; NPs, nanoparticles. |
Polarized Cell Membrane Localization of HLA Class I Expression
While the human kidney expresses HLA class I and releases EV in urine,35,47 we did not observe the expression of HLA class I on uEVs. To investigate the localization of HLA class I within the renal nephron, we conducted HLA class I immunohistochemistry on kidney sections, as depicted in Figures 7A–E. The results revealed prominent staining for HLA class I of endothelial cells and the basolateral membrane of kidney tubular epithelial cells. In contrast, minimal HLA class I staining was present on the tubular epithelium apical membrane. This distinctive pattern of HLA class I staining is schematically represented in Figure 7F.
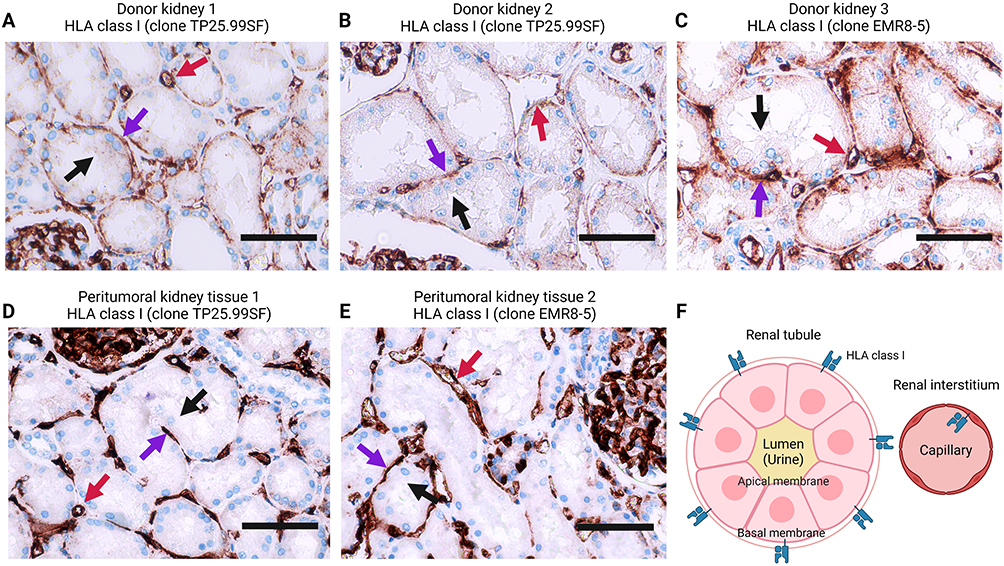 |
Figure 7 Location of HLA class I on the kidney biopsies. (A – E) HLA class I immunohistochemistry on kidney tissue obtained from discarded donor kidneys (A – C) and peritumoral kidney tissue (D – E). Two HLA class I antibodies are used. Black arrows point out the apical membrane of renal tubules, and purple arrows indicate their basal membrane side. Red arrows present vessels in the renal interstitium. (F) A cartoon illustrating the HLA class I location in the renal tubule and interstitium. Created with BioRender.com. |
Discussion
HLA class I expression is universal on human cells and plays a central role in allograft rejection and kidney transplantation.48 The identification of donor-specific uEVs could serve as a tool for monitoring kidney allograft status, potentially supplanting the need for invasive biopsies. In this study, we assessed the feasibility of detecting HLA class I+ uEVs.
While donor-specific HLA class I+ EVs were detected by IFCM in the plasma, no significant number of HLA class I+ EVs could be quantified in the urine despite the purification of uEVs through ultracentrifugation to minimize potential interference from non-EV components. To verify this absence of HLA class I+ EVs in urine, we performed TR-FIA and immunogold labeling on cryo-EM. Therewith, we found that kidney-derived APQ2+ EVs were clearly detectable in urine, while HLA class I+ EVs were not. Subsequently, we assessed whether cell culture-derived HLA class I+ EVs were stable in urine, showing that the urine matrix does not significantly affect EV stability or HLA class I+ EV detectability. We propose that HLA class I+ EV are not excreted into urine but can be quantified from plasma.
Critical to the phenotyping and quantification of HLA+ EVs is the abundance of HLA epitopes on their surface. Our in vivo investigations, encompassing IFCM, TR-FIA, and cryo-EM, consistently reveal an absence of HLA class I heavy-chain+ EVs in urine while they can be quantified in plasma. In our previous study, we conducted a comprehensive size characterization of uEVs utilizing nanoparticle tracking analysis and transmission electron microscopy.23 This analysis revealed that the diameter of uEVs, which determines the surface area available for epitope expression, is comparable to that of EVs found in plasma and cell supernatant.23,49 The in vitro experiments suggest that leukocytes (Raji and Jurkat cell lines) may exhibit heightened activity in releasing HLA class I+ EVs compared to kidney tubular epithelial (HK2) cells (Supplementary Figure S3B). This disparity can be attributed to the rich expression of membrane HLA epitopes on leukocytes, essential for antigen presentation and immune modulation, and potentially greater EV biogenesis for those immune cells.50,51 Previous research reported that lymphocytes actively release HLA class I+ EVs into the circulation, where these EV-associated HLAs serve as ligands and can modulate immune responses.52 In contrast to plasma, under healthy conditions, urine does not serve as a conducive environment for antigen presentation or immune regulation by and to leukocytes, and the absence of HLA class I+ EVs in urine is, therefore, physiologically plausible.
Our study furthermore revealed a polarization of HLA expression on renal tubular cells. HLA class I is primarily concentrated along the basolateral membrane, facing the renal interstitium. Renal tubular epithelial cells possess a highly polarized membrane structure, with the apical membrane in direct contact with pro-urine, facilitating the excretion of EVs into urine.25,53,54 The Apical membrane is more active in EV excretion than the basolateral membrane, with distinctive EV proteomics and miRNA profiles. Moreover, a dense monolayer of renal tubules establishes high impermeability, allowing less than 1% of EVs to pass through over 72 hours.54 This indicates that plasma EVs can hardly pass through the renal filtration barrier under physiological circumstances. In a direct comparison of uEV and kidney tissue proteomics, apical transmembrane proteins were shown to correlate significantly better between uEV and tissue than basolateral proteins.55 The proteomic profiling analysis of uEV in a previous study also presented abundant apical proteins but no integrated basolateral proteins.25 Furthermore, the protein profile of EVs shed from the basal side of retinal pigmented epithelium differs from its apical side, and the former undergoes specific alterations during its tissue dysfunction,56 highlighting distinctions in EV release between apical and basal epithelial membranes. These observations are in line with our findings, explaining the absence of plasma-derived HLA class I+ EVs in urine and potentially the absence of kidney-derived HLA class I as a consequence of its polarized membrane expression.
AQP2 is primarily located on the apical membrane (luminal side) of the epithelial in the renal collecting ducts.57 Our successful detection of AQP2+ uEVs, a well-established subset of urinary EVs,58–60 demonstrates the technical robustness of our IFCM method and underscores the absence of HLA class I on uEVs despite its expression in renal tubules. Epithelial polarized, side-specific protein localization was also observed by other researchers, who found complement-activation split products primarily on the apical membrane of renal proximal tubule cells, which actively release complement-bearing EVs into the urine during proteinuria and kidney function decline in transplant recipients.61
Collectively, two key factors may contribute to the preferential excretion of HLA class I+ EVs from the kidney into the blood rather than urine: 1) Urinary EVs primarily originate from the apical membrane of tubular epithelial cells, and 2) the predominant localization of HLA class I is on the basolateral side of tubules, facing the renal interstitium, potentially as a consequence of epithelial cell’s polarized antigen presentation to lymphocytes, appears to restrict the HLA presence to EV not released into urine. Similarly, polarized HLA class I expression is also found on the basolateral membrane of hepatic bile ducts,62 demonstrating the kidney is not unique in presenting antigens to the side subject to immune surveillance.
While our primary focus has centered on characterizing membrane-bound HLA class I molecules, we acknowledge that a comprehensive analysis of HLA class I molecules potentially encapsulated within uEVs remains an unexplored aspect. Previous evidence demonstrated an increase in donor-specific HLA-B5 in lysed uEV isolates from post-kidney-transplant day 1 to day 7, as determined by using Western blot analysis of the entire uEV proteins. Therefore, it is unclear whether luminal or membrane-associated HLA-B5 was measured.63 Notably, functional HLA class I molecules predominantly exhibit a transmembrane localization, reflecting their role in antigen presentation and immune modulation. Although it is recognized that HLA molecules can also exist within the cytoplasm or be released into extracellular fluids,64 our study prioritized the examination of membrane-bound forms due to their pivotal involvement in immune interactions and allowing for fast and high throughput uEV quantification by IFCM or TR-FIA. The dynamic nature of HLA expression, particularly its upregulation during inflammation or immune activation, warrants consideration. This facet opens a perspective wherein HLA class I+ uEVs could serve as potential markers for allograft rejection post-kidney transplantation. While our findings suggest a preferential excretion of HLA class I+ EVs into the bloodstream rather than urine, the intricate interplay between HLA dynamics, immune responses, and EV release mechanisms demands further exploration. Future investigations may still need to delve into the presence and significance of donor-specific molecules not only on the cell membrane but also in soluble forms within the urine or encapsulated within uEVs, especially in the context of transplant rejection scenarios.
Conclusion
Our study provides insights into the distribution and excretion patterns of HLA class I+ EVs from the kidney. HLA class I+ EVs were not excreted from the kidney into the urine, likely due to the apical-side-dominant expression of HLA class I on renal tubules. The multifaceted behavior of HLA molecules prompts consideration of potential avenues for research, broadening the understanding of their roles in kidney transplantation dynamics and their utility as noninvasive biomarkers for graft health assessment.
Acknowledgments
We acknowledge Guido Jenster (Department of Urology, EMC) for TR-FIA and the sponsorship from the China Scholarship Council (grant number 202008430154).
Disclosure
D.A. Hesselink has received lecture and consulting fees from Astellas Pharma, Chiesi Pharma, Medincell, Novartis Pharma, and Vifor Pharma. He has received grant support from Astellas Pharma, Bristol-Myers Squibb, and Chiesi Pharma [paid to his institution]. D.A. Hesselink does not have employment or stock ownership at any of these companies, nor does he have patents or patent applications. Other authors declare no conflict of interest in this work.
References
1. Halloran PF, Chang J, Famulski K, et al. Disappearance of T cell-mediated rejection despite continued antibody-mediated rejection in late kidney transplant recipients. J Am Soc Nephrol. 2015;26(7):1711–1720. doi:10.1681/ASN.2014060588
2. Verhoeven JGHP, Boer K, Van Schaik RHN, et al. Liquid biopsies to monitor solid organ transplant function: a review of new biomarkers. Ther Drug Monit. 2018;40(5):515–525. doi:10.1097/FTD.0000000000000549
3. Poggio ED, McClelland RL, Blank KN, et al. Systematic review and meta-analysis of native kidney biopsy complications. Clin J Am Soc Nephrol. 2020;15(11):1595–1602. doi:10.2215/CJN.04710420
4. MacGinley R, Champion De Crespigny PJ, Gutman T, et al. KHA-CARI Guideline recommendations for renal biopsy. Nephrology. 2019;24(12):1205–1213. doi:10.1111/nep.13662
5. Sailliet N, Ullah M, Dupuy A, et al. Extracellular Vesicles in Transplantation. Front Immunol. 2022:13. doi:10.3389/FIMMU.2022.800018
6. Correll VL, Otto JJ, Risi CM, et al. Optimization of small extracellular vesicle isolation from expressed prostatic secretions in urine for in-depth proteomic analysis. J Extracell Vesicles. 2022;11(2). doi:10.1002/jev2.12184
7. Théry C, Witwer KW, Aikawa E, et al. Minimal information for studies of extracellular vesicles 2018 (MISEV2018): a position statement of the International Society for Extracellular Vesicles and update of the MISEV2014 guidelines. J Extracell Vesicles. 2018;7(1):2001–3078. doi:10.1080/20013078.2018.1535750
8. de Freitas RCC, Hirata RDC, Hirata MH, Aikawa E. Circulating extracellular vesicles as biomarkers and drug delivery vehicles in cardiovascular diseases. Biomolecules. 2021;11(3):1–20. doi:10.3390/biom11030388
9. Quaglia M, Dellepiane S, Guglielmetti G, Merlotti G, Castellano G, Cantaluppi V. Extracellular Vesicles as Mediators of Cellular Crosstalk Between Immune System and Kidney Graft. Front Immunol. 2020;11:74. doi:10.3389/fimmu.2020.00074
10. Admyre C, Grunewald J, Thyberg J, et al. Exosomes with major histocompatibility complex class II and co-stimulatory molecules are present in human BAL fluid. Eur Respir J. 2003;22(4):578–583. doi:10.1183/09031936.03.00041703
11. Hosseini‐Beheshti E, Grau GER. Extracellular vesicles as mediators of immunopathology in infectious diseases. Immunol Cell Biol. 2018;96(7):694–703. doi:10.1111/imcb.12044
12. Zhang Y, Ge T, Huang M, et al. Extracellular Vesicles Expressing CD19 Antigen Improve Expansion and Efficacy of CD19-Targeted CAR-T Cells. Int J Nanomed. 2023;18:49–63. doi:10.2147/IJN.S390720
13. Sedej I, Štalekar M, Tušek Žnidarič M, et al. Extracellular vesicle-bound DNA in urine is indicative of kidney allograft injury. J Extracell Vesicles. 2022;11(9). doi:10.1002/jev2.12268
14. Jung HY, Lee CH, Choi JY, et al. Potential urinary extracellular vesicle protein biomarkers of chronic active antibody-mediated rejection in kidney transplant recipients. J Chromatogr B. 2020. doi:10.1016/j.jchromb.2019.121958
15. Xu K, Liu Q, Wu K, et al. Extracellular vesicles as potential biomarkers and therapeutic approaches in autoimmune diseases. J Transl Med. 2020;18(1):1–8. doi:10.1186/S12967-020-02609-0/FIGURES/2
16. Braun F, Rinschen M, Buchner D, et al. The proteomic landscape of small urinary extracellular vesicles during kidney transplantation. J Extracell Vesicles. 2020;10(1):e12026. doi:10.1002/jev2.12026
17. Hariharan S, Israni AK, Danovitch G. Long-Term Survival after Kidney Transplantation. N Engl J Med. 2021;385(8):729–743. doi:10.1056/nejmra2014530
18. Wu L, Boer K, Woud WW, Udomkarnjananun S, Hesselink DA, Baan CC. Urinary extracellular vesicles are a novel tool to monitor allograft function in kidney transplantation: a systematic review. Int J Mol Sci. 2021;22(19):10499. doi:10.3390/ijms221910499
19. Boegel S, Löwer M, Bukur T, Sorn P, Castle JC, Sahin U. HLA and proteasome expression body map. BMC Med Genomics. 2018;11(1):1–12. doi:10.1186/s12920-018-0354-x
20. Häyry P, Von Willebrand E, Andersson LC. Expression of HLA‐ABC and ‐DR Locus Antigens on Human Kidney, Endothelial, Tubular and Glomerular Cells. Scand J Immunol. 1980;11(3):303–310. doi:10.1111/j.1365-3083.1980.tb00238.x
21. Woud WW, Hesselink DA, Hoogduijn MJ, Baan CC, Boer K. Direct detection of circulating donor-derived extracellular vesicles in kidney transplant recipients. Sci Rep. 2022;12(1):21973. doi:10.1038/s41598-022-26580-6
22. Görgens A, Bremer M, Ferrer-Tur R, et al. Optimisation of imaging flow cytometry for the analysis of single extracellular vesicles by using fluorescence-tagged vesicles as biological reference material. J Extracell Vesicles. 2019;8(1):1587567. doi:10.1080/20013078.2019.1587567
23. Wu L, Woud WW, Baan CC, et al. Isolation-free measurement of single urinary extracellular vesicles by imaging flow cytometry. Nanomedicine Nanotechnology, Biol Med. 2023:48. doi:10.1016/j.nano.2022.102638
24. Woud WW, van der PE, Mul E, et al. An imaging flow cytometry-based methodology for the analysis of single extracellular vesicles in unprocessed human plasma. Commun Biol. 2022;40(1):633. doi:10.1101/2022.02.24.481807
25. Pisitkun T, Shen R, Knepper MA. Identification and proteomic profiling of exosomes in human urine. Proc Natl Acad Sci U S A. 2004;101(36):13368–13373. doi:10.1073/pnas.0403453101
26. Svenningsen P, Sabaratnam R, Jensen BL. Urinary extracellular vesicles: origin, role as intercellular messengers and biomarkers; efficient sorting and potential treatment options. Acta Physiol. 2020;228(1):e13346. doi:10.1111/apha.13346
27. Evans PR, Trickett LP, Smith JL, MacIver AG, Tate D, Slapak M. Varying expression of major histocompatibility complex antigens on human renal endothelium and epithelium. Br J Exp Pathol. 1985;66(1):79–87.
28. Gonzalez-Galarza F, McCabe A, Santos E, et al. The Allele Frequency Net Database [Search HLA Allele Frequencies]. Available form: http://allelefrequencies.net/hla6006a.asp?hla_locus_type=Classical&hla_locus=&hla_allele1=&hla_allele2=&hla_selection=&hla_pop_selection=&hla_population=2572&hla_country=Indonesia&hla_dataset=&hla_region=&hla_ethnic=&hla_study=&hla_order=order_1&hla_sampl.
29. Hou L, Enriquez E, Persaud M, Steiner N, Oudshoorn M, Hurley CK. Next generation sequencing characterizes HLA diversity in a registry population from the Netherlands. Hla. 2019;93(6):474–483. doi:10.1111/tan.13535
30. Song S, Han M, Zhang H, Wang Y, Jiang H. Full screening and accurate subtyping of HLA-A*02 alleles through group-specific amplification and mono-allelic sequencing. Cell Mol Immunol. 2013;10(6):490–496. doi:10.1038/cmi.2013.33
31. Van Deun J, Mestdagh P, Agostinis P, et al. EV-TRACK: transparent reporting and centralizing knowledge in extracellular vesicle research. Int J Med. 2017;14(3):228–232.
32. Francke MI, Andrews LM, Lan Le H, et al. Monitoring intracellular tacrolimus concentrations and its relationship with rejection in the early phase after renal transplantation. Clin Biochem. 2022;101:9–15. doi:10.1016/J.CLINBIOCHEM.2021.12.002
33. Lee SS, Won JH, Lim GJ, et al. A novel population of extracellular vesicles smaller than exosomes promotes cell proliferation. Cell Commun Signal. 2019;17(1):1–15. doi:10.1186/S12964-019-0401-Z
34. Brennan K, Martin K, FitzGerald SP, et al. A comparison of methods for the isolation and separation of extracellular vesicles from protein and lipid particles in human serum. Sci Rep. 2020;10(1). doi:10.1038/s41598-020-57497-7
35. Blijdorp CJ, Hartjes TA, Wei K, et al. Nephron mass determines the excretion rate of urinary extracellular vesicles. J Extracell Vesicles. 2022;11(1). doi:10.1002/JEV2.12181
36. Wachalska M, Koppers-Lalic D, van Eijndhoven M, et al. Protein Complexes in Urine Interfere with Extracellular Vesicle Biomarker Studies. J Circ Biomarkers. 2016;5:1–6. doi:10.5772/62579
37. van der Pol E, Coumans FAW, Grootemaat AE, et al. Particle size distribution of exosomes and microvesicles determined by transmission electron microscopy, flow cytometry, nanoparticle tracking analysis, and resistive pulse sensing. J Thromb Haemost. 2014;12(7):1182–1192. doi:10.1111/jth.12602
38. Welsh JA, Van Der Pol E, Arkesteijn GJA, et al. MIFlowCyt-EV: a framework for standardized reporting of extracellular vesicle flow cytometry experiments. J Extracell Vesicles. 2020;9(1). doi:10.1080/20013078.2020.1713526
39. Duijvesz D, Versluis CYL, Van Der Fels CAM, et al. Immuno-based detection of extracellular vesicles in urine as diagnostic marker for prostate cancer. Int J Cancer. 2015;137(12):2869–2878. doi:10.1002/ijc.29664
40. Reiner AT, Tan S, Agreiter C, et al. EV-Associated MMP9 in High-Grade Serous Ovarian Cancer Is Preferentially Localized to Annexin V-Binding EVs. Dis Markers. 2017;2017. doi:10.1155/2017/9653194
41. Iancu CV, Tivol WF, Schooler JB, et al. Electron cryotomography sample preparation using the Vitrobot. Nat Protoc. 2007;1(6):2813–2819. doi:10.1038/nprot.2006.432
42. Shankar AS, Du Z, Mora HT, et al. Kidney Organoids Are Capable of Forming Tumors, but Not Teratomas. Stem Cells. 2022;40(6):577. doi:10.1093/STMCLS/SXAC009
43. Blijdorp CJ, Tutakhel OAZ, Hartjes TA, et al. Comparing approaches to normalize, quantify, and characterize urinary extracellular vesicles. J Am Soc Nephrol. 2021;32(5):1210–1226. doi:10.1681/ASN.2020081142
44. El-Awar NR, Akaza T, Terasaki PI, Nguyen A. Human leukocyte antigen class I epitopes: update to 103 total epitopes, including the C locus. Transplantation. 2007;84(4):532–540. doi:10.1097/01.tp.0000278721.97037.1e
45. Verbalis JG. Disorders of body water homeostasis. Best Pract Res Clin Endocrinol Metab. 2003;17(4):471–503. doi:10.1016/S1521-690X(03)00049-6
46. Yuana Y, Koning RI, Kuil ME, et al. Cryo‐electron microscopy of extracellular vesicles in fresh plasma. J Extracell Vesicles. 2013;2(1). doi:10.3402/jev.v2i0.21494
47. Hancock WW, Kraft N, Atkins RC. The immunohistochemical demonstration of major histocompatibility antigens in the human kidney using monoclonal antibodies. Pathology. 1982;14(4):409–414. doi:10.3109/00313028209092120
48. Roberts JP, Wolfe RA, Bragg-Gresham JL, et al. Effect of Changing the Priority for HLA Matching on the Rates and Outcomes of Kidney Transplantation in Minority Groups. N Engl J Med. 2004;350(6):545–551. doi:10.1056/nejmoa025056
49. Cimorelli M, Nieuwland R, Varga Z, van der Pol E. Standardized procedure to measure the size distribution of extracellular vesicles together with other particles in biofluids with microfluidic resistive pulse sensing. PLoS One. 2021;16(4). doi:10.1371/JOURNAL.PONE.0249603
50. Song S, Manook M, Kwun J, Jackson AM, Knechtle SJ, Kelsoe G. Allo-Specific Humoral Responses: new Methods for Screening Donor-Specific Antibody and Characterization of HLA-Specific Memory B Cells. Front Immunol. 2021;12:2708. doi:10.3389/FIMMU.2021.705140/BIBTEX
51. Li DF, Yang MF, Xu J, et al. Extracellular Vesicles: the Next Generation Theranostic Nanomedicine for Inflammatory Bowel Disease. Int J Nanomed. 2022;17:3893. doi:10.2147/IJN.S370784
52. Bauzá-Martinez J, Heck AJR, Wu W. HLA-B and cysteinylated ligands distinguish the antigen presentation landscape of extracellular vesicles. Commun Biol. 2021;4(1). doi:10.1038/s42003-021-02364-y
53. Soares Lindoso R, Yousef Yengej FA, Voellmy F, et al. Differentiated kidney tubular cell-derived extracellular vesicles enhance maturation of tubuloids Journal of Nanobiotechnology Translational statement. J Nanobiotechnology. 2022;20:326. doi:10.1186/s12951-022-01506-6
54. Wang X, Wilkinson R, Kildey K, et al. Molecular and functional profiling of apical versus basolateral small extracellular vesicles derived from primary human proximal tubular epithelial cells under inflammatory conditions. J Extracell Vesicles. 2021;10(4). doi:10.1002/jev2.12064
55. Wu Q, Poulsen SB, Murali SK, et al. Large-scale proteomic assessment of urinary extracellular vesicles highlights their reliability in reflecting protein changes in the kidney. J Am Soc Nephrol. 2021;32(9):2195–2209. doi:10.1681/ASN.2020071035
56. Hernandez BJ, Skiba NP, Plößl K, et al. Polarized Desmosome and Hemidesmosome Shedding via Exosomes is an Early Indicator of Outer Blood-Retina Barrier Dysfunction. J Extracell Biol. 2023;2:e116. doi:10.1101/2023.06.12.544677
57. Higashijima Y, Sonoda H, Takahashi S, Kondo H, Shigemura K, Ikeda M. Excretion of urinary exosomal AQP2 in rats is regulated by vasopressin and urinary pH. Am J Physiol - Ren Physiol. 2013;305(10). doi:10.1152/ajprenal.00249.2013
58. Oshikawa S, Sonoda H, Ikeda M. Aquaporins in urinary extracellular vesicles (Exosomes). Int J Mol Sci. 2016;17(6):957. doi:10.3390/ijms17060957
59. Miyazawa Y, Mikami S, Yamamoto K, et al. AQP2 in human urine is predominantly localized to exosomes with preserved water channel activities. Clin Exp Nephrol. 2018;22(4):782–788. doi:10.1007/s10157-018-1538-6
60. Salih M, Fenton RA, Knipscheer J, et al. An immunoassay for urinary extracellular vesicles. Am J Physiol - Ren Physiol. 2016;310(3):796–801. doi:10.1152/ajprenal.00463.2015
61. Isaksson GL, Nielsen MB, Hinrichs GR, et al. Proteinuria is accompanied by intratubular complement activation and apical membrane deposition of C3dg and C5b-9 in kidney transplant recipients. Am J Physiol - Ren Physiol. 2022;322(2):F150–F163. doi:10.1152/AJPRENAL.00300.2021
62. Vos RDE, Wolf-peeters CDE, Van Den Oord JJ, Desmet V. Original Articles Ultrastructural Immunocytochemical Demonstration of HLA Class I Antigens in Human Pathological Liver Tissue. Hepatology. 1985;5(6):1071–1075. doi:10.1002/hep.1840050602
63. Dimuccio V, Ranghino A, Barbato LP, et al. Urinary CD133+ extracellular vesicles are decreased in kidney transplanted patients with slow graft function and vascular damage. PLoS One. 2014;9(8):e104490. doi:10.1371/journal.pone.0104490
64. Singh PB, Brown RE, Roser B. Class I transplantation antigens in solution in body fluids and in the urine. Individuality signals to the environment. J Exp Med. 1988;168(1):195–211. doi:10.1084/JEM.168.1.195
 © 2024 The Author(s). This work is published and licensed by Dove Medical Press Limited. The full terms of this license are available at https://www.dovepress.com/terms.php and incorporate the Creative Commons Attribution - Non Commercial (unported, v3.0) License.
By accessing the work you hereby accept the Terms. Non-commercial uses of the work are permitted without any further permission from Dove Medical Press Limited, provided the work is properly attributed. For permission for commercial use of this work, please see paragraphs 4.2 and 5 of our Terms.
© 2024 The Author(s). This work is published and licensed by Dove Medical Press Limited. The full terms of this license are available at https://www.dovepress.com/terms.php and incorporate the Creative Commons Attribution - Non Commercial (unported, v3.0) License.
By accessing the work you hereby accept the Terms. Non-commercial uses of the work are permitted without any further permission from Dove Medical Press Limited, provided the work is properly attributed. For permission for commercial use of this work, please see paragraphs 4.2 and 5 of our Terms.