")
Back to Journals » Clinical Interventions in Aging » Volume 9
Nonalcoholic fatty liver disease (NAFLD) – a new factor that interplays between inflammation, malnutrition, and atherosclerosis in elderly hemodialysis patients
Authors Mikolasevic I, Lukenda V, Racki S, Milic S, Sladoje-Martinovic B, Orlic L
Received 2 April 2014
Accepted for publication 7 May 2014
Published 7 August 2014 Volume 2014:9 Pages 1295—1303
DOI https://doi.org/10.2147/CIA.S65382
Checked for plagiarism Yes
Review by Single anonymous peer review
Peer reviewer comments 3
Ivana Mikolasevic,1 Vesna Lukenda,2 Sanjin Racki,1 Sandra Milic,3 Branka Sladoje-Martinovic,1 Lidija Orlic1
1Department of Nephrology, Dialysis and Transplantation, Rijeka University Hospital Center, Rijeka, Croatia; 2Department of Internal Medicine, Dr Josip Bencevic General Hospital, Slavonski Brod, Croatia; 3Department of Gastroenterology, Rijeka University Hospital Center, Rijeka, Croatia
Background/aim: In the past decade, in most regions of the world, an increasing number of adults aged 65 years and older were started on renal replacement therapy each year. In contrast to the general population for whom overnutrition or obesity is associated with increased cardiovascular risk, for patients who are maintained on hemodialysis (HD), malnutrition and malnutrition-inflammation complex syndrome are associated with poor outcome. In recent years, nonalcoholic fatty liver disease (NAFLD) has been considered to be the liver manifestation of metabolic syndrome, and the development of NAFLD is strongly associated with all components of metabolic syndrome (arterial hypertension, dyslipidemia, obesity, and diabetes mellitus type 2) in the general population. The primary end point of this study was to determine the patient’s survival in relation to nutritional and inflammatory state and the presence or absence of NAFLD. The secondary end point of this analysis was the association among NAFLD and various clinical and laboratory data, with the nutritional and inflammatory state of our elderly HD patients.
Methods: Using a single-center, prospective, cohort study design, we followed the progress of 76 patients who were ≥65 years and treated with chronic HD for at least 6 months, at the Department of Nephrology, Dialysis and Transplantation. All patients were followed for a minimum of 18 months or until death. Survival was defined as the time from study initiation to death (or end of study, if still alive).
Results: The main findings of our study were a remarkable positive correlation between NAFLD and high-sensitivity C-reactive protein (hs-CRP) (r=0.659; P<0.0001) and consequent negative correlation with the nutritional parameter, serum albumin (r=-0.321; P=0.004). Interestingly, we showed that in contrast to the general population, where NAFLD is associated with obesity, in the present study, there was no statistically significant association between NAFLD and overnutrition in elderly HD patients. Furthermore, the presence of NAFLD, low serum albumin levels, and high hs-CRP were strong predictors of poor outcome in our elderly HD patients.
Conclusion: Our results indicated that NAFLD probably interplays between inflammation, malnutrition, and atherosclerosis in elderly HD patients. NAFLD could be a new factor that contributes to type 2 malnutrition in elderly HD patients, who may be amenable to adequate nutritional and HD support.
Keywords: cardiovascular risk, serum albumin, high-sensitivity C-reactive protein (hs-CRP)
Introduction
The number of elderly patients with chronic kidney disease (CKD) as well as those with end-stage renal disease is on the rise worldwide. When hemodialysis (HD) was initiated worldwide, elderly patients were often excluded. However, this changed dramatically during the last decade. This can be explained by increased longevity, coupled with technical advances and heightened public expectation, all of which has contributed to an unprecedented increase in demand for HD therapies in the older age group. In the past decade, in most regions of the world, an increasing number of adults aged 65 years or over have been started on renal replacement therapy each year. Thus, old age is no longer seen as a contraindication to renal replacement therapy, and HD of elderly patients has become routine. As a consequence of the aging of the HD population, new issues have emerged.1 With advancing age come challenges to maintaining the nutritional status of these patients. In contrast to the general population, for whom overnutrition or obesity is associated with increased cardiovascular disease (CVD) risk, in patients who are maintained on HD, malnutrition and malnutrition-inflammation complex syndrome are associated with poor outcome.1,2 According to many authors, a significant number of HD patients display some degree of malnutrition, and malnutrition has been identified as one of the most powerful predictors of outcome in HD patients.1–3 Because elderly patients may have special needs in terms of obtaining and preparing food, as well as different nutrient requirements and dietary intake compared with younger patients, they may be at increased risk for the development of malnutrition. Therefore, malnutrition is more likely to occur in the elderly, and it is possible that modest degrees of malnutrition may have a great impact on morbidity and mortality in this population. It is important to recognize and prevent malnutrition in this potentially fragile population. There are no special requirements for the assessment of nutritional status in the elderly – as with younger patients, a panel of tests should be carried out since no one test can adequately assess all aspects of nutritional status.2,3
In recent years, nonalcoholic fatty liver disease (NAFLD) has been considered to be the liver manifestation of metabolic syndrome, and its development is strongly associated with all components of metabolic syndrome (arterial hypertension, dyslipidemia, obesity and diabetes mellitus type 2) in the general population. The term NAFLD is used to cover a spectrum of diseases that are characterized predominantly by macrovesicular steatosis of the liver and occur in people who do not consume large amounts of alcohol. It encompasses a clinicopathologic spectrum of diseases ranging from simple steatosis to nonalcoholic steatohepatitis (NASH), cirrhosis, and hepatocellular carcinoma. The current importance of NAFLD and its link to metabolic syndrome has encouraged an interest in its possible role in the development of atherosclerosis. CVD, followed by liver-related mortality, is the most common cause of death in NAFLD patients. Recent data support the hypothesis that NAFLD itself might contribute to a higher risk of CVD, independent of other prognostic risk factors.4–8 Preliminary data suggest an association between CKD and NAFLD. Namely, the prevalence of CKD was significantly higher in patients with NAFLD/NASH compared with those patients without NAFLD/NASH.9 In view of these preliminary observations, we recently investigated the association between NAFLD and decreased kidney function and found a high prevalence of NAFLD in CKD patients. In our study, the severity of liver steatosis was negatively correlated with kidney function.10 In the next phase of our study we were interested in analyzing whether the presence of transient elastography (TE)-defined NAFLD was associated with higher CVD risk in HD patients. We found that the HD patients with NAFLD showed more carotid atherosclerosis and more adverse CVD events than did the HD patients without NAFLD or the control subjects.11 Our results were in accordance with recent studies that investigated the association of NAFLD with the risk of CVD.12–16
In patients with CKD, the most important factor associated with malnutrition is “inflammation”, which is a complex combination of physiologic, immunologic, and metabolic effects occurring in response to a diversity of internal and external stimulants.2,3
According to these observations, the aim of the present study was to determine the survival of elderly HD patients in relation to nutritional and inflammatory state and presence or absence of NAFLD. Furthermore, we were interested in the association among NAFLD and various clinical and laboratory data representing nutritional and inflammatory state of our elderly HD patients.
Patients and methods
Using a single-center, prospective, cohort study design, we followed the progress of 82 patients who were ≥65 years and treated with chronic HD for at least 6 months at the Department of Nephrology Dialysis and Kidney Transplantation at Rijeka University Hospital Center, Rijeka, Croatia. All patients were dialyzed three times a week for 4 hours, using synthetic polysulfone membranes. The mean duration of HD before recruitment was 59.7±49.4 months. The exclusion criteria were: serological evidence of chronic hepatitis B and/or C virus infection, alcohol abuse, presence of other autoimmune or cholestatic liver disease, use of potentially hepatotoxic medications, or technical reasons (ie, failed TE). In the study group, there were no patients with infections (urinary tract infections, pneumonia, or “chatter” infections) at the time of TE measurements. Patients with evidence of acute kidney injury and those with evidence of advanced progressive metastatic cancer were excluded. During the follow-up period, three patients received a kidney transplant. Considering the above, 76 patients took part in the further analysis.
Data on patient demographic characteristics, medical history, and laboratory data were obtained from the medical record. Comorbid conditions included the presence of diabetes mellitus, dyslipidemia, and arterial hypertension. These data were obtained by using a standard form. Diabetes mellitus was defined by fasting glucose ≥5.6 mmol/L or drug treatment; dyslipidemia was defined by triglycerides ≥1.7 mmol/L, by drug treatment, or by high-density lipoprotein (HDL) <1 mmol/L in men and <1.29 mmol/L in women. Blood pressure was measured with a standard mercury sphygmomanometer. The criterion used for defining arterial hypertension was systolic blood pressure (SP) >140 mmHg and diastolic pressure (DP) >90 mmHg, or the routine use of antihypertension therapy. The SP and DP values obtained before starting regular HD treatment were taken into account for this study.
Renal vascular disease was defined as: long-term arterial hypertension, presence of left ventricular hypertrophy and hypertensive retinopathy, presence of proteinuria, and gradual deterioration of kidney function. Data on vascular access were collected at the time of study initiation. Catheters included both tunneled and nontunneled catheters (jugular and femoral). Arteriovenous accesses included native fistulas.
Laboratory data included hemoglobin, albumin, phosphorus, and high-sensitivity C-reactive protein (hs-CRP) levels and were recorded at the time of TE measurements.
Nutritional status was assessed by measuring the fat mass, waist girth, hip and upper arm, serum albumin levels, and body mass index (BMI) and waist-to-hip ratio (WHR). The BMI was calculated as weight (kg) divided by height squared (m2). Fat mass was assessed by skinfold caliper measurement (result is correlated with total body fat). Poor nutritional status was defined as a BMI of <23 kg/m2, total body fat <19% in women and <24% in men, and serum albumin levels of <40 g/L. Of 76 enrolled patients, 74 (97.4%) were receiving supportive enteral nutrition. Inflammatory status was defined according to the hs-CRP values. The values between 0–5 mg/L were considered as normal values.
At the beginning of the study, a TE (Fibroscan® 502 Touch; Echosens SA, Paris, France) was performed in all patients. Liver stiffness was selected as the parameter to quantify liver fibrosis. Furthermore, the controlled attenuation parameter (CAP) was used to detect and quantify liver steatosis, with the help of TE. The cutoff value for defining liver steatosis was CAP ≥238 dB·m−1, and the cutoff value for defining the presence of fibrosis was liver stiffness of >7 kPa.17,18
NAFLD was defined by the presence of steatosis and CAP values ≥238 dB·m−1, regardless of the presence or absence of any stage of fibrosis and exclusion of other secondary causes of chronic liver disease. CAP values between 238 to 258 dB·m−1 were categorized as steatosis grade 1, values between 259 to 292 dB·m−1 as steatosis grade 2, and CAP values >292 dB·m−1 as steatosis grade 3. Measurements were performed, using the Fibroscan M probe (Echosens SA) (at 3.5 MHz), on the right lobe of the liver trough intercostal spaces, with the patients lying in dorsal decubitus with the right arm in maximal abduction. Ten successful measurements were performed on each patient, and only cases with ten successful acquisitions were taken into account for this study. The success rate was calculated as the number of successful measurements divided by the total number of measurements. Furthermore, the final CAP value, which ranged from 100 to 400 dB·m−1, was the median of individual measurements. The ratio of the interquartile range in CAP values to the median was used as an indicator of variability for the final CAP.18 All scans were performed by the same investigator.
All patients were followed for a minimum of 18 months or until death. The primary end point of this study was patient survival due to nutritional and inflammatory state and presence or absence of NAFLD. The secondary end point of this analysis was the association among NAFLD and various clinical and laboratory data indicating the nutritional and inflammatory state of our patients.
Survival was defined as the time from study initiation to death (or end of study, if still alive).
Patients were informed of the purpose and method of the research, and the study was done in accordance with the Declaration of Helsinki. All patients gave their informed consent prior to their inclusion in the study.
Statistical analysis of data was performed using descriptive statistics (mean and standard deviation). Categorical variables were tested with chi-square tests. The difference in survival of patients was analyzed with Kaplan–Meier’s method of mortality risk. The Pearson or Spearman correlation coefficient was used to express correlations between variables. P-value <0.05 was considered to be statistically significant. Statistical analysis was done using MedCalc Version 10 statistical software package (MedCalc Software BVBA, Ostend, Belgium).
Results
Table 1 provides a description of the demographic characteristics in the analyzed patients. Among the 76 patients, the mean age was 75.1±7.1 (range 65.5 to 90) years; there were 42 (55.3%) men and 34 (44.7%) women (P-value nonsignificant). The most common etiology of CKD was chronic glomerulonephritis (23 patients), followed by renal vascular disease (22 patients). Forty (52.6%) patients had arteriovenous fistula, and 36 (47.4%) had a central venous catheter as vascular access for HD.
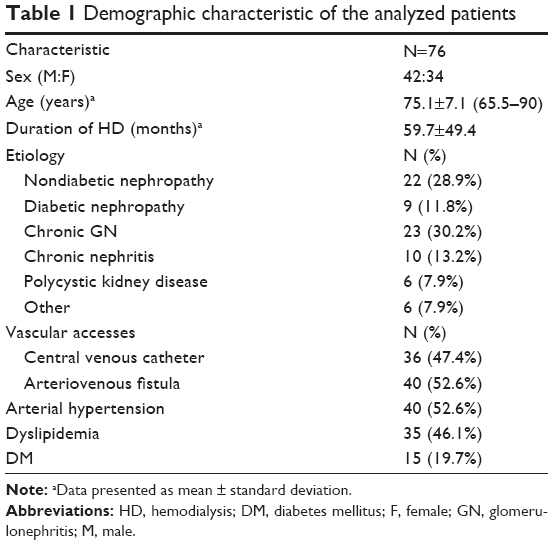 | Table 1 Demographic characteristic of the analyzed patients |
Of the 76 elderly patients, 44 (57.9%) had CAP >238 dB·m−1 and had thus, by definition, NAFLD.
As suggested in the literature, the grades of liver steatosis were defined by CAP values: 13 (29.5%) patients had grade 1, 18 (40.9%) had grade 2, and 13 (29.5%) had grade 3.
First, we were interested in whether NAFLD had influence on the survival of our elderly patients. As shown in Figure 1A, elderly patients who had NAFLD had a 5.2-fold higher risk for death than those patients without NAFLD (hazard ratio [HR] 5.2061; 95% confidence interval [Cl] 2.2481 to 12.0565). Furthermore, we investigated the survival rate according to the degree of NAFLD. For this analysis, the NAFLD patients were stratified into two subgroups. The first group consisted of 13 NAFLD patients with steatosis grade 1 and a second group of 31 NAFLD patients with steatosis grades 2 and 3. Elderly patients who had steatosis grade 2 and 3 had a 19-fold higher risk for death than did those patients with steatosis grade 1 (HR 19.9220; 95% Cl 8.9316 to 44.4362) (Figure 1B).
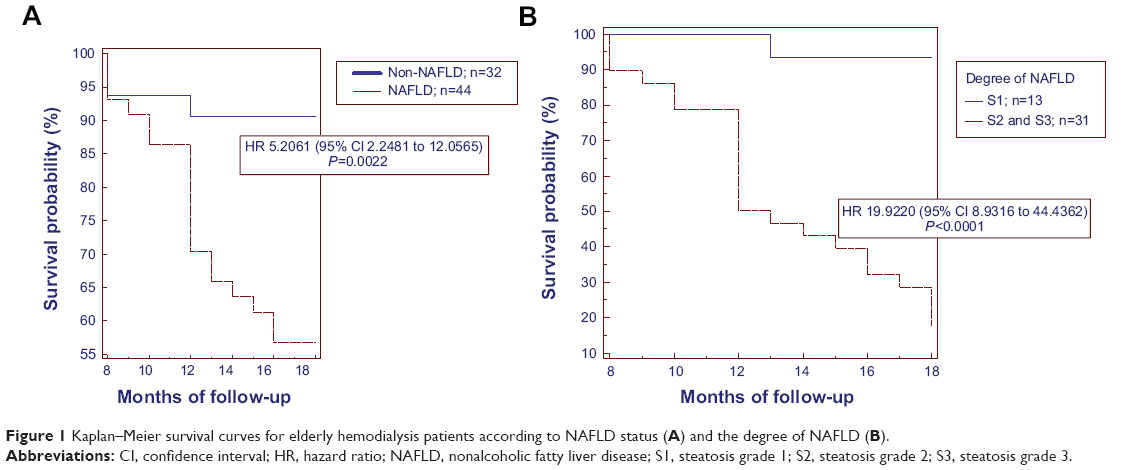 | Figure 1 Kaplan–Meier survival curves for elderly hemodialysis patients according to NAFLD status (A) and the degree of NAFLD (B). |
Next, we investigated nutritional status, based on BMI, fat mass, loss of WHR of >10% during the 6-month period, and serum albumin levels and their influence on mortality rate. As shown in Figure 2A, 2B, and 2C, there were no statistically significant differences in survival rate according to BMI, fat mass, and loss of WHR of >10% during the 6-month period. On the other hand, the mortality rate was statistically significantly higher for patients with low serum albumin levels (HR 5.4213; 95% Cl 2.2288 to 13.1870) (Figure 2D).
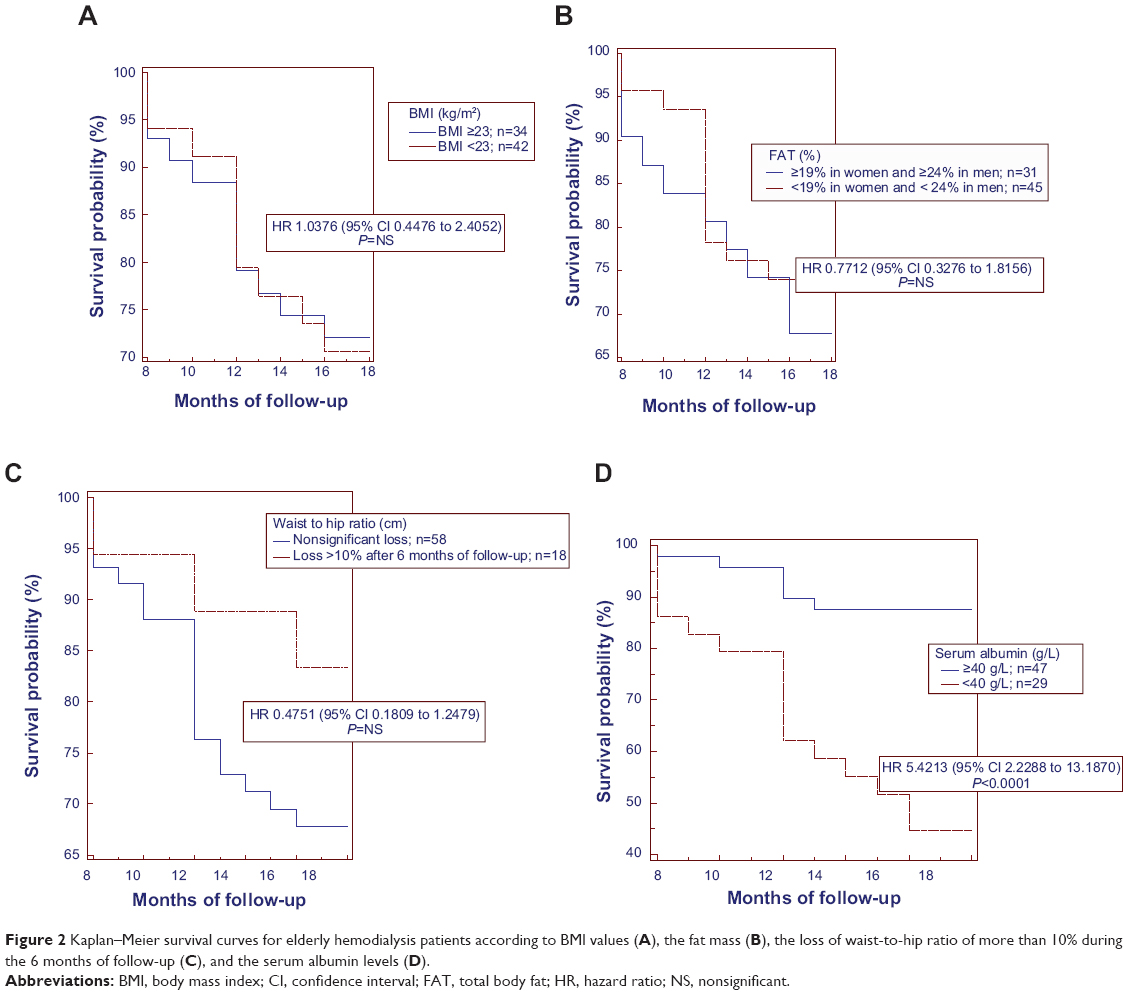 | Figure 2 Kaplan–Meier survival curves for elderly hemodialysis patients according to BMI values (A), the fat mass (B), the loss of waist-to-hip ratio of more than 10% during the 6 months of follow-up (C), and the serum albumin levels (D). |
Furthermore, we investigated inflammatory state, based on serum hs-CRP levels. According to our results, patients who had hs-CRP levels >5 mg/L had an 8.4-fold higher risk for death than did those patients who had hs-CRP levels ≤5 mg/L (HR 8.4682; 95% confidence interval 3.6608 to 19.5887) (Figure 3).
 | Figure 3 Kaplan–Meier survival curves for elderly hemodialysis patients according to the hs-CRP values. |
Next, we investigated the association between NAFLD (defined by CAP values) and various clinical and laboratory parameters of nutritional status and hs-CRP values. The severity of liver steatosis was negatively correlated with serum albumin (r=−0.321; P=0.004) and hemoglobin (r=−0.5900; P<0.0001) levels (Figure 4A and 4B), while it was positively correlated with hs-CRP values (r=0.659; P<0.0001) (Figure 4C). On the other hand, we did not find any significant association between CAP values and total body fat, BMI, upper arm girth, waist and hip circumference, WHR, cholesterol, or phosphorus.
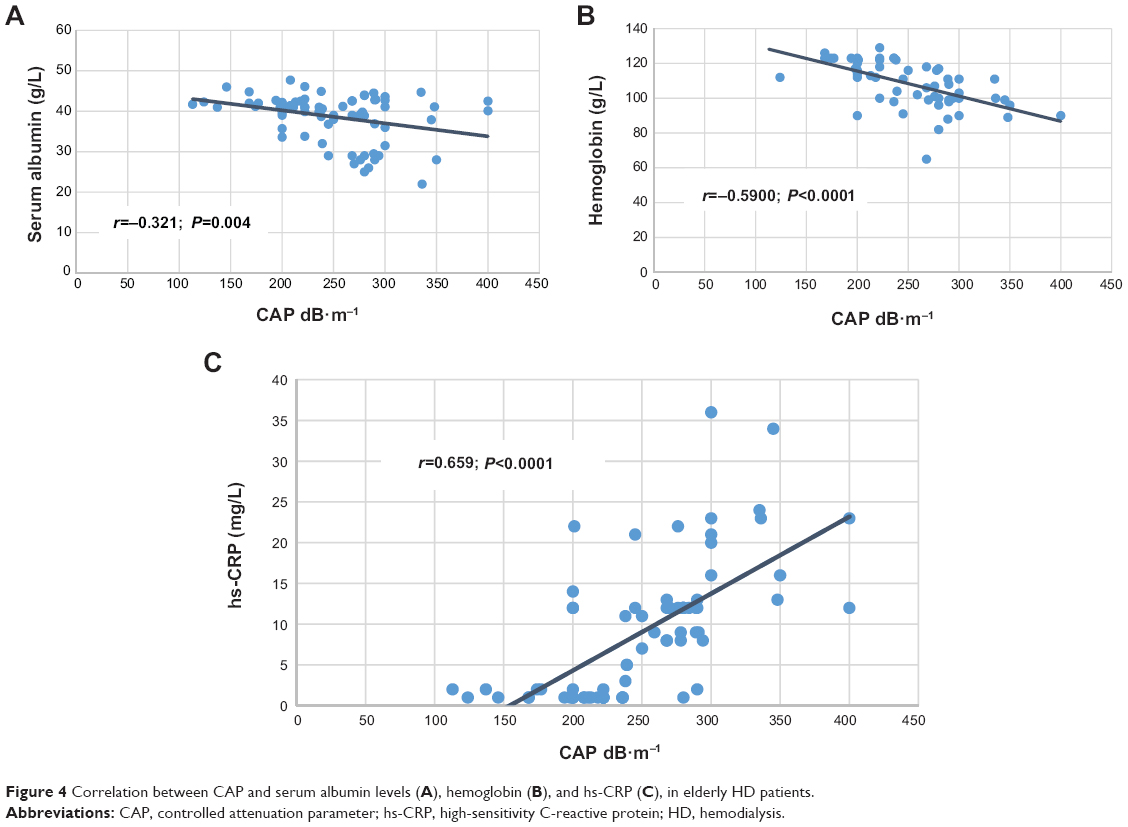 | Figure 4 Correlation between CAP and serum albumin levels (A), hemoglobin (B), and hs-CRP (C), in elderly HD patients. |
Analyzing the causes of death in our group of patients, we found that 72.7% of our patients died as a consequence of CVD. Interestingly, almost all of these patients had NAFLD (92.9%). In the multivariable model, low serum albumin levels (P=0.0001), high hs-CRP values (P=0.0002), and presence of NAFLD (P=0.0066) were independent predictors of mortality in our elderly patients. The next most common cause of death was infection-related (27.3% of patients) (Figure 5).
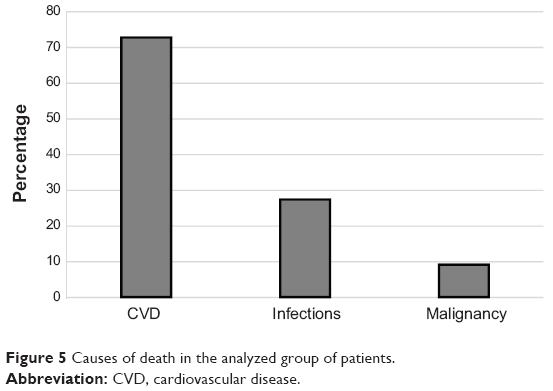 | Figure 5 Causes of death in the analyzed group of patients. |
Discussion
To our very best knowledge, this is the first study that has investigated the association among TE-defined NAFLD, nutritional status, and inflammation in elderly HD patients. The main findings of our study were the remarkable correlations between NAFLD and inflammation and consequently, with the nutritional parameter, serum albumin. Interestingly, we have shown that in contrast to the general population, for whom NAFLD is associated with obesity, in the present study, there was no statistically significant association between NAFLD and overnutrition in elderly HD patients. Furthermore, the presence of NAFLD, low serum albumin levels, and high hs-CRP were strong predictors of poor outcome in our elderly HD patients.
In our study, anthropometric measurements, such as BMI, upper arm circumference, WHR, and fat mass assessed by skinfold caliper measurement were not predictors of mortality. And in contrast to the general population, in whom NAFLD is associated with obesity,6,7 in our study, there was no significant correlation among NAFLD and the aforementioned anthropometric parameters. These results can be explained by the term “reverse epidemiology” in chronic HD patients. A previous report has indicated that in contrast to the general population, in whom markers of overnutrition are associated with increased risk of CVD, decreased nutritional markers are strongly correlated with increased morbidity and mortality, including high risk of CVD, in HD patients.3 On the other hand, a strong positive correlation was found between NAFLD and hs-CRP, as was a strong negative correlation between NAFLD and serum albumin levels. It was shown by other studies that low serum albumin levels correlate highly with increased mortality in HD patients.18,19 Although serum albumin is by far the most commonly used nutritional marker in HD patients, it is important to note that serum albumin is also a negative acute-phase protein. Therefore, low serum albumin levels not only reflect poor nutritional status, but also, reflect the presence of an inflammatory process.20
It is well known that the liver is the central organ for the production of the various classical biomarkers of inflammation and endothelial dysfunction, the secretion of which partly depends on factors that are upregulated in the presence of insulin resistance and metabolic syndrome. Today, there is growing evidence suggesting that in patients with NAFLD/NASH, there is an increased production and release of various proinflammatory cytokines.8–11 These include increased reactive oxygen species, tumor necrosis factor (TNF)-alpha, transforming growth factor (TGF)-beta, plasminogen activator inhibitor-1, hs-CRP, and interleukin (IL)-6, etc, produced by hepatocytes and nonparenchymal cells, including Kupffer cells and hepatic stellate cells. So, enhanced oxidative stress, inflammation with release of inflammatory cytokines, and abnormal lipoprotein metabolism could account for the proatherogenic effect of NAFLD.8,21,22 In the present study, the inflammation marker hs-CRP showed a significant positive correlation with the presence of NAFLD (defined by CAP values) in our elderly patients, thus indicating that NAFLD reflects the severity of inflammation. Furthermore, NAFLD showed high negative correlation with hemoglobin levels, probably indicating the chronic inflammatory state in analyzed patients. Interestingly, both, presence of NAFLD and high hs-CRP levels and also low serum albumin levels were strong predictors of poor outcome in our patients. However, of the patients who died in our study, this was mostly due to CVD, and almost all had NAFLD, thus reflecting the possibility that NAFLD contributes to inflammation and endothelial dysfunction as well as accelerated atherosclerosis in these patients. The results of the present study are in accordance with our previous study that investigated the association between NAFLD and increased CVD risk in HD patients.11 Also, these results are in accordance with previous investigations that investigated the association of NAFLD with the risk of CVD in the general population.12–16 On the other hand, it has been shown that HD patients with malnutrition often have signs of inflammation, characterized by an increase in plasma hs-CRP and an imbalance between proinflammatory and anti-inflammatory cytokines.23,24 There is a close link between malnutrition, inflammation, and atherosclerosis in patients with CKD. It has been suggested that proinflammatory cytokines represent a common link in malnutrition, inflammation, and atherosclerosis (MIA) syndrome in patients with impaired renal function.23–25 Furthermore, it has been suggested that there is at least two types of malnutrition in CKD patients.23,24 Type 1 is related to low protein and energy intake. In this type, serum albumin may be normal or only slightly decreased. Type 1 malnutrition can be managed with adequate nutritional and HD support. In contrast, type 2 malnutrition is associated with inflammation and atherosclerotic CVD (MIA syndrome). In this type, serum albumin levels are low and are much more difficult to reverse with nutritional support and HD therapy. Interestingly, in our study, almost all patients were receiving supportive enteral nutrition, indicating type 2 malnutrition in most of our patients. Patients on chronic dialysis have a lot of factors that contribute to chronic inflammatory state. HD patients with CVD have a higher prevalence of malnutrition and hypoalbuminemia and a lower protein intake than do those without CVD. Many authors report a strong relationship between hypoalbuminemia and CVD in HD patients and suggest that hypoalbuminemia is an important risk factor for CVD in these individuals. It is not completely clear how CVD, inflammation, hypoalbuminemia, and other measures of protein-energy malnutrition are interrelated in HD patients. It has been postulated that the common link among these conditions is inflammation. A common mechanism for the development of CVD and protein-energy malnutrition in HD patients may be cytokine activation.23,24,26 According to the results of the present study and our recent analysis regarding NAFLD and increased CVD risk in HD patients,11 we propose that NAFLD could be a new link between inflammation, malnutrition, and atherosclerosis in MIA syndrome in HD patients. Considering the fact that the main consequence of NAFLD is subchronic liver inflammation that leads and contributes to dyslipidemia, inflammation, enhanced oxidative stress, and endothelial dysfunction, it is possible that NAFLD, even partially contributes to MIA syndrome in elderly HD patients. All of these can consequently result in accelerated atherosclerosis and further cardiovascular damage progression.
Since malnutrition has been demonstrated to impact survival in HD patients of all ages, appropriate attention to nutritional status and its management is essential for elderly HD patients. Prior to embarking on nutritional intervention, it is important to assess the nutritional status in elderly HD patients. There are many tools available to assess nutritional status in HD patients. An ideal and reliable nutritional marker should either predict clinically important outcomes or identify patients who are at high risk for poor outcomes. Therefore, by detecting NAFLD we may be able to detect those elderly patients with type 2 malnutrition who are at high risk of poor outcome and in whom malnutrition is much more difficult to reverse with standard nutritional support and HD therapy.
Our study had some limitations, such as the relatively small number of patients, absence of a liver biopsy in the diagnosis of NAFLD, and the use of TE findings as surrogate for liver biopsy findings – the use of liver biopsy in HD patients is limited due to an increased risk of bleeding in this population of patients. But, on the other hand the study had several strengths, including that it shows, for the first time, that NAFLD probably interplays between inflammation, malnutrition, and atherosclerosis, in elderly HD patients. Put differently, NAFLD could be a new factor that contributes to type 2 malnutrition (associated with MIA syndrome) and that may be amenable to adequate nutritional and HD support. Further, as mentioned, almost all of our patients were receiving the supportive enteral nutrition; therefore, we propose that in this population of patients, some noninvasive methods for detecting NAFLD, including TE (FibroScan) and CAP, could be used as a screening method for detecting high-risk patients, in order to timely act and prevent adverse CVD.
Disclosure
The authors report no conflicts of interest in this work.
References
Sladoje-Martinovic B, Mikolasevic I, Bubic I, Racki S, Orlic L. Survival of chronic hemodialysis patients over 80 years of age. Clin Interv Aging. 2014;9:689–696. | ||
Glaudet F, Hottelart C, Allard J, et al. The clinical status and survival in elderly dialysis: example of the oldest region of France. BMC Nephrol. 2013;14(1):131. | ||
Kalantar-Zadeh K, Block G, Humphreys MH, Kopple JD. Reverse epidemiology of cardiovascular risk factors in maintenance dialysis patients. Kidney Int. 2003;63(3):793–808. | ||
Dowman JK, Tomlinson JW, Newsome PN. Systematic review: the diagnosis and staging of non-alcoholic fatty liver disease and non-alcoholic steatohepatitis. Aliment Pharmacol Ther. 2011;33(5):525–540. | ||
Targher G, Arcaro G. Non-alcoholic fatty liver disease and increased risk of cardiovascular disease. Atherosclerosis. 2007;191(2):235–240. | ||
Farrel GC, Larter CZ. Nonalcoholic fatty liver disease: from steatosis to cirrhosis. Hepatology. 2006;43(2 Suppl 1):S99–S112. | ||
Mikolasevic I, Racki S, Zaputovic L, Lukenda V, Milic S, Orlic L. Nonalcoholic fatty liver disease (NAFLD): a new risk factor for adverse cardiovascular events in dialysis patients. Med Hypotheses. 2014;82(2): 205–208. | ||
Orlić L, Mikolasevic I, Bagic Z, Racki S, Stimac D, Milic S. Chronic kidney disease and nonalcoholic Fatty liver disease-is there a link? Gastroenterol Res Pract. 2014;2014:847539. | ||
Targher G, Bertolini L, Rodella S, Lippi G, Zoppini G, Chonchol M. Relationship between kidney function and liver histology in subjects with nonalcoholic steatohepatitis. Clin J Am Soc Nephrol. 2010;5(12): 2166–2171. | ||
Mikolasevic I, Racki S, Bubic I, Jelic I, Stimac D, Orlic L. Chronic kidney disease and nonalcoholic Fatty liver disease proven by transient elastography. Kidney Blood Press Res. 2013;37(4–5):305–310. | ||
Mikolasevic I, Orlic L, Milic S, Zaputovic L, Lukenda V, Racki S. Nonalcoholic fatty liver disease (NAFLD) proven by transient elastography in hemodialysis patients: is it a new risk factor for adverse cardiovascular events? Blood Purif. 2014;37:259–265. | ||
Villanova N, Moscatiello S, Ramilli S, et al. Endothelial dysfunction and cardiovascular risk profile in nonalcoholic fatty liver disease. Hepatology. 2005;42(2):473–480. | ||
Assy N, Djibre A, Farah R, Grosovski M, Marmor A. Presence of coronary plaques in patients with nonalcoholic fatty liver disease. Radiology. 2010;254(2):393–400. | ||
Targher G, Bertolini L, Padovani R, et al. Relations between carotid artery wall thickness and liver histology in subjects with nonalcoholic fatty liver disease. Diabetes Care. 2006;29(6):1325–1330. | ||
Brea A, Mosquera D, Martín E, Arizti A, Cordero JL, Ros E. Nonalcoholic fatty liver disease is associated with carotid atherosclerosis: a case-control study. Arterioscler Thromb Vasc Biol. 2005;25(5):1045–1050. | ||
Targher G, Day CP, Bonora E. Risk of cardiovascular disease in patients with nonalcoholic fatty liver disease. N Eng J Med. 2010;363: 1341–1350. | ||
Sasso M, Beaugrand M, de Ledinghen V, et al. Controlled attenuation parameter (CAP): a novel VCTE™ guided ultrasonic attenuation measurement for the evaluation of hepatic steatosis: preliminary study and validation in a cohort of patients with chronic liver disease from various causes. Ultrasound Med Biol. 2010;36(11):1825–1835. | ||
Burrowes JD, Stall SH. Nutrition in elderly hemodialysis patients. Geriatr Nephrol Urol. 1996;5:167–176. | ||
Iseki K, Kawazoe N, Fukiyama K. Serum albumin is a strong predictor of death in chronic dialysis patients. Kidney Imt. 1993;44(1):115–119. | ||
Friedman AN, Fadem SZ. Reassessment of albumin as a nutritional marker in kidney disease. J Am Soc Nephrol. 2010;21(2):223–230. | ||
Targher G, Bertolini L, Rodella S, et al. NASH predicts plasma inflammatory biomarkers independently of visceral fat in men. Obesity (Silver Spring). 2008;16(6):1394–1399. | ||
Fan JG, Li F, Cai XB, Peng YD, Ao QH, Gao Y. Effects of nonalcoholic fatty liver disease on the development of metabolic disorders. J Gastroenterol Hepatol. 2007;22(7):1086–1091. | ||
Stenvinkel P, Heimbürger O, Paultre F, et al. Strong association between malnutrition, inflammation, and atherosclerosis in chronic renal failure. Kidney Int. 1999;55(5):1899–1911. | ||
Stenvinkel P, Heimbürger O, Lindholm B, Kaysen GA, Bergström J. Are there two types of malnutrition in chronic renal failure? Evidence for relationships between malnutrition, inflammation and atherosclerosis (MIA syndrome). Nephrol Dial Transplant. 2000;15(7):953–960. | ||
Locatelli F, Fouque D, Heimburger O, et al. Nutritional status in dialysis patients: a European consensus. Nephrol Dial Transplant. 2002;17(4): 563–572. | ||
Qureshi AR, Alvestrand A, Danielsson A, et al. Factors predicting malnutrition in hemodialysis patients: a cross-sectional study. Kidney Int. 1998;53:773–782. |
 © 2014 The Author(s). This work is published and licensed by Dove Medical Press Limited. The full terms of this license are available at https://www.dovepress.com/terms.php and incorporate the Creative Commons Attribution - Non Commercial (unported, v3.0) License.
By accessing the work you hereby accept the Terms. Non-commercial uses of the work are permitted without any further permission from Dove Medical Press Limited, provided the work is properly attributed. For permission for commercial use of this work, please see paragraphs 4.2 and 5 of our Terms.
© 2014 The Author(s). This work is published and licensed by Dove Medical Press Limited. The full terms of this license are available at https://www.dovepress.com/terms.php and incorporate the Creative Commons Attribution - Non Commercial (unported, v3.0) License.
By accessing the work you hereby accept the Terms. Non-commercial uses of the work are permitted without any further permission from Dove Medical Press Limited, provided the work is properly attributed. For permission for commercial use of this work, please see paragraphs 4.2 and 5 of our Terms.