")
Back to Journals » International Journal of Nanomedicine » Volume 19
Lack of Laminar Shear Stress Facilitates the Endothelial Uptake of Very Small Superparamagnetic Iron Oxide Nanoparticles by Modulating the Endothelial Surface Layer
Authors Twamley SG , Gimber N, Sánchez-Ibarra HE, Christaller T , Isakzai V, Kratz H , Mitra R, Kampen L, Stach A , Heilmann H, Söhl-Kielczynski B, Ebong EE , Schmoranzer J, Münster-Wandowski A , Ludwig A
Received 17 October 2023
Accepted for publication 26 February 2024
Published 2 April 2024 Volume 2024:19 Pages 3123—3142
DOI https://doi.org/10.2147/IJN.S437714
Checked for plagiarism Yes
Review by Single anonymous peer review
Peer reviewer comments 2
Editor who approved publication: Professor R.D.K. Misra
Supplementary video 1 of "LSS enables the uptake of VSOP by modulating the ESL" [ID 437714].
Views: 69
Shailey Gale Twamley,1– 3 Niclas Gimber,4 Héctor Eduardo Sánchez-Ibarra,1,2 Tobias Christaller,1,2 Victoria Isakzai,1,2 Harald Kratz,5 Ronodeep Mitra,6 Lena Kampen,1– 3 Anke Stach,1,2 Heike Heilmann,7 Berit Söhl-Kielczynski,8 Eno Essien Ebong,6,9,10 Jan Schmoranzer,4 Agnieszka Münster-Wandowski,7,* Antje Ludwig1– 3,*
1Department of Cardiology, Angiology and Intensive Care Medicine, Deutsches Herzzentrum der Charité, Berlin, Germany; 2Department of Cardiology, Angiology and Intensive Care Medicine, Charité – Universitätsmedizin Berlin, Corporate Member of Freie Universität Berlin and Humboldt-Universität Zu Berlin, Berlin, Germany; 3DZHK (German Centre for Cardiovascular Research), Partner Site Berlin, Berlin, Germany; 4Advanced Medical Bioimaging Core Facility (AMBIO), Universitätsmedizin Berlin, Corporate Member of Freie Universität Berlin, Humboldt-Universität zu Berlin, and Berlin Institute of Health, Berlin, Germany; 5Department of Radiology, Charité - Universitätsmedizin Berlin, Corporate Member of Freie Universität Berlin and Humboldt-Universität zu Berlin, Berlin, Germany; 6Department of Chemical Engineering, Northeastern University, Boston, MA, USA; 7Institute of Integrative Neuroanatomy, Charité - Universitätsmedizin Berlin, Corporate Member of Freie Universität Berlin, Humboldt-Universität zu Berlin, and Berlin Institute of Health, Berlin, Germany; 8Institute for Integrative Neurophysiology, Charité - Universitätsmedizin Berlin, Corporate Member of Freie Universität Berlin, Humboldt-Universität Zu Berlin, and Berlin Institute of Health, Berlin, Germany; 9Department of Bioengineering, Northeastern University, Boston, MA, USA; 10Department of Neuroscience, Albert Einstein College of Medicine, New York, NY, USA
*These authors contributed equally to this work
Correspondence: Shailey Gale Twamley; Antje Ludwig, Tel +49-30-450-528455 ; +49-30-450-513196, Fax +49-30-450-528922 ; +49-30-450941, Email [email protected]; [email protected]
Purpose: To study whether the absence of laminar shear stress (LSS) enables the uptake of very small superparamagnetic iron oxide nanoparticles (VSOP) in endothelial cells by altering the composition, size, and barrier function of the endothelial surface layer (ESL).
Methods and Results: A quantitative particle exclusion assay with living human umbilical endothelial cells using spinning disc confocal microscopy revealed that the dimension of the ESL was reduced in cells cultivated in the absence of LSS. By combining gene expression analysis, flow cytometry, high pressure freezing/freeze substitution immuno-transmission electron microscopy, and confocal laser scanning microscopy, we investigated changes in ESL composition. We found that increased expression of the hyaluronan receptor CD44 by absence of shear stress did not affect the uptake rate of VSOPs. We identified collagen as a previously neglected component of ESL that contributes to its barrier function. Experiments with inhibitor halofuginone and small interfering RNA (siRNA) demonstrated that suppression of collagen expression facilitates VSOP uptake in endothelial cells grown under LSS.
Conclusion: The absence of laminar shear stress disturbs the barrier function of the ESL, facilitating membrane accessibility and endocytic uptake of VSOP. Collagen, a previously neglected component of ESL, contributes to its barrier function.
Keywords: citrate coated nanoparticles, atherosclerosis, blood flow, endothelial barrier, permeability, internalization
Graphical Abstract:

Introduction
Electrostatically stabilized very small superparamagnetic iron oxide nanoparticles (VSOP) are potentially valuable for magnetic resonance imaging (MRI) of atherosclerosis.1–3 VSOP have a size of ~7 nm and are electrostatically stabilized by a monomeric citrate layer.4 VSOP have progressed through clinical development up to Phase II as a contrast agent for MRI.5 It was demonstrated that the concentrations of intravenously injected VSOP sufficient for MRI of atherosclerotic plaques in mice did not lead to any detectable toxic effects in cells and tissues.6
Experiments on atherosclerotic low-density lipoprotein receptor-deficient (LDLR−/−) mice revealed the mechanism of VSOP uptake in atherosclerotic lesions. LDLR−/− mice with advanced atherosclerosis were analyzed using MRI and transmission electron microscopy (TEM) at different time points after intravenous injection of VSOP. Post mortem MRI detected VSOP labeling of atherosclerotic plaques, 10 min after injection, with increasing signal changes over the first 3 h. TEM revealed that the rapid plaque labeling was caused by accelerated transcytosis of VSOP through ECs covering plaques. Prior endocytosis, VSOP appeared to cluster at the endothelial surface near the membrane. This led us to hypothesize that the endothelial surface layer (ESL) is decisive for the uptake and that the rapid MRI visualization of plaques by VSOP is mainly due to the impaired barrier function of the endothelium in the diseased vessel.3 In the plaque, VSOP are eventually detectable in macrophages and calcifying extracellular vesicles.1,2,6 Because decreased endothelial function and high macrophage content are important criteria for plaque instability, VSOP-enhanced MRI could provide clinically important information on the composition and inflammatory status of atherosclerotic lesions and thus on the risk of destabilization.
Endothelial function is determined by shear forces generated by the flowing blood. Impaired laminar blood flow in vessel curvatures and bifurcation points contributes to endothelial dysfunction accentuating atherogenesis.7 In vitro and in vivo investigations suggest that the absence of laminar shear stress (LSS) results in an enhanced uptake of VSOPs by endothelial cells (ECs).3 The exact changes in EC biology caused by the absence of LSS that are responsible for the increased VSOP uptake are not known.
ECs are covered by the endothelial glycocalyx. The name glycocalyx refers to the cell membrane coating consisting of proteoglycans (PGs), glycosaminoglycans (GAGs) and glycolipids.8 The glycocalyx is assumed to interact with blood serum components that together with the cellular glycomolecules form the hydrogel-like endothelial surface layer.9 The ESL of each vessel type has unique characteristics that can significantly influence the behavior of the endothelium in both physiological and pathological states. It plays an important role in numerous physiological processes, such as preventing blood cells and platelets from attaching to the vessel wall and transmitting shear forces (mechanotransduction). The ESL serves as a selective permeable barrier that regulates the passage of material between the blood and underlying ECs. Dysregulation of ESL permeability is a critical step in the initiation and progression of atherosclerosis.10 It has been previously shown that a decrease in wall shear stress and an increase in local inflammation alter the structure, composition and permeability of the ESL in arteries.11 The changes of the ESL are a result of altered gene expression leading to a change in the 3D arrangement of PGs and associated GAGs on the EC surface.12,13 We hypothesize that the composition of the ESL influences the uptake of VSOP into the diseased tissue via the activated endothelium.
For nanoparticles to be internalized, they must initially navigate through the ESL. The passage of nanoparticles through the ESL relies not only on the inherent properties of the particles but also on the specific composition and thickness of the ESL. Investigating how specific compositional and structural alterations of the ESL influence the uptake of nanoparticles under varying shear stress conditions is challenging to examine in vivo. Therefore, an imperative need exists for a suitable in vitro model to examine the ESL in real-time under LSS in a native or near-native state.14
In this study, we investigated how the absence of LSS alters the composition, dimension and barrier function of the ESL in relation to the uptake of VSOPs. We present an in vitro experimental setup using quantitative particle exclusion assay (qPEA) to study the dimension and barrier function of the ESL of living ECs cultured under LSS using spinning disc confocal microscopy (SDCM). By combining gene expression analysis, flow cytometry, HPF/FS immuno-TEM, and CLSM, we were able to investigate LSS-induced changes in ESL composition. We identified collagen as a previously neglected component of the ESL that maintains physiological barrier function and influences the uptake of VSOPs.
Materials and Methods
Materials
Chemicals and solvents were obtained from Sigma-Aldrich, unless otherwise stated.
Fluorescent polystyrene spheres were passivated using a swelling-based method.15 Fluorescent Microspheres (Molecular Probes®, FluoSpheres®, Sulfate Microspheres, 1.0 µm, yellow-green fluorescent (505/515), 2% solids, Product No.: F8852, Thermo Fisher Scientific) were sonicated for 10 minutes with a Sonorex Digital 10 P Sonicator (Bandelin, Berlin, Germany) at 100% intensity and then mixed with 0.5 mL of a solution consisting of 180 mg Pluronic in 10 mL of water. Then, 10.5 µL of toluene was added, and the resulting mixture was vigorously mixed for 12 h and 30 min at room temperature using a Vortex-Genie 2 mixer (Scientific Industries, New York, USA). The mixture was transferred to a 20 mL glass beaker, heated to 90–95°C in a water bath, and the toluene was evaporated with a strong stream of air (duration about 10 min). The residue was reconstituted with water to a total volume of 2 mL. After thorough mixing, the particles were centrifuged at 5000 × g for 5 min and redispersed in 1 mL water. Subsequently, the FluoSpheres were washed five times by centrifugation at 2000 × g for 5 min and redispersed in 1 mL of water each time. The sedimented microspheres were suspended in 0.5 mL of deionized water.
VSOPs, with a diameter of ~7 nm, were obtained from the Institute of Radiology, Charité-Universitätsmedizin Berlin. A detailed description of the synthesis and characterization of VSOP was published previously.3
Halofuginone lactate (TargetMol Cat # T8785) was resuspended in dimethyl sulfoxide (DMSO) to a 10 mM concentration and stored at – 80 °C.
Endothelial Cell Cultivation and Treatments
Primary human umbilical vein endothelial cells (HUVECs) were isolated by digesting human umbilical veins with collagenase type II (Merck).16 HUVECs were cultivated in EC medium: MCDB 131 media (Gibco®, ThermoFisher Scientific, Waltham, MA, USA), supplemented with 2% (v/v) fetal calf serum (FCS, Biochrom, Berlin, Germany), 0.5 µL/mL basic fibroblast growth factor (Biomol, Hamburg, Germany), 5 U/mL heparin (Merck), 0.1 ng/mL epidermal growth factor (Biomol), 1 µg/mL hydrocortisone, 10 µL/mL streptomycin (ThermoFisher Scientific), 10 µL/mL L-glutamine (Thermo Fisher Scientific), and 4 µL/mL endothelial cell growth supplement (Promocell, Heidelberg, Germany) in a humidified incubator at 37 °C with 5% CO2 concentration. HUVECs were used until passage five. The use of HUVECs was in accordance with local institutional guidelines and the principles of the Declaration of Helsinki and was approved by the Charité University Hospital Ethics Committee. The umbilical cords were collected as a donation from healthy delivering women after obtaining informed consent.
For cultivation under flow conditions, the Ibidi unidirectional laminar flow pump system (Ibidi, Planegg, Germany) with the red perfusion set with an inner diameter of 1.66 mm and a length of 15 cm at 10 dyn/cm2 was used. 160,000–165,000 HUVECs were seeded into IbiTreat μ-slides I 0.8 Luer (Ibidi, Planegg, Germany). For immunogold labeling experiments, HUVECs were seeded into Ibidi sticky-slides I 0.8 Luer (Ibidi, Planegg, Germany) attached to gelatin-coated (0.2%) Aclar (200 µm thick, Plano). Before exposing cells to laminar flow, static cultivation was continued for an additional 3 h to allow for sufficient cellular adhesion. Afterwards, HUVECs were cultivated at either 0 (S-cultivated HUVECs) or 10 (LSS-cultivated HUVECs) dyn/cm2 for 72 h.
For HF treatment, HUVECs seeded into IbiTreat μ-slides were first cultivated under static conditions for 2 h with 25 nM HF in EC media with a 0.00025% DMSO concentration before being exposed to shear stress. HUVECs were readministered 25 nm HF every 24 h for the course of the flow experiment. To control for DMSO, a portion of HUVECs were administered 0.00025% DMSO every 24 h under LSS.
For siRNA transfections, 150,000–165,000 HUVECs were seeded into 6-well plates and cultured for 24 h in EC media. Then, cells were transfected in Opti-MEM (Gibco, Life Technologies) using OligofectamineTM (Invitrogen, Carlsbad, CA) with either a mixture of siRNAs against COL5A1 (siRNA ID: s3307) and COL5A2 (siRNA ID: s3310, Ambion®, Thermo Fisher Scientific) or a mixture of siRNAs against cluster of differentiation 44 (CD44) (siRNAs CD44: ID s2681, ID s2682, ID s2683; Ambion®, Thermo Fisher Scientific) according to the manufacturer’s protocol. HUVECs were transfected for a second time, 24 h after the first transfection. As a control, a portion of HUVECs were transfected with a non-targeting siRNA (SCR) (Silencer® Select negative control siRNA, Thermo Fisher Scientific). Cells transfected with siRNAs against COL5A1 and COL5A2 were seeded into IbiTreat μ-slides for flow cultivation 24 h after the second transfection. Cells transfected with siCD44 were seeded into ibiTreat μL-Slide 4-well chambers (4.8 × 10⁴ cells/well) 48 h after the second transfection and incubated overnight.
Quantitative Particle Exclusion Assay
Quantitative particle exclusion assay (qPEA) was performed on live endothelial cells adapting the method described by Chang et al 2016.17 HUVECs were preconditioned at 0 and 10 dyn/cm2 for 72 h. Live cell imaging under laminar shear stress was performed using a Nikon Spinning Disk Confocal CSU-X. Before imaging, nuclei were stained for 15 min with 0.5 µg/mL Hoechst 33342 (ThermoFisher Scientific) in EC media. Slides with preconditioned cells were connected to an Ibidi yellow-green perfusion set with an inner diameter of 1.6 mm and a length of 50 cm (Ibidi, Planegg, Germany) containing 13 mL of EC media. Next, 20 µL was taken from a sediment of passivated FluoSpheres and added to the Ibidi perfusion set. During imaging, HUVECs were perfused with a shear stress of 8 dyn/cm2. To allow for equal distribution of the particles, images were taken at least 5 min after adding the particles.
We used the nuclei as a reference point to construct a z-profile +40 µm above and −8 µm below the nuclei by acquiring a confocal stack with a step size of 0.3 µm using the 60x water immersion Plan Apo objective. 5–6 ROI was imaged per condition. After imaging the exclusion zone, cells were washed once with EC media and labeled for 5 min with Texas red-conjugated WGA (1 μg/mL; Molecular Probes, Eugene, OR, USA) in EC media to label the membrane and endothelial glycocalyx layer. WGA labeling was imaged under static conditions.
All z-profiles were measured from confocal stacks. The quantification was performed in an automated manner using a custom-written ImageJ macro (segmentation) and python script (z alignment via Hoechst signal), which can be found on GitHub (https://github.com/ngimber/Particle_Exclusion_Assay). Z-profiles in Figure 1e–g were measured above and below the segmented Hoechst region in 3D stacks. Segmentation (ImageJ): Nuclei were segmented from blurred (Gaussian blur, sigma = 3.4 µm) maximum projections of the Hoechst channels by histogram-based thresholding (Otsu binarization) and watershed segmentation of the Euclidean distance map of the binary image using ImageJ. Registration of z-profiles (Custom Python scripts): A custom python script was designed to register all z-profiles via the Hoechst peak intensity over z.
 |
Figure 1 The endothelial surface layer of endothelial cells cultivated under laminar shear stress contained an exclusion zone of several micrometers. Live HUVECs labeled by WGA (red) displaying the morphology after (A) LSS and (B) S cultivation for 72 h imaged by SDCM. Orthogonal images taken by SDCM of live (C) LSS- and (D) S- cultivated HUVECs perfused with passivated 1 µm-FluoSpheres (green) and afterwards labeled with WGA (red). (E-F) Graphs depict the mean WGA, Hoechst and FluoSphere signal over the z-dimension directly above the nuclei of live (E) LSS- and (F) S-cultivated HUVECs. (G) Line graph comparing mean FluoSphere signal in the ESL between LSS- and S-cultivated HUVECs over the z-dimension. Blue shading represents region with Hoechst signal and red shading WGA signal. Mean ± SEM; n = 3. Paired two-tailed t-test on the relative intensity increase of FluoSphere signal above the nucleus: *P < 0.05. X-axes begin at maximum Hoechst signal and end 20 µm above maximum Hoechst signal. (H) Schematic of particle exclusion conducted under perfusion in LSS- and S-cultivated HUVECs. Perfused FluoSpheres are shown in green. Red color represents the region labeled by WGA, zone 1, and blue the nucleus. Zone 1 (Z1) represents the region labeled by WGA and Zone 2 (Z2) the region not labeled by WGA. Scale bar = 10 µm. |
All images were processed using the software package ImageJ unless otherwise stated (courtesy of W.S. Rasband, US National Institute of Health, Bethesda, Maryland using Fiji plugin).18
Gene Expression Analysis
For microarray analysis, cell pellets from five different donors, each grown at 0 and 10 dyn/cm2 for 72 hours, were sent to OakLabs (Hennigsdorf, Germany). Total RNA was isolated from HUVECs using a NucleoSpin™ RNA Plus kit (Macherey-Nagel, Germany). RNA quality control was performed with a 2100 Bioanalyzer (Agilent Technologies, Santa Clara, CA, USA). The Low Input QuickAmp Labeling Kit (Agilent Technologies, Santa Clara, CA, USA) was used to generate fluorescent complementary RNA (cRNA). Random oligo-dT primers were used for first-strand synthesis. After second-strand synthesis, in vitro transcription for synthesis of cRNA labelled with cyanine 3-deoxyuridine triphosphate was performed. Labelled cRNA was hybridized on an OakLabs 8x60K ArrayXS Human Agilent microarray (design 79,407), using an Agilent Gene Expression Hybridization Kit (Agilent Technologies, Santa Clara, CA, USA). Fluorescence signals were detected by a SureScan Microarray Scanner (Agilent Technologies, Santa Clara, CA, USA) at a resolution of 3 μm to generate 20-bit TIF files. The Agilent Feature Extraction Software v.11 (Agilent Technologies, Santa Clara, USA) was used for raw image file-based data extraction. The resulting raw data were analyzed using DirectArray Software (OakLabs, Hennigsdorf, Germany). Heat map was created using the Morpheus analysis software, and volcano plot was generated using Prism, software version 8 (GraphPad, San Diego, California, USA).
For quantitative PCR, RNA was extracted from HUVECs using the RNeasy® Mini Kit (QIAGEN, Hilden, Germany) according to the RNeasy Mini Kit Quick-Start Protocol (Qiagen). Genomic DNA was removed from lysates with DNaseI, and RNA was reverse transcribed using the high-capacity cDNA Reverse Transcription Kit (Applied Biosystems, Thermo Fisher Scientific). To quantify gene expression, TaqMan assays (Supplementary Table 1) (Applied Biosystems, Thermo Fisher Scientific) were used with the 7300 Real Time PCR System (Applied Biosystems, Thermo Fisher Scientific).
Western Blotting
After 72 h cultivation in IbiTreat μ-slides under LSS and S conditions, cells were washed with phosphate-buffered saline (PBS) and lysed with ice cold 2x RIPA buffer (4x RIPA buffer: 2% NA-Sodium deoxycholate, 200 mM Tris pH 7.5, 600 mM NaCl, 4% NP-40, 2% SDS in dH2O) with protease inhibitors (complete, Mini Protease Inhibitor Cocktail, Merck). To avoid protein dilution, 110 µL of 2x RIPA buffer was added to one slide on ice, and the lysate was then transferred sequentially to additional IbiTreat μ-slides resulting in a pool of lysate with a relatively small volume. Lysates were centrifuged at 12,000 g for 20 min at 4 °C. Protein concentration was measured by using a bicinchoninic acid (BCA) assay (Pierce BCA Protein Assay Kit, Life Technologies). Total protein (30 µg for collagen type I alpha 2 (COL1A2) and 10 μg for COL5A2 per lane) were separated by gradient SDS-PAGE gels (4%–12% Tris-glycine gradient gel, Novex, Life Technologies) and transferred to PVDF membranes via semi-dry blotting. Blots were blocked for 1 h with 5% milk powder dissolved in 1x Tris buffered saline, 0.1% Tween 20 solution (MP-TBST) at room temperature (RT). Next, membranes were probed overnight at 4 °C with the following primary antibodies: rabbit anti-COL1A2 (Abcam #96723) and mouse anti-COL5A2 (Origen Clone ID: #OT12H3). Primary antibodies were suspended in MP-TBST. This was followed by overnight incubation at 4 °C with the respective secondary antibodies conjugated with horseradish peroxidase (HRP) suspended in MP-TBST (mouse anti-rabbit and goat anti-mouse Santa Cruz). Signal was detected with ECLplus (GE Healthcare, Germany) using the Fusion Solo (Vilber Lourmat). Afterwards, membranes were stained with Amido black to check for equal sample loading and protein transfer.
To control for FCS derived collagen, we processed 10% FCS in a similar way and probed for COL1A2 and COL5A2 (Supplementary Figure 1).
Flow Cytometry
Expression of CD44 was measured using a CyAN-ADP flow cytometer (Beckman Coulter). HUVECs were collected in polypropylene test tubes and centrifuged. Cells were re-suspended in 1 mL EC medium and incubated with FITC coupled antibodies targeting human CD44 (dilution 1:1000, CD44 rat monoclonal antibody IM7, eBioscience, Invitrogen, Thermo Fisher Scientific) in the dark for 15 min on ice. Summit 4.3 software was used to analyze the data.
Preservation of Human Umbilical Vein Endothelial Cells
Before fixation, HUVECs were cultivated for 72 h under LSS and S conditions.
Formaldehyde Fixation
HUVECs were washed with PBS and fixed for 10 min at room temperature with 4% formaldehyde (w/v) in PBS (Roti®-Histofix, Carl Roth, Karlsruhe, Germany). Cells were rinsed with 1 mL PBS afterwards.
High Pressure Freezing and Freeze Substitution
One hour before freezing, cells were incubated with Gibco Dulbecco’s Modified Eagle Medium (DMEM) supplemented with 10% FCS, 100 U/mL penicillin, and 100 μg/mL streptomycin (Invitrogen) or EC media with 10% FCS. Only samples labeled with anti-COL5A2 and imaged by CLSM were incubated with DMEM media supplemented with only 1% bovine serum albumin for 1 h. Pieces of gelatin coated Aclar or IbiTreat polymer coverslips containing HUVECs were cut out of the bottom of cultivation µ-slides (Ibidi). Substrate was cut to fit into a 300 µm indented aluminum carrier (Specimen carriers: Ø 6.0 × 0.5 mm Type B, Nr.16770127, Leica) with cells facing upwards. The carrier was filled with the corresponding media and closed with the flat side of an aluminum carrier. Samples were frozen with a Leica EM ICE High Pressure Freezer (Leica, Wetzlar, Germany) after reaching 2100 bar under liquid nitrogen (Studer et al 2008). Directly after HPF, samples were freeze substituted starting at –90 °C in FS-cocktails specifically prepared for TEM or immuno-TEM and CLSM as previously described.19
Immunolabeling and Microscopy of Human Umbilical Vein Endothelial Cells
Fluorescence Phase Contrast Microscopy
Formaldehyde fixed HUVECs were stained for 15 min in the dark with FITC labeled antibodies targeting human CD44 (dilution 1:1000, CD44 rat monoclonal antibody IM7, eBioscience, Invitrogen, Thermo Fisher Scientific). Nuclei were stained with 1 µg/mL 4′,6-diamidin-2-phenylindole (DAPI) for 10 min in the dark. Samples were imaged using a Keyence BZ-X810 microscope.
Confocal Laser Scanning Microscopy
HUVECs fixed with 4% phosphate buffered formaldehyde were washed with PBS and incubated overnight at 4 °C with primary antibodies in PBS for CLSM analysis. The next day, antibodies were removed, and HUVECs were washed with PBS before adding secondary antibodies. Secondary antibodies were incubated overnight at 4 °C in PBS in the dark. Nuclei were stained in the dark with 1 µg/mL DAPI for 10 min. Shortly before imaging, cells were labeled for 12 min with Texas red conjugated WGA (2 μg/mL; Molecular Probes, Eugene, OR) in the dark. Orthogonal images were taken every 0.25 µm, +10 µm above and –5 µm below the nucleus, at 60x in water immersion.
After HPF, a portion of samples were incubated in FS-cocktails for immuno-CLSM processing. HUVECs were rehydrated and immunolabeled according to the protocol by Twamley et al.19 Processed polymer coverslips were placed in the center of a 4-well glass bottom µ-slide (Ibidi) with a small drop of PBS to avoid floating and imaged at 40x in water immersion (WI Apo LWD DIC N2 λS, working distance 590–610 µm). Orthogonal images were centered around the nucleus with a step size of 0.5 µm.
HUVECs were imaged with a Nikon laser scanning confocal A1Rsi+ microscope with a scan size of 1024 pixels × 1024 pixels at ¼ frames/second. Images were processed with ImageJ software package. 3D-rendering and movie export was done using Arivis Vision4D.
Primary antibodies at a dilution of 1:100: Rabbit IgG polyclonal anti-COL1A2 (Abcam; #96723) and rabbit IgG polyclonal anti-COL5A2 (Thermo Fisher Scientific; #PA5-3880).
Secondary antibodies at a dilution of 1:500: Goat anti-rabbit/IgG (H + L) Alexa Fluor 488 (ThermoFisher: A-11008).
As a negative control, primary antibodies were omitted (Supplementary Figure 2). Culture media supplemented with 10% FCS was processed in parallel and immunolabeled for COL1A2 and COL5A2 for CLSM analysis (Supplementary Figure 1).
Electron Microscopy
For immuno-TEM, we combined HPF/FS-RH and pre-embedding immunogold labeling according to the protocol described previously by Twamley et al19 to identify the localization of COL1A2 and COL5A2 in HUVECs. For a comprehensive list of the primary antibodies, including their characteristics, dilution and source, please refer to Supplementary Table 2. All samples were flat-embedded in epoxy Epon resin, then transversally re-sliced and re-embedded also in Epon. Finally, 60 nm ultrathin sections from 3 to 5 repeated experiments were examined using a Zeiss TEM-900 equipped with a digital camera (Proscan 2K Slow-Scan CCD-Camera, Zeiss, Oberkochen, Germany) and ImageSP Software for electron microscopy (The TRS company, Moorenweis, Germany). Samples were processed without primary antibodies as a negative control (Supplementary Figure 2).
VSOP Uptake Assay
For HUVECs treated with HF or siCOLV, cells were perfused with VSOPs at a concentration of 0.75 mM for 3 h at 10 dyn/cm2. For HUVECs treated with siCD44, cells were incubated with 0.5 mM VSOPs for 1 h in EC media at 0 dyn/cm2. VSOP uptake was visualized by Prussian blue staining. HUVECs were fixed with formaldehyde and stained with 2% (w/v) potassium ferrocyanide in 1% (v/v) HCl for 15 min. After staining, samples were rinsed with distilled water. Five to six images per slide/well in predefined ROI were captured with a Keyence BZ-X810 microscope. VSOP uptake was calculated as the percentage of Prussian blue stained area per ROI. For HUVCEs treated with HF or siCOLV, a customized CellProfiler pipeline, which can be found on GitHub (https://github.com/HectorSaIb/Prussian-blue-stained-area-quantification) was used. For HUVECs treated with siCD44, Prussian blue stained areas were measured using ImageJ (NIH).
Animal Studies
All animals were conducted under protocol number 20–0835R, approved by Northeastern University Institutional Animal Care and Use Committee (NU-IACUC). Northeastern University’s animal care and use program is AAALAC accredited, has an assurance with OLAW, and is registered with the USDA. They follow the Guide for the Care and Use of Laboratory Animals, the Welfare Act, and IACUC established policies and guidelines for the care and use of laboratory animals. Five- to six-week-old, male C57BL/6-background wild-type (WT) mice were obtained from Jackson Laboratories. An acclimation period of one week was given to each mouse, where they were fed a regular chow diet and water ad libitum. Mice were subject to a left carotid artery (LCA) partial ligation surgery to induce acute disturbed blood flow patterns, which accelerates endothelial dysfunction and EGL degradation as previously shown.11,20,21 The right carotid artery (RCA) was not ligated to provide a control vessel in each mouse. Mice were sacrificed via exsanguination after the one-week acclimation period or one-week post-ligation surgery, as previously described.11 Tissue fixation was performed by gravitational perfusion with phosphate buffer saline (PBS) (Ca2+/Mg2+) containing 6.7% bovine serum albumin (BSA) followed by 2% paraformaldehyde (PFA) in PBS. The descending aorta (uniform blood flow, corresponding to the LSS used for the cell culture studies), RCA (uniform blood flow, corresponding to the LSS used for the cell culture studies), and LCA (acute disturbed blood flow) were then isolated and dissected for histology. Mouse tissue vessels were embedded in OCT blocks and transversely serial-sectioned into rings of 6 µm in thickness, as previously described.11
To detect collagen V on the surface of mouse ECs, we stained the 6-µm-thick sections of the descending aorta, LCA and RCA with anti-COL5A2 (Thermo Fisher Scientific; #PA5-38,880). First, tissue samples on glass microscope slides were post-fixed with cold acetone and washed extensively (via three 5-minute wash cycles). Samples were then blocked in 10% goat serum for 1 h at RT in a humidified chamber. COL5A2 primary antibody at a 1:50 dilution in blocking solution was added to the slides in a humidified chamber for 2 days at 4°C. Following this incubation, samples were incubated with HRP-conjugated goat anti-rabbit at a 1:250 dilution in a humidified chamber for 1.5 h at room temperature. Samples were then extensively washed with 0.1% Tween in PBS and incubated with Akoya Biosciences’ TSA Cyanine 3 amplification system kit (Part No. NEL704A001KT) for 5 min. Finally, slides were thoroughly washed again with PBS containing 0.1% Tween and mounted using Vector Laboratories’ Vectashield mounting medium, containing DAPI to highlight cell nuclei. Slides were sealed with microscope slide sealant. Sections were imaged with a Zeiss LSM 800 laser scanning confocal microscope.
Statistics
All statistical analysis and graphing were conducted using Prism, software version 8 (GraphPad, San Diego, California, USA).
For qPEA, data were 0–1 normalized, pooled by calculating the mean from all cells per experiment and plotting the mean and SEM of all experiments from one condition. The relative intensity increase of normalized FluoSphere signal in the ESL between LSS- and S-cultivated HUVECs was tested by applying a two-tailed paired t-test to the mean intensity from all planes above z = 0 after 0–1 normalization. *P < 0.05, n = 3 different donors.
For microarray examination, data were quantile normalized and Log2 transformed before statistical analysis. Comparison between LSS- and S-cultivated HUVECs was performed by a paired t-test using a multiple comparisons false discovery rate (FDR > 8%) with a two-stage step-up (Benjamini, Krieger, and Yekutieli) method. An individual variance for each group was applied.
For qRT-PCR, gene expression was quantified using the comparative ΔΔCt analysis (2-ΔΔCt). Target gene expression in HF treated HUVECs, LSS- and S-cultivated HUVECs was normalized to the housekeeping gene actin beta (ACTB). CD44 gene expression was normalized to ribosomal protein L19 (RPL19). For siCOLV-treated HUVECs, target gene expression was normalized to TATA-box binding protein (TBP). Data were analyzed by a two-tailed ratio paired t-test*P < 0.05 and **P < 0.01. Mean shown as ± SD, n = 3–4.
For flow cytometry and particle uptake assay, data were analyzed by a two-tailed ratio paired t-test*P < 0.05 and **P < 0.01. Mean shown as ± SD, n = 5 (HF), n = 4 (siCOLV) and n = 3 (siCD44).
Results
Laminar Shear Stress Stimulation Extended the Exclusion Zone of the Endothelial Surface Layer
To estimate the dimension of the ESL of live HUVECs grown under LSS and static conditions, we used SDCM for real-time qPEA (Figure 1). We used FluoSpheres in the media to obtain a negative stain of the ESL by size exclusion. Figure 1A-B displays the morphology of HUVECs after LSS (LSS-cultivated) and static cultivation (S-cultivated) for 72 h by staining with wheat germ agglutinin (WGA). HUVECs cultivated under LSS for 72 h at 10 dyn/cm2 elongated and reoriented in the direction of the flow typical for long-term flow stimulation. This morphology was observed in all HUVECs cultivated under LSS. Orthogonal images of LSS-cultivated HUVECs perfused with 1 µm passivated FluoSpheres revealed a distinct dark zone poor in particles several microns thick above the nucleus (Figure 1C), which was not present in S-cultivated HUVECs (Figure 1D). Quantification of fluorescence signals revealed that FluoSphere signal in the WGA positive region of LSS-cultivated HUVECs was extremely low. Beyond the WGA-stained region, FluoSphere signal gradually increased and then plateaued at ~13 µm above the maximum DAPI signal (Figure 1E). Comparable to LSS-cultivated HUVECs, minor amounts of particle signal were detected in the WGA-stained region of S-cultivated HUVECs. However, particle signal plateaued already at ~5 µm above the maximum DAPI signal (Figure 1F). Figure 1G shows the direct comparison of FluoSphere signals of LSS-cultivated and S-cultivated HUVECs. The mean relative intensity increase of FluoSphere signal above the nucleus signal was significantly lower in LSS-cultivated HUVECs compared to S-cultivated HUVECs (Figure 1G). There was no difference in either the intensity or the z-dimension of the WGA fluorescence between LSS- and S-cultivated HUVECs, indicating a similar density and thickness of the sugar-rich region of the ESL.
In summary, in LSS-cultivated HUVECs, we observed exclusion of FluoSpheres beyond the region stainable with WGA, indicating an expanded region of particle retention compared to S-cultivated HUVECs (Figure 1H).
Laminar Shear Stress-Induced Differential Expression of Extracellular Matrix Molecules
To understand how LSS stimulation alters the expression of extracellular matrix (ECM) genes, we analyzed the differential gene expression of HUVECs from five different donors conditioned at 10 dyn/cm2 or 0 dyn/cm2 with a genome-wide micro array. Out of 211 selected ECM genes we identified 61 differentially expressed ECM-associated genes with a significance of P ≥0.05 (gene list in Supplementary Table 3). The heat map shown in Figure 2A depicts 40 of the statistically significant differentially expressed genes with a false discovery rate of <8% from each individual donor. The volcano plot displays the q-value versus the log2fold change for the selected ECM genes in the group of LSS-cultivated HUVEC, relative to the group of S-cultivated HUVEC (Figure 2B). As expected, NOS3, a well-described shear-stress responsive gene,22 was upregulated in LSS-cultivated HUVECs (Figure 2A and B).
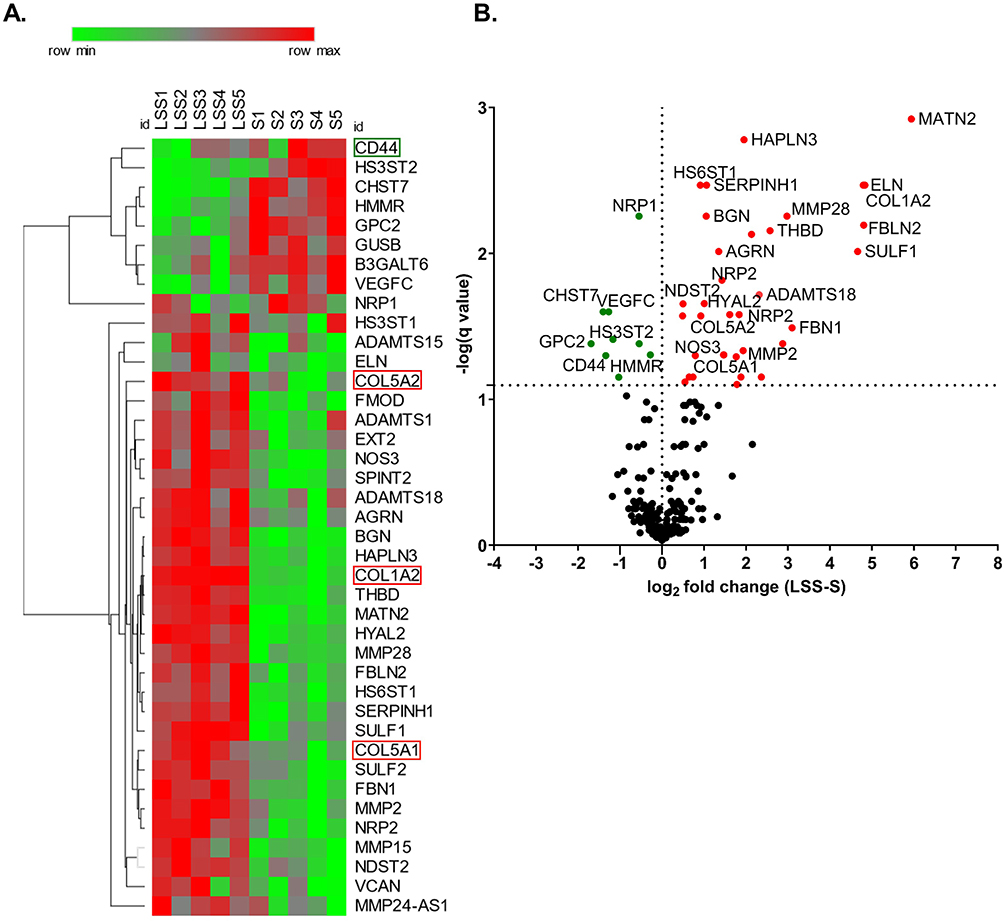 |
Figure 2 Laminar shear stress stimulation altered the expression of extra cellular matrix components. (A) Heat map shows statistically significant differentially expressed ECM genes at >8% false discovery rate (FDR) from each S- and LSS-cultivated HUVEC. ECM genes of particular interest are highlighted. (B) Volcano plot depicts the q-value over the log2 fold change between the LSS-cultivated HUVEC group and the S-cultivated HUVEC group. Data analyzed by a paired t-test using a multiple comparisons false discovery rate (FDR) with a two-stage step-up (Benjamini, Krieger, and Yekutieli) method, q < 0.08. n = 5. |
Suppression of Cluster of Differentiation 44 Under Static Conditions Did Not Reduce the Uptake of Very Small Superparamagnetic Iron-Oxide Nanoparticles
Among the LSS-induced down-regulated ECM molecules, CD44 drew our attention. Previous studies suggested that glycosaminoglycans such as hyaluronic acid (HA) have a strong affinity for citrate-coated nanoparticles.23 Because CD44 is an endocytic HA receptor used for targeted uptake of HA-coated nanoparticles into atherosclerotic lesions,24 we tested the hypothesis that overexpressed CD44 is involved in the increased uptake of VSOP in HUVECs grown under static conditions.
First, we confirmed the shear-stress dependent regulation of CD44 expression. Fluorescence microscopy displayed that S-cultivated HUVECs had a higher density of CD44 compared to LSS-cultivated HUVECs (Figure 3A). This observation was verified by RT-qPCR (Figure 3B) and flow cytometry (distribution curves) (Figure 3C). Both CD44 mRNA and protein levels in S-cultivated HUVECs were significantly higher than in LSS-cultivated HUVECs (Figure 3B and C).
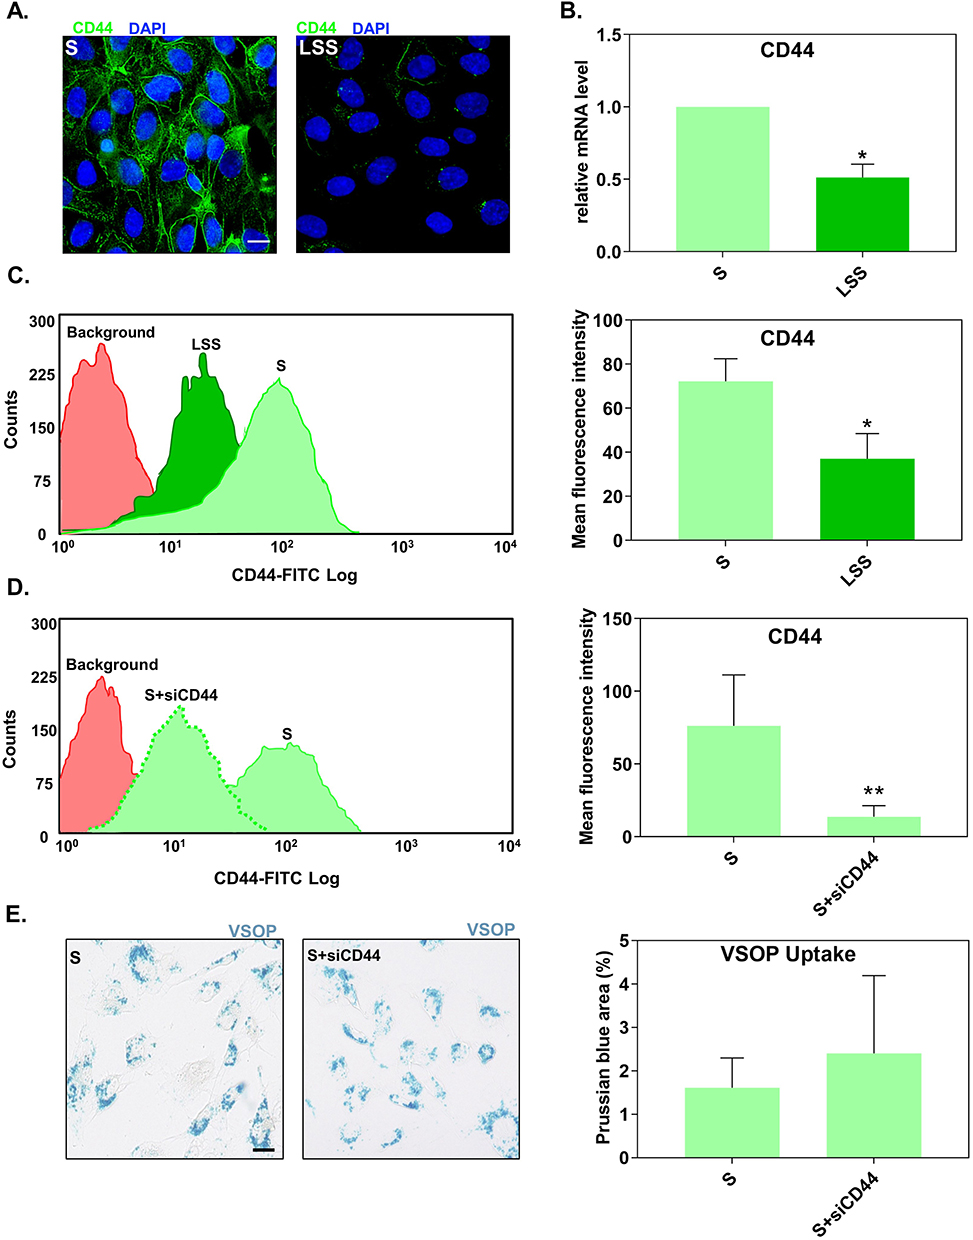 |
Figure 3 Suppression of CD44 expression did not alter the uptake of VSOP by S-cultivated HUVECs. (A) Fluorescence microscopy images showing the distribution of CD44 (green) in S- and LSS-cultivated HUVECs. Nuclei shown in blue. Scale bar = 20 µm. (B) CD44 mRNA gene expression in S- and LSS-cultivated HUVECs measured by RT-qPCR. Gene expression was normalized to the housekeeping gene RPL19. Relative mRNA expression levels were calculated using the comparative ΔΔCt analysis (2−ΔΔCt). (C) Flow cytometry measured membrane CD44 protein expression in S- and LSS-cultivated HUVECs. (D) Expression of CD44 surface protein in S-cultivated HUVECs treated with siRNAs against CD44 (siCD44) measured by flow cytometry. (E) Uptake of VSOPs by S-cultivated HUVECs treated with siCD44. Uptake was determined as the percentage of Prussian blue stained area per ROI. Data are presented as mean ± SD. n = 3–4. *P < 0.05 and **P < 0.01 LSS vs S by ratio paired t-test. |
We next tested if higher levels of CD44 in S-cultivated HUVECs, relative to LSS-cultivated HUVECs, are responsible for the increased uptake of VSOPs in HUVECs. To confirm this, S-cultivated HUVECs treated with siRNA against CD44 (siCD44) were incubated with VSOPs and analyzed for particle internalization. Flow cytometry confirmed the successful reduction of CD44 in S-cultivated HUVECs after siRNA transfection. HUVECs treated with siCD44 significantly reduced the expression of CD44 compared to untreated S-cultivated HUVECs (Figure 3D). SiRNA-mediated downregulation of CD44 had no impact on the internalization of VSOP by S-cultivated HUVECs as measured by Prussian blue staining (Figure 3E).
Suppression of Laminar Shear Stress-Induced Collagen Type I and V Expression Facilitated the Internalization of Very Small Superparamagnetic Iron-Oxide Nanoparticles
We found several ECM structural proteins present in the LSS-induced upregulated ECM molecules: fibrillin-1 (FBN1), elastin (ELN), COL1A2, COL5A1, COL5A2 and matrilin-2 (Figure 2A and B). We searched the literature for evidence of a relationship between endothelial secretion of these ECM structural proteins, expression regulated by shear stress, and localization on the EC surface and found such evidence for COLI and COLV.
We confirmed by qRT-PCR using mRNA collected from four donors that COL1A2, COL5A1, and COL5A2 were upregulated by LSS (Figure 4A). Western blotting showed that the protein level of COL1A2 and COL5A2 was higher in HUVECs stimulated by LSS compared to S-cultivated HUVECs (Figure 4B and C).
 |
Figure 4 Suppression of the upregulated expression of collagen under laminar shear stress increased the uptake of VSOPs. (A) Gene expression of COL1A2, COL5A1, and COL5A2 in S- and LSS-cultivated HUVECs measured by RT-qPCR. Gene expression was normalized to the housekeeping gene ACTB. *P < 0.05 and **P < 0.01 LSS vs S by a ratio paired t-test. n = 4. (B) COL1A2 and (C) COL5A2 protein levels in untreated S- and LSS-cultivated HUVECs detected by Western blotting. Amido black staining shows equal loading. (D-G) Relative mRNA gene expression (measured by qRT-PCR) and VSOP particle uptake by LSS-cultivated HUVECs treated with (D and E) HF or (F and G) siRNAs against COL5A1/COL5A2. (E) and (G) Prussian blue stained VSOPs are shown as blue clusters around and within formaldehyde fixed cells. Particle uptake was measured by the percentage of Prussian blue stained area per ROI. For each experiment, 6 ROI per treatment were taken. Scale bar = 20 μm. (D and F) For gene expression analysis, relative target gene fold change (shown as 2-ΔΔC) was calculated using the comparative ΔΔCt analysis. For VSOP uptake n = 5 (HF) or n = 4 (siCOLV). Target Gene expression was normalized to the housekeeping gene ACTB for HF-treated HUVECs and TBP for siCOLV-treated HUVECs. n=3. (D-G) Data are presented as mean ± SD. *P < 0.05 and **P < 0.01 (D-E) LSS+HF or (F-G) LSS+siCOLV vs LSS by a ratio paired t-test. |
To inhibit collagen expression, we treated HUVECs with the inhibitor halofuginone lactate (HF) under LSS. HF was shown to potentially interfere with transforming growth factor beta (TGF-β)/Suppressor of Mothers against Decapentaplegic-3 (SMAD3) signaling and is known to prevent the expression of collagen type I.24,25 HF treatment under LSS significantly inhibited the upregulated mRNA expression of both COL1A2 (COLI) and COL5A2 with high efficiency (Figure 4D). The mRNA expression of COL5A1 and NOS3 were not affected by HF treatment (Figure 4D). HF treatment leads to an increased uptake of VSOP, as measured by Prussian blue staining (Figure 4E).
Next, we treated HUVECs with siRNAs against COL5A1 and COL5A2 (siCOLV) to specifically prevent the LSS induced upregulated expression of COLV. The siRNA treatment significantly prevented the upregulated expression of both COL5A1 and COL5A2 (COLV) under LSS as measured by RT-PCR (Figure 4F). The siRNA treatment did not affect the expression of NOS3 and COL1A2 (Figure 4F). After perfusing siRNA treated cells with VSOP, we quantified particle internalization by staining for Prussian blue. Silencing COL5A1 and COL5A2 gene expression significantly increased the uptake of VSOP (Figure 4G).
Treatment with HF and siCOLV of LSS-cultured HUVECs significantly increased the uptake of VSOPs, but not to the same extent as in the absence of LSS (Supplementary Figure 3).
Collagen Type I Alpha 2 and Collagen Type V Alpha 2 Were Detectable in the Endothelial Surface Layer
We next tested if COL1A2 and COL5A2 are detectable components of the ESL of HUVECs. Figure 5A and B shows the distribution of Texas red-conjugated WGA, COL1A2 and COL5A2 signal detected by CLSM from LSS- and S-cultivated HUVECs after formaldehyde fixation. Collagen signal appeared as dots detectable in various regions of the cell, while WGA signal was strictly localized above the nucleus in the apical extracellular region. Notice even after formaldehyde fixation, the signal distribution of WGA appeared similar to that of live cells (Figure 1C-D). WGA colocalized with apical COL1A2 and COL5A2 signal, represented by the yellow coloring (Figure 5A and B). Signal colocalization of WGA with COL1A2 and COL5A2 was visible in LSS- and S-cultivated HUVECs.
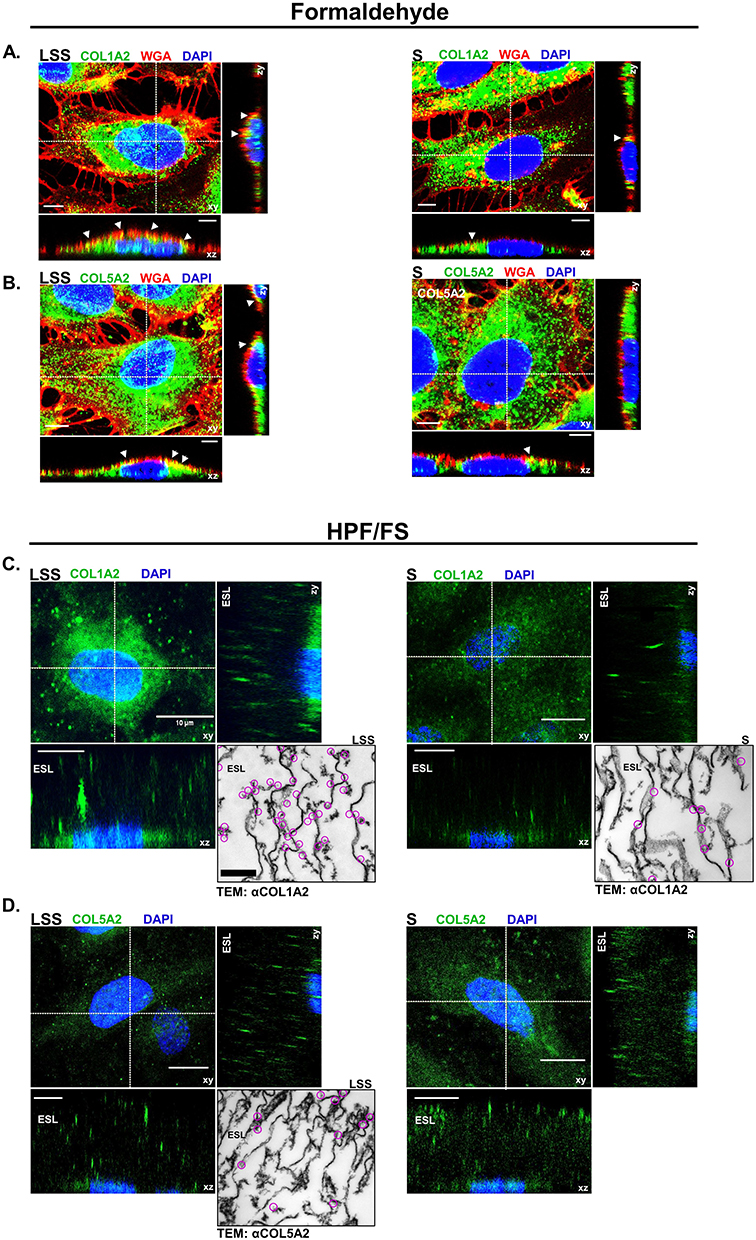 |
Figure 5 Collagen was detected on the apical surface of HUVECs. (A) CLSM images showing COL1A2 (green) and (B) COL5A2 (green) colocalization (yellow) with WGA (red) on the apical surface of formaldehyde fixed LSS- and S-cultivated HUVECs. Nuclei are shown in blue. White arrows indicate areas of colocalization (yellow) along the apical membrane. Scale bar = 5 µm. (C) CLSM image depicts COL1A2 (green) in the ESL of cells after HPF/FS. Orthogonal images display COL1A2 above the nuclei (blue) in the ESL. Inset shows TEM image of immunogold labeling for COL1A2. Clusters of gold-particles are marked by magenta circles. (D) COL5A2 (green) in the ESL of cells after HPF/FS. Orthogonal images display COL5A2 above the nuclei (blue) in the ESL. Scale bar = 10 µm. Inset shows TEM image of immunogold labeling for COL5A2. Clusters of gold-particles are marked by magenta circles. Scale bar = 1 µm. |
To preserve the full dimension of the ESL in a near native state for immuno-labeling and CLSM analysis, we applied a combined HPF/FS-RH protocol.19 Orthogonal image reconstruction revealed fluorescent signals for COL1A2 (Figure 5C) and COL5A2 (Figure 5D) on the apical side of HUVECs over a dimension ranging between 10 and 30 µM, in LSS and S-cultivated HUVECs. 3D image projections revealed that COL5A2 labeling occurred mainly in the upper regions of the ESL, whereas COL1A2 labeling was observed more uniformly throughout the ESL of LSS- and S-cultured HUVECs (Supplementary video 1, Supplementary video 2, Supplementary video 3 and Supplementary video 4). Taken together, immunolabelling after formaldehyde fixation and HPF/FS-RH provided evidence for localization of COL1A2 and COL5A2 on the apical side of the HUVECs (Figure 5). TEM after immunogold labelling showed that COL1A2 in LSS- and S-cultivated HUVECs was detectable (Figure 5C). COL1A2 labeling in LSS-cultivated HUVECs was distributed near string-like structures and along the plasma membrane. In S-cultivated HUVECs, we observed less COL1A2 labeling. The distribution pattern of COL1A2 was different compared to COL5A2 in the ESL of LSS-cultivated HUVECs. COL5A2 labeling was mostly scattered in the middle and upper regions of the ESL (Figure 5D). An overview of immuno-TEM images is shown in Supplementary Figure 4.
We stained sections of mouse vessels fixed via paraformaldehyde from perfused mice ex vivo with antibodies against COL5A2 to identify if we could detect collagen V on the apical surface of ECs (Figure 6). Immunofluorescence indicated the presence of COL5A2 (red) on the apical surface of the endothelium from sections of the descending aorta (Figure 6A) and RCA (Figure 6B), which were both exposed to uniform flow corresponding to the LSS conditions of the cell culture studies. Sections from the LCA, which was exposed to acute disturbed flow induced by reconstructing the artery via partial ligation, appeared to show minimal signal of COL5A2 (Figure 6C) when compared to vessels exposed to uniform flow (descending aorta and RCA). We also observed different COL5A2 expression in different vessel types that are exposed to uniform flow as demonstrated between descending aorta (Figure 6A) and right carotid artery (Figure 6B). Green auto fluorescence from elastin signifies the intact vessel walls of the preserved tissue.
 |
Figure 6 Collagen type V alpha 2 was detectable in mouse vessels on the apical surface of endothelial cells. CLSM detection of COL5A2 (red) on the apical surface of the endothelium in histological sections of mouse uniform flow conditioned vessels, (A) descending aorta and (B) right carotid. (C) Minor COL5A2 (red) signal was observed in the acute disturbed flow conditioned LCA. Nuclei shown in blue. Auto-fluorescence from elastin (green) was imaged to identify vessel wall. Scale Bars = 20 μm. |
Discussion
In this study, we demonstrated that different hemodynamic cultivation conditions affect the uptake of VSOPs into ECs by altering the composition, dimension, and barrier function of the ESL. By combining SDCM with the Ibidi pump system we were able to estimate the dimension of the ESL using qPEA in living ECs under LSS. In this way, we identified two distinct zones within the ESL: an inner, less permeable layer stainable by WGA, and, in LSS-cultivated HUVECs, an outer, more permeable layer not stainable by WGA. We found that the increased expression of CD44 in the absence of shear stress does not affect the uptake rate of VSOPs. By evaluating LSS-induced changes of the ESL, we uncovered COLI/V as previously neglected components that contribute to improved barrier function, thereby influencing the uptake of VSOP.
Only few in-vitro models to study the ESL under physiological shear stress conditions in real-time for live cell imaging exist.14 Using a modified qPEA under LSS, we found that WGA only partially labels the ESL, although it is commonly assumed to label the ESL both in vitro and in vivo. LSS-cultivated HUVECs contained an additional (~8 µm thick) exclusion zone not labeled by WGA which was also observed by Tsvirkun et al,26 who perfused endothelialized microchannels with red blood cells (RBCs). Our findings support the idea of a bi-layer ESL as suggested by Curry et al,9 proposing that the ESL is composed of an inner 200–300 nm dense mesh-like proteoglycan and glycosaminoglycan layer covalently bound to the plasma membrane (EGL) and an outer porous more penetrable gel-like layer consisting of proteins. Given that we observed FluoSphere exclusion beyond WGA staining in HUVECs cultured under LSS suggests that LSS stimulation mainly modifies the exclusion properties of the outer ESL, poor in sugars.
Nevertheless, we could not ignore the fact that we detected an increased expression of the hyaluronan receptor CD44 in HUVEC grown in the absence of LSS. Many studies have linked an upregulated CD44 expression to inflammation in atherosclerosis.27 HA was suggested to competitively absorb citrate coated gold nanoparticles by trans-chelation23 and the adhesion molecule CD44, was shown to internalize HA coated magnetic nanoparticles in atherosclerotic lesions.24 Therefore, we tested if the increased amount of CD44 was the underlying cause of the increased uptake of VSOPs by S-cultured HUVECs. However, experiments with siRNA-mediated silencing did not provide evidence for CD44 involvement in VSOP internalization. This reinforced our hypothesis that the ESL, particularly the region beyond the WGA stainable zone, regulates the accessibility of the membrane to VSOPs.
We found that laminar shear stress stimulation upregulated the expression of structural proteins such as FBN1, ELN, COL1A2, COL5A1, COL5A2 and matrilin-2. Except for collagen, we could not find evidence for localization on the apical endothelial surface for any of these proteins in the literature. COLI28,29 and COLV29 were detected in the secretome of HUVECs, and the expression of COLV was shown to be regulated by shear stress in human fibrosa aortic valve ECs.30 Early reports have also shown the presence of COLV on the apical surface of ECs.31,32 Additionally, COLV has been described as non-thrombogenic.33 We confirmed by qRT-PCR and Western blotting that COLI and COLV are upregulated by LSS in HUVECs and were able to detect both types of collagens on the apical surface of HUVECs. Immuno-CLSM and -TEM of the ESL of HUVECs fixed by HPF/FS enabled us to visualize the spatial contribution of collagen in the ESL. CLSM orthogonal image reconstruction displayed signals for COL1A2 and COL5A2 within the ESL with dimensions ranging between 10 and 30 μM (Figure 5C and D). Immuno-TEM images confirmed the presence of COL1A2 and COL5A2 within the ESL. Images show gold particles between string-like structures (Figure 5C and D). These string-like structures, some of which appear to be attached to the plasma membrane, were in accordance with previous observations.34 However, media frozen without cells displayed similar string-like structures, suggesting that these structures might be structural artifacts (data not shown). There was an additional source of uncertainty in our observations, since HUVECs were frozen in culture media supplemented with 10% FCS as a cryoprotectant during HPF. FCS has a ~7% protein concentration, and more than half of this is albumin. Albumin is an absorbed component of the ESL35–37 and was shown to be necessary to stabilize the ESL during cryopreservation.19,34 The FCS we used appeared to contain traces of collagen detectable by CLSM and Western blotting (Supplementary Figure 1). In fact, replacement of FCS with 1% BSA resulted in a weaker signal for COL5A2 by CLSM analysis, suggesting a partial contribution of FCS-derived collagen to the signal obtained. Of note, collagen antibody signal was still detectable on the apical surface of HUVECs by CLSM after extensive washing and formaldehyde fixation (Figure 5A and B).
It remained to be determined what proportion of collagen was secreted by the cell compared to collagen absorbed from the environment in our cell culture model. By experimental suppression of collagen synthesis, we provided evidence that the endogenous expression of collagens contributes to barrier towards VSOP uptake in HUVECs. HF, a quinazolinone alkaloid is known to block the phosphorylation and subsequent nuclear translocation of the transcription factor SMAD3 leading to the inhibition of collagen expression.25 HF treatment inhibited the LSS-induced upregulated expression of COL1A2 and COL5A2 (but not COL5A1, which is not regulated via SMAD338). HF treatment clearly led to an increased internalization of VSOPs into HUVECs cultivated under LSS, indicating a compromised ESL barrier function. HF showed no effect on the LSS-induced expression of NOS3, demonstrating no major impact of HF treatment on EC shear-stress responsiveness.22 Our data suggest that SMAD signaling under LSS enhances ESL barrier function by regulating the expression of collagen. The highly specific suppression of the LSS-induced COLV expression using siRNAs against COL5A1 and COL5A2 similarly increased the internalization of VSOPs. These results point to the role of secreted COLI and COLV as components of the ESL involved in barrier function. HF treatment impaired the expression of additional ECM genes such as FBN1, ELN, hyaluronan and Proteoglycan Link Protein 3, and agrin (Supplementary Figure 5). It must be investigated if this also contributed to the increased uptake of VSOPs. The observation that both HF and siCOLV treatment did not increase VSOP uptake to the same extent as in the absence of LSS (Supplementary Figure 3) suggests that additional mechanisms contribute to maximal uptake.
It is widely assumed that the ESL is primarily composed of glycoproteins, PGs, GAGs and absorbed plasma proteins such as albumin and that their density determines the permeability of the ESL.9,39,40 The detection of COL5A2 on the endothelium of mice vessels suggests that the localization of COL5A2 on the apical surface of ECs was not a phenomenon unique to in vitro cultivation. As of now we can only hypothesize about the organization and structure of collagen in the ESL. Heterofibrils of COLI and COLV have been well studied in the corneal stroma of the eye.41–43 We hypothesize that collagens found in the ESL may form unique heterotypic I/V fibrils.
The exact mechanism by which ECs internalize VSOPs is not completely understood, but it is apparent that the ESL at least partially regulates this process. Our data indicate that LSS stimulation increases the barrier-function of the ESL, while static condition decreases ESL barrier function. It is conceivable that a decrease in collagen expression, as seen in S-cultivated HUVECs, structurally alters the ESL by thinning. Such conditions would suggest that VSOPs are able to move more freely through the ESL with less hindrance. The results obtained by qPEA using FluoSpheres support this. Both LSS- and S-cultivated HUVECs excluded FluoSpheres in the WGA-stained region of the ESL. However, FluoSpheres in LSS-cultivated HUVECs were excluded by an additional outer layer not labeled by WGA. The smaller size of VSOPs (~7 nm) compared to FluoSpheres (1 µm) may enable them to pass through the WGA-stained region of the ESL more easily in S-cultivated HUVECs. We propose that the ESL in S-cultivated HUVECs permits VSOPs to directly diffuse and deposit into loosely packed regions leading to particle accumulation along the membrane.
This in vitro study provides evidence for a mechanism of the preferential uptake of VSOP into atherosclerotic plaques, as previously observed in vivo.3 To achieve this, we used an in vitro setup that allowed us to study how the state of the ESL influences the uptake of VSOP by ECs in a controlled environment under laminar flow. We are aware that each of the methods used in this study has their own limitations, which must be considered when interpreting the structure and composition of the ESL. The increased exclusion zone measured by qPEA in LSS-cultivated HUVECs does not necessarily reflect the actual thickness of the ESL. The thickness of the ESL and its exclusion properties for VSOP can differ, as exclusion efficacy depends on the size and charge of the particles used. Gene expression analysis provided comprehensive quantitative information on the expression of ECM genes but did not allow any statement on the localization of the gene products. Immunohistology delivered information on the localization, but formalin fixation collapses the hydrated ESL and HPF/FS induces structural artefacts (as discussed above). Incomplete preservation with local loss or alteration of the sensitive ESL structure, especially the non-membrane-anchored components, complicates quantification. Despite these limitations, we are convinced that the combination of the methods used provided valuable information for understanding the role of the ESL in the differential uptake of VSOP in healthy and dysfunctional endothelium.
Conclusion
The endothelial surface layer of endothelial cells exposed to laminar shear stress acts as a permeability barrier for VSOP, preventing the uptake of VSOP into healthy blood vessels. The lack of laminar shear stress reduces barrier function, which facilitates membrane accessibility and endocytic uptake of VSOP in diseased vessels. Collagen, a previously neglected component of the ESL, contributes to the barrier function. Since low laminar shear stress has been identified as an independent risk factor for dangerous plaque progression,44 VSOP-based MRI may allow noninvasive identification of plaques at high risk of causing acute cardiovascular events.
Abbreviations
ECs, endothelial cells; LSS, laminar shear stress; S, static; VSOPs, very small superparamagnetic iron oxide nanoparticles; qPEA, quantitative particle exclusion assay; HF, halofuginone lactate; HUVECs, human umbilical vein endothelial cells; ESL, endothelial surface layer; GCX, glycocalyx; WGA, wheat germ agglutinin.
Acknowledgments
This work was funded by the Deutsche Forschungsgemeinschaft (DFG, German Research Foundation) SFB 1340 (project # 372486779) and SFB 958 (project Z02 to J.S.). S.G.T. received a travel grant from Deutsches Zentrum für Herz-Kreislauf-Forschung-Promotion of Young Scientists: Visiting Scientist Programme. For portions of the work performed at Northeastern University, funding was provided by the United States National Science Foundation (NSF) through the CAREER Award CMMI-1846962 (granted to E.E.E.) and the United States National Institutes of Health (NIH) through K01-HL125499 (granted to E.E.E.).
The authors would like to thank the Advanced Medical Bioimaging Core Facility (AMBIO) at the Charité - Universitätsmedizin Berlin for their support in CLSM and SDCM image acquisition and the Institute for Chemical Imaging of Living Systems Core Facility at Northeastern University for providing confocal imaging capabilities. The authors also acknowledge financial support from the Open Access Publication Fund of Charité – Universitätsmedizin Berlin.
Disclosure
The authors report no conflicts of interest in this work. A.M.W. and A.L. contributed equally to this work and are co-senior authors.
References
1. Wagner S, Schnorr J, Ludwig A, et al. Contrast-enhanced MR imaging of atherosclerosis using citrate-coated superparamagnetic iron oxide nanoparticles: calcifying microvesicles as imaging target for plaque characterization. Int j Nanomed. 2013;8:767–779. doi:10.2147/IJN.S38702
2. Makowski MR, Varma G, Wiethoff AJ, et al. Noninvasive assessment of atherosclerotic plaque progression in ApoE-/- mice using susceptibility gradient mapping. Circ Cardiovasc Imaging. 2011;4(3):295–303. doi:10.1161/CIRCIMAGING.110.957209
3. Poller WC, Ramberger E, Boehm-Sturm P, et al. Uptake of citrate-coated iron oxide nanoparticles into atherosclerotic lesions in mice occurs via accelerated transcytosis through plaque endothelial cells. Nano Res. 2016;9(11):3437–3452. doi:10.1007/s12274-016-1220-9
4. Taupitz M, Wagner S, Schnorr J, et al. Phase I clinical evaluation of citrate-coated monocrystalline very small superparamagnetic iron oxide particles as a new contrast medium for magnetic resonance imaging. Investigative Radiology. 2004;39(7):394–405. doi:10.1097/01.rli.0000129472.45832.b0
5. Wagner M, Wagner S, Schnorr J, et al. Coronary MR angiography using citrate-coated very small superparamagnetic iron oxide particles as blood-pool contrast agent: initial experience in humans. J Magn Reson Imaging. 2011;34(4):816–823. doi:10.1002/jmri.22683
6. Poller WC, Pieber M, Boehm-Sturm P, et al. Very small superparamagnetic iron oxide nanoparticles: long-term fate and metabolic processing in atherosclerotic mice. Nanomedicine. 2018;14(8):2575–2586. doi:10.1016/j.nano.2018.07.013
7. Zhou J, Li YS, Chien S. Shear stress-initiated signaling and its regulation of endothelial function. Arterioscl Throm Vas. 2014;34(10):2191–2198. doi:10.1161/ATVBAHA.114.303422
8. Tarbell JM, Cancel LM. The glycocalyx and its significance in human medicine. J Internal Med. 2016;280(1):97–113. doi:10.1111/joim.12465
9. Curry FRE. The molecular structure of the endothelial glycocalyx layer (EGL) and surface layers (ESL) modulation of transvascular exchange. Mole Cell Eng Vas Sys. 2018;1097:29–49. doi:10.1007/978-3-319-96445-4_2
10. Butler MJ, Down CJ, Foster RR, Satchell SC. The Pathological Relevance of Increased Endothelial Glycocalyx Permeability. American J Pathol. 2020;190(4):742–751. doi:10.1016/j.ajpath.2019.11.015
11. Mitra R, Qiao J, Madhavan S, et al. The comparative effects of high fat diet or disturbed blood flow on glycocalyx integrity and vascular inflammation. Transl Med Commun. 2018;3. doi:10.1186/s41231-018-0029-9
12. Bai K, Wang W. Shear stress-induced redistribution of the glycocalyx on endothelial cells in vitro. Biomech Model Mechan Apr. 2014;13(2):303–311. doi:10.1007/s10237-013-0502-3
13. Zeng Y, Waters M, Andrews A, et al. Fluid shear stress induces the clustering of heparan sulfate via mobility of glypican-1 in lipid rafts. Am J Physiol-Heart C. 2013;305(6):H811–H820. doi:10.1152/ajpheart.00764.2012
14. Haymet AB, Bartnikowski N, Wood ES, et al. Studying the endothelial glycocalyx in vitro: what is missing? Front Cardiovasc Med. 2021;8:647086. doi:10.3389/fcvm.2021.647086
15. Kim AJ, Manoharan VN, Crocker JC. Swelling-based method for preparing stable, functionalized polymer colloids. J Am Chem Soc. 2005;127(6):1592–1593. doi:10.1021/ja0450051
16. Stangl V, Gunther C, Jarrin A, et al. Homocysteine inhibits TNF-alpha-induced endothelial adhesion molecule expression and monocyte adhesion via nuclear factor-kappaB dependent pathway. Biochem Biophy Res Commun. 2001;280(4):1093–1100. doi:10.1006/bbrc.2000.4207
17. Chang PS, McLane LT, Fogg R, et al. Cell surface access is modulated by tethered bottlebrush proteoglycans. Biophys. J. 2016;110(12):2739–2750. doi:10.1016/j.bpj.2016.05.027
18. Schindelin J, Arganda-Carreras I, Frise E, et al. Fiji: an open-source platform for biological-image analysis. Nature Methods. 2012;9(7):676–682. doi:10.1038/nmeth.2019
19. Twamley SG, Stach A, Heilmann H, et al. Immuno-electron and confocal laser scanning microscopy of the glycocalyx. Biology-Basel. 2021;10(5): doi:10.3390/biology10050402
20. Nam D, Ni CW, Rezvan A, et al. A model of disturbed flow-induced atherosclerosis in mouse carotid artery by partial ligation and a simple method of RNA isolation from carotid endothelium. J Visualized Expe. 2010; 40:doi:10.3791/1861-v
21. Nam D, Ni CW, Rezvan A, et al. Partial carotid ligation is a model of acutely induced disturbed flow, leading to rapid endothelial dysfunction and atherosclerosis. Am j Physiol Heart Circulat Phy. 2009;297(4):H1535–43. doi:10.1152/ajpheart.00510.2009
22. Topper JN, Gimbrone Jr MA. Blood flow and vascular gene expression: fluid shear stress as a modulator of endothelial phenotype. Mol Med Today. 1999;5(1):40–46. doi:10.1016/S1357-4310(98)01372-0
23. Zhang S, Moustafa Y, Huo Q. Different interaction modes of biomolecules with citrate-capped gold nanoparticles. ACS Appl Mater Interfac. 2014;6(23):21184–21192. doi:10.1021/am506112u
24. El-Dakdouki MH, El-Boubbou K, Kamat M, et al. CD44 targeting magnetic glyconanoparticles for atherosclerotic plaque imaging. Pharm Res. 2014;31(6):1426–1437. doi:10.1007/s11095-013-1021-8
25. McGaha TL, Phelps RG, Spiera H, Bona C. Halofuginone, an inhibitor of type-I collagen synthesis and skin sclerosis, blocks transforming-growth-factor-beta-mediated Smad3 activation in fibroblasts. J Invest Dermatol. 2002;118(3):461–470. doi:10.1046/j.0022-202x.2001.01690.x
26. Tsvirkun D, Grichine A, Duperray A, Misbah C, Bureau L. Microvasculature on a chip: study of the endothelial surface layer and the flow structure of red blood cells. Sci Rep. 2017;7(1). doi:10.1038/srep45036
27. Krolikoski M, Monslow J, Pure E. The CD44-HA axis and inflammation in atherosclerosis: a temporal perspective. Matrix Biol. 2019;78-79:201–218. doi:10.1016/j.matbio.2018.05.007
28. Burghoff S, Schrader J. Secretome of human endothelial cells under shear stress. J proteome res. 2011;10(3):1160–1169. doi:10.1021/pr100937a
29. Lorenz M, Witt E, Volker U, Stangl K, Stangl V, Hammer E. Serum starvation induces sexual dimorphisms in secreted proteins of human umbilical vein endothelial cells (HUVECs) from twin pairs. Proteomics. 2022;22(13–14):e2100168. doi:10.1002/pmic.202100168
30. Holliday CJ, Ankeny RF, Jo H, Nerem RM. Discovery of shear- and side-specific mRNAs and miRNAs in human aortic valvular endothelial cells. Am J Physiol-Heart C. 2011;301(3):H856–H867. doi:10.1152/ajpheart.00117.2011
31. Madri JA, Dreyer B, Pitlick FA, Furthmayr H. The collagenous components of the subendothelium - correlation of structure and function. Lab Invest. 1980;43(4):303–315.
32. Sage H, Pritzl P, Bornstein P. Characterization of cell matrix associated collagens synthesized by aortic endothelial-cells in culture. Biochemistry. 1981;20(2):436–442. doi:10.1021/bi00505a032
33. Parsons TJ, Haycraft DL, Hoak JC, Sage H. Interaction of platelets and purified collagens in a laminar-flow model. Thrombosis Research. 1986;43(4):435–443. doi:10.1016/0049-3848(86)90088-5
34. Ebong EE, Macaluso FP, Spray DC, Tarbell JM. Imaging the endothelial glycocalyx in vitro by rapid freezing/freeze substitution transmission electron microscopy. Arterioscl Throm Vas. 2011;31(8):1908–1915. doi:10.1161/Atvbaha.111.225268
35. Jacob M, Paul O, Mehringer L, et al. Albumin augmentation improves condition of guinea pig hearts after 4 hr of cold ischemia. Transplantation. 2009;87(7):956–965. doi:10.1097/TP.0b013e31819c83b5
36. Aldecoa C, Llau JV, Nuvials X, Artigas A. Role of albumin in the preservation of endothelial glycocalyx integrity and the microcirculation: a review. Ann Intensive Care. 2020;10(1). doi:10.1186/s13613-020-00697-1
37. Stevens AP, Hlady V, Dull RO. Fluorescence correlation spectroscopy can probe albumin dynamics inside lung endothelial glycocalyx. Am J Physiol-Lung C. 2007;293(2):L328–L335. doi:10.1152/ajplung.00390.2006
38. Verrecchia F, Chu ML, Mauviel A. Identification of novel TGF-beta/Smad gene targets in dermal fibroblasts using a combined cDNA microarray/promoter transactivation approach. J Biol Chem. 2001;276(20):17058–17062. doi:10.1074/jbc.M100754200
39. Curry FE, Adamson RH. Endothelial Glycocalyx: permeability Barrier and Mechanosensor. Annals of biomedical engineering. Apr. 2012;40(4):828–839. doi:10.1007/s10439-011-0429-8
40. Zeng Y, Zhang XF, Fu BMM, Tarbell JM. The role of endothelial surface glycocalyx in mechanosensing and transduction. Mole Cell Eng Vas Sys. 2018;1097:1–27. doi:10.1007/978-3-319-96445-4_1
41. Birk DE, Fitch JM, Linsenmayer TF. Organization of collagen type-i and type-v in the embryonic chicken Cornea. Invest Ophthalmol Visual Sci. 1986;27(10):1470–1477.
42. Birk DE, Fitch JM, Babiarz JP, Linsenmayer TF. Collagen type-i and type-v are present in the same fibril in the avian corneal stroma. J Cell Biol. 1988;106(3):999–1008. doi:10.1083/jcb.106.3.999
43. Linsenmayer TF, Fitch JM, Birk DE. Heterotypic collagen fibrils and stabilizing collagens - controlling elements in corneal morphogenesis. Ann Acad Sci. 1990;580(1):143–160. doi:10.1111/j.1749-6632.1990.tb17926.x
44. Stone PH, Saito S, Takahashi S, et al. Prediction of progression of coronary artery disease and clinical outcomes using vascular profiling of endothelial shear stress and arterial plaque characteristics: the PREDICTION Study. Circulation. 2012;126(2):172–181. doi:10.1161/CIRCULATIONAHA.112.096438
 © 2024 The Author(s). This work is published and licensed by Dove Medical Press Limited. The full terms of this license are available at https://www.dovepress.com/terms.php and incorporate the Creative Commons Attribution - Non Commercial (unported, v3.0) License.
By accessing the work you hereby accept the Terms. Non-commercial uses of the work are permitted without any further permission from Dove Medical Press Limited, provided the work is properly attributed. For permission for commercial use of this work, please see paragraphs 4.2 and 5 of our Terms.
© 2024 The Author(s). This work is published and licensed by Dove Medical Press Limited. The full terms of this license are available at https://www.dovepress.com/terms.php and incorporate the Creative Commons Attribution - Non Commercial (unported, v3.0) License.
By accessing the work you hereby accept the Terms. Non-commercial uses of the work are permitted without any further permission from Dove Medical Press Limited, provided the work is properly attributed. For permission for commercial use of this work, please see paragraphs 4.2 and 5 of our Terms.