")
Back to Journals » Journal of Inflammation Research » Volume 17
Identification and Verification of Ferroptosis-Related Genes in Keratoconus Using Bioinformatics Analysis
Authors Gao JF, Dong YY, Jin X, Dai LJ, Wang JR, Zhang H
Received 16 December 2023
Accepted for publication 10 April 2024
Published 20 April 2024 Volume 2024:17 Pages 2383—2397
DOI https://doi.org/10.2147/JIR.S455337
Checked for plagiarism Yes
Review by Single anonymous peer review
Peer reviewer comments 2
Editor who approved publication: Professor Ning Quan
Jing-Fan Gao,* Yue-Yan Dong,* Xin Jin, Li-Jun Dai, Jing-Rao Wang, Hong Zhang
Eye Hospital, The First Affiliated Hospital of Harbin Medical University, Harbin, 150001, People’s Republic of China
*These authors contributed equally to this work
Correspondence: Hong Zhang, Department of Eye Hospital, The First Affiliated Hospital of Harbin Medical University, Harbin, 150001, People’s Republic of China, Email [email protected]
Objective: Keratoconus is a commonly progressive and blinding corneal disorder. Iron metabolism and oxidative stress play crucial roles in both keratoconus and ferroptosis. However, the association between keratoconus and ferroptosis is currently unclear. This study aimed to analyze and verify the role of ferroptosis-related genes (FRGs) in the pathogenesis of keratoconus through bioinformatics.
Methods: We first obtained keratoconus-related datasets and FRGs. Then, the differentially expressed FRGs (DE-FRGs) associated with keratoconus were screened through analysis, followed by analysis of their biological functions. Subsequently, the LASSO and SVM-RFE algorithms were used to screen for diagnostic biomarkers. GSEA was performed to explore the potential functions of the marker genes. Finally, the associations between these biomarkers and immune cells were analyzed. qRT‒PCR was used to detect the expression of these biomarkers in corneal tissues.
Results: A total of 39 DE-FRGs were screened, and functional enrichment analysis revealed that the DE-FRGs were closely related to apoptosis, oxidative stress, and the immune response. Then, using multiple algorithms, 6 diagnostic biomarkers were selected, and the ROC curve was used to verify their risk prediction ability. In addition, based on CIBERSORT analysis, alterations in the immune microenvironment of keratoconus patients might be associated with H19, GCH1, CHAC1, and CDKN1A. Finally, qRT‒PCR confirmed that the expression of H19 and CHAC1 was elevated in the keratoconus group.
Conclusion: This study identified 6 DE-FRGs, 4 of which were associated with immune infiltrating cells, and established a diagnostic model with predictive value for keratoconus.
Keywords: keratoconus, ferroptosis, immune infiltration, machine learning
Introduction
Keratoconus is characterized by corneal dilatation with central and/or para-central thinning and steepening of the cornea, causing a consequentially high degree of irregular astigmatism, which may eventually result in vision loss.1 The prevalence of keratoconus varies among different ethnic groups, ranging from 0.0002% to 4.79%.2 Specifically, the Middle East region exhibits a high incidence, with Saudi Arabian adolescents having a rate as high as 4.79%,3 while the incidence among the Russian population ranges from 0.0002% to 0.0004%. In Asian populations, the incidence exceeds 0.02%.4 This disease predominantly affects adolescents and typically presents with progressive bilateral involvement. The three main pathological features of keratoconus are stromal corneal thinning, interruptions in Bowman’s membrane, and iron deposits in the basal layer.5 Regarding the pathogenesis of keratoconus, different hypotheses, involving genetics, epigenetics, environmental factors, alterations in corneal biomechanics, oxidative stress, apoptosis, inflammation, hormones, and even pollution or peculiar behavioral traits, have been proposed.6 Previous studies have shown that deranged iron metabolism can contribute to keratoconus development by producing reactive oxygen species (ROS) through the Fenton reaction,7 and iron deposits can be detected in the basal layer of the cornea in keratoconus patients. However, the pathogenesis of iron deposits remains unclear.
Ferroptosis is an oxidative, iron-dependent form of cell death driven by phospholipid peroxidation.8 Ferroptosis is triggered by the inactivation of cellular glutathione-dependent antioxidant defenses, leading to the accumulation of toxic lipid ROS.9 The main characteristics of ferroptosis are (1) the depletion of glutathione and lipid peroxidation, (2) the acceleration of cell death by iron-dependent intracellular ROS accumulation and iron overload, and (3) the inhibition of cell death by scavengers of lipid ROS.10 Ferroptosis is regulated by multiple cellular metabolic pathways, including redox homeostasis, iron metabolism, mitochondrial activity, and the metabolism of amino acids, lipids, and sugars.11 Ferroptosis plays a crucial role in the pathogenesis of various ophthalmic diseases, such as corneal disorders,12 age-related macular degeneration,13 glaucoma,14 retinitis pigmentosa,15 and age-related cataracts,16 by influencing intracellular iron homeostasis, the redox system and other processes that result lipid peroxide accumulation, which causes cell damage.17
Iron metabolism and oxidative stress play crucial roles in both keratoconus and ferroptosis, leading us to hypothesize that ferroptosis might play a role in the pathogenesis of keratoconus. Multiple studies have indicated a correlation between ferroptosis and various ophthalmic diseases,18 however, the specific mechanisms involved in keratoconus remain unknown. In this study, we analyzed and verified the role of ferroptosis-related genes (FRGs) in the pathogenesis of keratoconus via bioinformatics analysis. This study may provide new insight into the molecular mechanisms of keratoconus, which may lead to a prospective therapeutic target for treating this disease.
Materials and Methods
Data Collection and Download
The three keratoconus gene expression datasets used in this study were obtained from the Gene Expression Omnibus (GEO) database under the accession numbers GSE151631, GSE77938 and GSE204791.19–21 Detailed information (eg, Platform, the number of control and keratoconus subjects) concerning these datasets is shown in Table 1. Next, the GSE151631 and GSE77938 datasets were combined to remove inter-batch differences using the sva (v3.46.0) package in R (v4.2.2) and to remove samples where intergroup differences could not be removed between groups. The merged dataset was randomly split into training and validation sets at a ratio of 7:3, with the GSE204791 dataset serving as the external validation set. In addition, the FRGs were obtained from the Ferroptosis database (FerrDb)22 (Table S1).
 |
Table 1 Detailed Information of the Included Datasets |
Differential Expression Analysis
To screen differentially expressed genes (DEGs), differential expression analysis of the merged dataset was conducted by using limma (v3.54.2), with the thresholds of fold change (|log2 fold change| > 1) and adjusted p value (adj. p < 0.05). The final differentially expressed ferroptosis-related genes (DE-FRGs) were identified by the intersection of DEGs and FRGs via a Venn diagram. The DEGs and DE-FRGs were visualized via volcano plots and heatmaps, respectively, via ggplot2 (v3.4.1).
Functional Enrichment Analysis
Based on the Gene Ontology (GO) and Kyoto Encyclopedia of Genes and Genomes (KEGG) databases, functional enrichment analysis was performed on the DE-FRGs that were screened by clusterProfiler (v4.6.2), and p < 0.05 was considered to indicate statistical significance.
Identification of Optimal Diagnostic Gene Biomarkers for Keratoconus
Least absolute shrinkage and selection operator (LASSO) is a linear regression method used for feature selection and model regularization. LASSO determines variables by finding the lambda that minimizes classification errors.23 Support vector machine recursive feature elimination (SVM-RFE) is a machine learning method based on support vector machines that seeks the optimal variables by eliminating feature vectors generated by SVM.24 We combined LASSO and SVM-RFE regression to identify the optimal diagnostic gene biomarkers for keratoconus. LASSO regression was performed by glmnet (v4.1.6), and the minimal lambda value was considered optimal. To ascertain the gene set with the highest discriminatory power, another independent model (SVM-RFE) was applied to validate findings from the LASSO model using e1071 (v1.7.13). The overlapping biomarkers obtained from both algorithms were considered the most reliable gene biomarkers for keratoconus. Furthermore, we utilized the binomial distribution in the generalized linear model (GLM) as the probability distribution, with the logit function as the link function to construct the model. The specific formula is as follows:


Where p represents the probability of the event, β0, β1, …., βk represents the coefficient of the model, and x1, x2, …., xk represents the independent variable.
Finally, a logistic regression model utilizing the selected 6 marker genes as features was employed to predict sample labels in the validation sets (pROC v1.18.0). Receiver operating characteristic (ROC) curves were generated, and the area under the curve (AUC), sensitivity, specificity, and accuracy were determined to assess the diagnostic ability of the optimal gene biomarkers.
Single-Gene Gene Set Enrichment Analysis Enrichment Analysis
To further explore the pathways related to the 6 marker genes, we calculated the correlations between the marker genes and all other genes in the merged dataset. Subsequently, all genes were ranked according to their correlations from high to low, and those ranked genes were further entered into the gene set for analysis. Moreover, the KEGG signaling pathway set was used as a predefined set to detect enrichment in the gene set. The specific enrichment results for each marker gene are shown in Table S2.
Immune Cell Infiltration
CIBERSORT (v0.1.0) was used to quantify the relative abundance of 22 types of infiltrating immune cells in the keratoconus and control samples, and p < 0.05 was regarded as indicating statistical significance. Subsequently, the correlations between the marker genes and immune cells were evaluated using Spearman correlation analysis.
Drug–Gene Interaction Analysis
To identify potential drugs associated with the hub genes, we used the Drug Gene Interaction Database (DGIdb, https://dgidb.org/)25 to predict drugs that can interact with the marker genes. Cytoscape software (v3.9.0) was used to construct the drug-hub gene interaction network.
Validation of Marker Gene Expression
To further validate marker gene expression, this study performed validation on a new dataset (GSE204791). Furthermore, since the GSE204791 dataset contains both corneal epithelium (keratoconus: control = 8:8) and corneal stroma (keratoconus: control = 8:7) samples, this study validated the expression of the hub genes in two different tissue samples separately by conducting independent sample t-tests, and p < 0.05 was considered to indicate statistical significance.
RNA Extraction and Quantitative Real-Time PCR
Based on the GSE204791 dataset, the expression of marker genes (H19, GCH1, CHAC1, NOX4, CDKN1A, and SMAD7) was further validated in the corneal tissues of keratoconus patients. The corneal tissues of 6 keratoconus patients were obtained during deep anterior lamellar keratoplasty surgeries performed at the Eye Hospital of the First Affiliated Hospital of Harbin Medical University, and the specimens were composed of corneal epithelial and stromal layers. Six postmortem healthy control corneas were obtained from the eye bank of the Eye Hospital of the First Affiliated Hospital of Harbin Medical University, and the corneal endothelium and limbus were removed under a stereoscope. The study complied with the Declaration of Helsinki and was approved by the Ethics Committee of the First Affiliated Hospital of Harbin Medical University (No. 2023IIT235). Written informed consent was obtained from all study participants.
The expression of these 6 marker genes was quantified using qRT‒PCR according to the manufacturer’s instructions. With GAPDH as the standard, the 2−ΔΔCT method was used for calculating the relative expression of mRNA. The primers used in this study are detailed in Table 2. Independent sample t-tests were then performed using GraphPad Prism 9 software, and p < 0.05 was considered to indicate a significant difference.
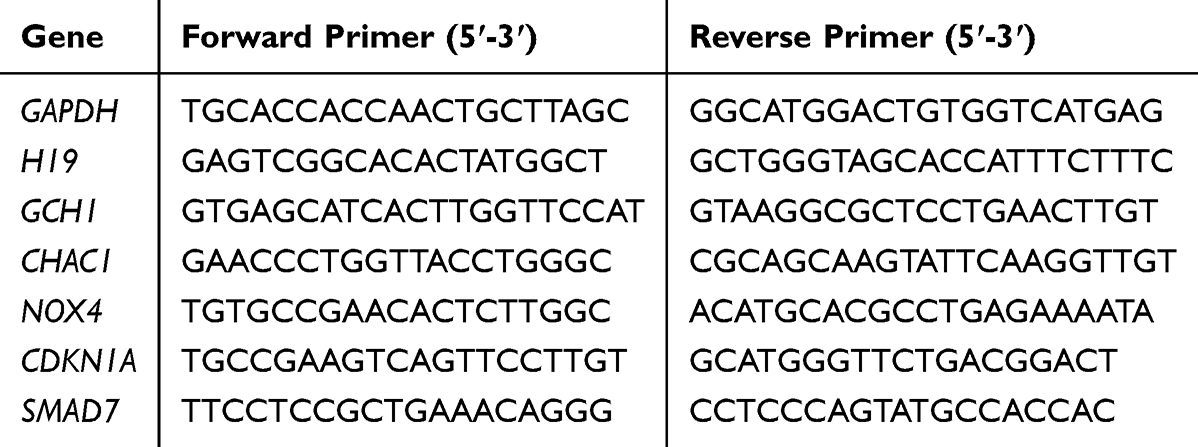 |
Table 2 Primers Used for qRT-PCR in This Study |
Results
Identification of Differentially Expressed Ferroptosis-Related Genes in Keratoconus Patients
As shown in Figure 1, we performed an integrated analysis of two independent keratoconus datasets (GSE151631 and GSE77938 datasets), including 44 keratoconus patient samples and 32 healthy control samples. After removing the batch effect and data normalization of both datasets, we collected a total of 68 samples (keratoconus: control = 41:27) for subsequent analyses. A total of 271 upregulated and 785 downregulated significant DEGs were identified based on the differential gene expression analysis (Figure 2A). Subsequently, we intersected the DEGs with the FRGs, and 39 overlapping DE-FRGs (5 upregulated and 34 downregulated) were further identified (Table 3, Figure 2B). The expression patterns of the DE-FRGs among the samples are shown in the clustering heatmap (Figure 2C).
 |
Table 3 A List of the 39 Differentially Expressed Ferroptosis-Related Genes |
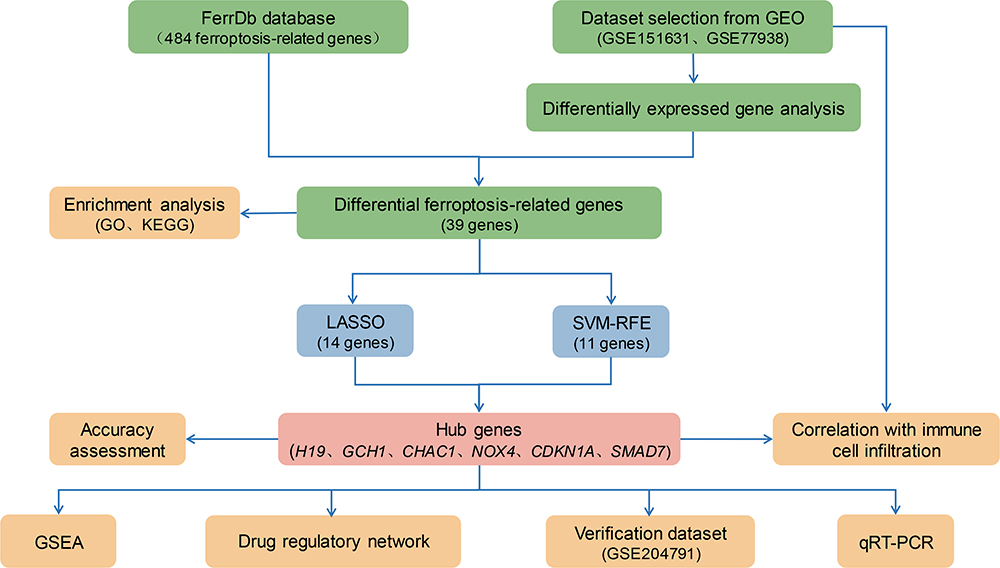 |
Figure 1 The flowchart of the analysis process. |
 |
Figure 2 Identification of the DE-FRGs in Keratoconus. (A) The volcano plot of the DEGs, the red dots represent the up-regulated genes, and the blue dots represent the down-regulated genes. (B) Venn diagram of candidate DE-FRGs. (C)The heatmap of the 39 DE-FRGs. The color scale indicates the relative gene expression of each sample, 5 DE-FRGs are up-regulated and 34 DE-FRGs are down-regulated. |
Functional Enrichment Analysis of DE-FRGs
To identify the biological functions of the DE-FRGs, we performed GO and KEGG analyses on the 39 DE-FRGs. A total of 215 gene terms were enriched in GO, and the top 10 most relevant terms are illustrated in Figure 3A. In terms of biological processes (BP), the DE-FRGs were primarily involved in ROS metabolic process, intrinsic apoptotic signaling pathway, regulation of protein secretion, response to transforming growth factor beta (TGF-β), response to oxidative stress, and proliferation of various immune cells in addition to various other biological processes. In terms of cellular components (CCs), DE-FRGs were significantly enriched in the apical part of the cell, apical plasma membrane, and lipid droplet. In terms of molecular components (MFs), DE-FRGs were markedly enriched in protein kinase inhibitor activity, cyclin-dependent protein serine/threonine kinase inhibitor activity, and transforming growth factor beta receptor binding. Subsequently, we performed KEGG pathway enrichment analysis for the DE-FRGs. As shown in Figure 3B, the most meaningful and significantly enriched pathways included ferroptosis, the HIF-1 signaling pathway and the p53 signaling pathway. Additionally, the functional enrichment analysis was conducted separately for upregulated genes and downregulated genes (Figure S1).
 |
Figure 3 Functional enrichment analysis of DE-FRGs. (A) The top 10 significantly enriched GO terms in the category of biological process, cellular component, and molecular function for the DE-FRGs. (B) KEGG pathway enrichment analysis for the DE-FRGs. |
Constructing a Diagnostic Model for Keratoconus
To screen the significant DE-FRGs that distinguish keratoconus patients from normal individuals, we used two distinct machine learning algorithms, LASSO and SVM-RFE. The LASSO logistic regression algorithm identified 14 keratoconus-related features (Figure 4A and B). The SVM-RFE algorithm identified 11 genes as the optimal feature genes (Figure 4C). Eventually, the 6 overlapping genes obtained from the LASSO and SVM-RFE models were selected as marker genes. These marker genes included H19, GCH1, CHAC1, NOX4, CDKN1A, and SMAD7, of which H19 was upregulated and the others were downregulated (Figure 4D).
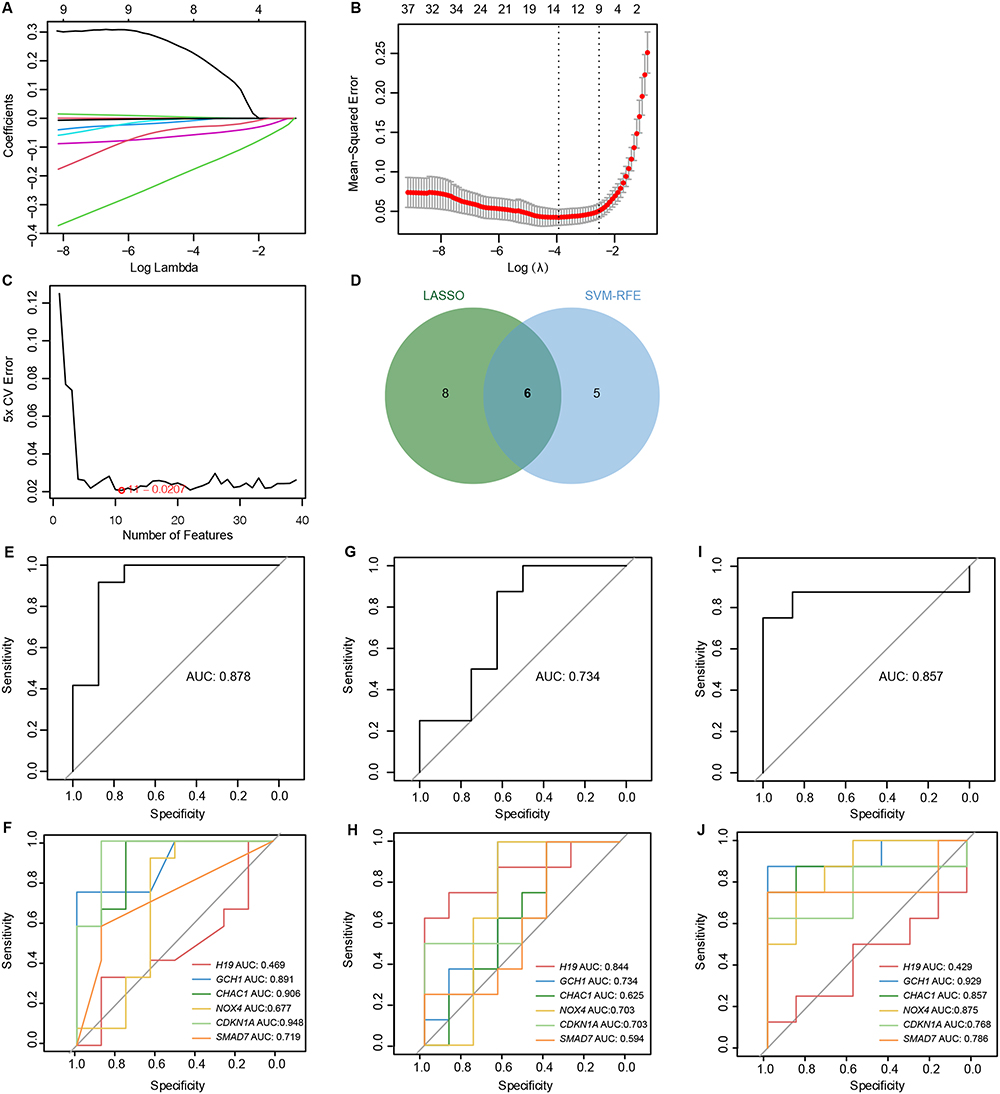 |
Figure 4 6 DE-FRGs were identified as diagnostic genes for Keratoconus. (A and B) LASSO logistic regression algorithm was used to select 14 Keratoconus-related features. (C) SVM-RFE algorithm identified 11 genes as the optimal feature genes. (D) The marker genes obtained from the LASSO and SVM-RFE models. (E–J) Logistic regression model to identify the AUC of disease samples. (E andF) Internal validation set, (G and H) corneal epithelium tissue from external validation set, (I and J) corneal stroma tissue from external validation set. |
Based on the 6 marker genes mentioned above, a logistic regression model was built and the subsequent ROC curves indicated that 6 marker genes could discriminate normal and keratoconus samples with an AUC of 0.878 (Figure 4E). In addition, to elucidate whether single genes could be used to differentiate keratoconus patients from healthy controls, we plotted ROC curves for these 6 marker genes (Figure 4F). Finally, in the external validation set GSE204791, the diagnostic efficiency of these 6 marker genes was validated, and they were able to distinguish normal from keratoconus samples in both corneal epithelium (AUC=0.734) and stromal tissues (AUC=0.857) (Figure 4G–J).
Single-Gene GSEA Pathway Analysis of Marker Genes
To explore the potential functions of the marker genes, we carried out a single-gene GSEA-KEGG pathway analysis. The top 10 pathways enriched for each marker gene are illustrated in Figure 5A–F. The results showed that the key genes were mainly enriched in ribosome, lysosome, peroxisome, apoptosis, ferroptosis, DNA replication, protein digestion and absorption, ECM-receptor interaction, and immune responses (“Th17 cell differentiation”, “Th1 and Th2 cell differentiation”, “antigen processing and presentation”, “natural killer cell-mediated cytotoxicity”, “B-cell receptor signaling pathway” and “T-cell receptor signaling pathway”), amino acid metabolism (“pyruvate metabolism”, “valine, leucine and isoleucine degradation”) and various disease pathways. Additionally, we found that the key genes were also enriched in the PI3K-Akt signaling pathway, JAK-STAT signaling pathway, MAPK signaling pathway, chemokine signaling pathway, NF-κB signaling pathway, TNF signaling pathway, TGF-β signaling pathway, cAMP signaling pathway, cGMP-PKG signaling pathway, and calcium signaling pathway.
 |
Figure 5 Single-gene GSEA-KEGG pathway analysis in H19 (A), GCH1 (B), CHAC1 (C), NOX4 (D), CDKN1A (E), SMAD7 (F). |
Analysis of Immune Cell Infiltration
The previous GSEA results indicated that the marker genes were closely associated with the immune response. Moreover, a substantial amount of evidence indicates an inseparable connection between the immune microenvironment and keratoconus. Therefore, we used the CIBERSORT algorithm to explore differences in the immune microenvironment between keratoconus patients and normal individuals. As shown in Figure 6A, the proportions of M1 macrophages and resting mast cells in keratoconus samples were higher than those in normal samples, while CD8+ T-cell expression was decreased in keratoconus samples. In addition, Spearman correlation analysis revealed that CD8+ T cells were positively correlated with CHAC1 (r = 0.56, p = 0.046) and negatively correlated with H19 (r = −0.68, p = 0.010), resting mast cells were negatively correlated with CHAC1 (r = −0.60, p = 0.029) and GCH1 (r = −0.65, p = 0.015), and CDKN1A (r = 0.59, p = 0.035) was positively correlated with follicular helper T cells (Figure 6B). The results suggested that changes in the immune microenvironment of keratoconus patients may be associated with H19, GCH1, CHAC1, and CDKN1A.
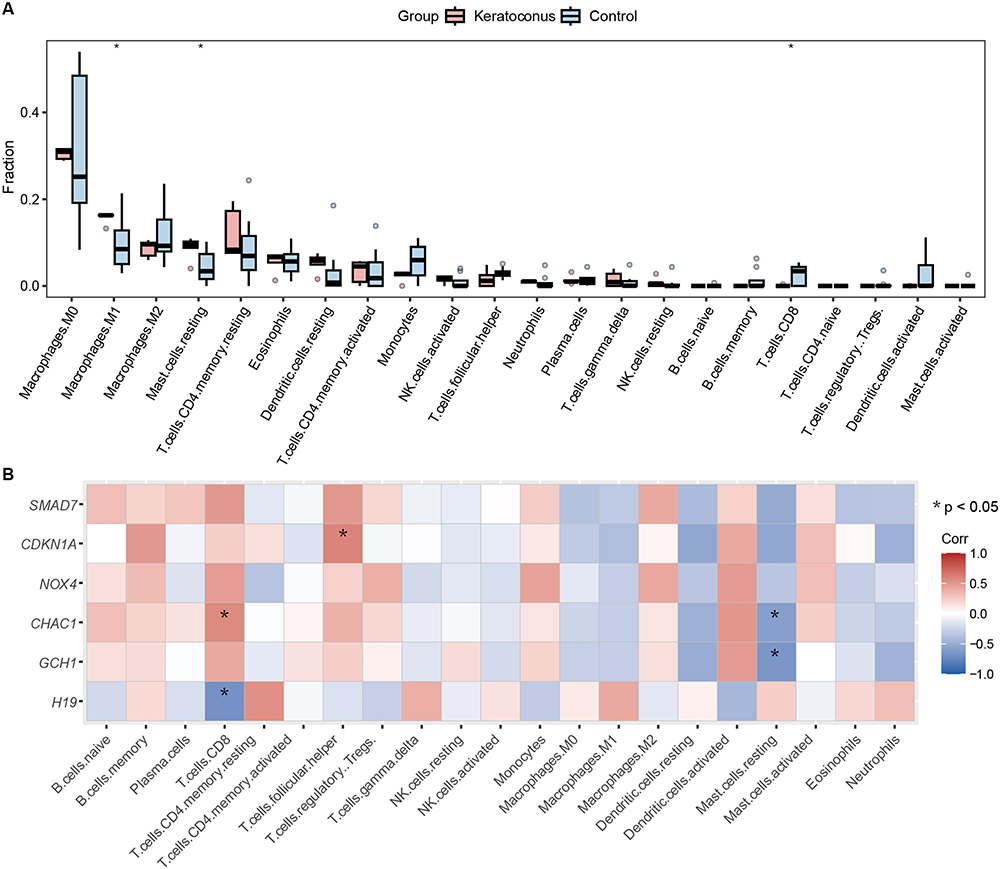 |
Figure 6 Immune cell infiltration analysis. (A) Implemented the CIBERSORT algorithm to explore the differences in the immune microenvironment between keratoconus patients and normal samples. (B) Spearman correlation analysis revealed that CD8+T cells had positive and negative correlations with H19 and CHAC1, respectively. resting mast cells had negative correlations with GCH1 and CHAC1, CDKN1A was positively correlated with follicular helper T cells. (*p < 0.05). |
Marker Gene‐targeted Drug Prediction
To identify drugs possibly targeting marker genes, the DGIdb database was used for analysis, with two-parameter interaction relationships set at the default settings. Figure 7 displays the visualization of the results based on Cytoscape software. Sixteen drugs that target marker genes, 15 for CDKN1A and 1 for SMAD7, were queried. However, drugs targeting the H19, GCH1, CHAC1, and NOX4 genes were not predicted.
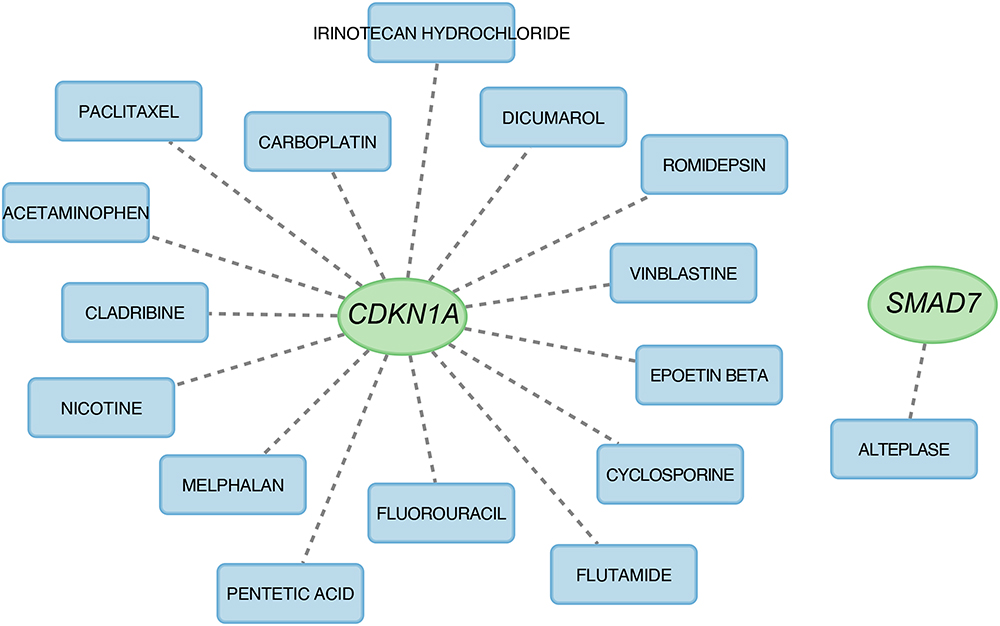 |
Figure 7 Prediction of marker gene-targeted drugs. |
Validation of Biomarker Expression
To validate expression of marker genes, we performed validation on a new dataset (GSE204791). In the corneal epithelium tissues (Figure 8A), the expression of H19 (t = 2.4, p = 0.031), compared to that in the control was higher, and the expression of GCH1 (t = −2.5, p = 0.035) was lower than that in the control. In the corneal stromal tissues (Figure 8B), the expression of GCH1 (t = −4.5, p = 0.00066), CHAC1 (t = −2.3, p = 0.041), NOX4 (t = −3.4, p = 0.0059) and SMAD7 (t = −2.3, p = 0.046) was lower than that in the control. Additionally, we further measured the expression levels of marker genes in the corneal tissues of normal individuals and patients with keratoconus by qRT‒PCR. The qRT‒PCR results showed that the expression of H19 (t = 5.1, p = 0.00049) and CHAC1 (t = 2.9, p = 0.052) was higher in corneal tissues of keratoconus (Figure 8C).
 |
Figure 8 Validation of biomarker expression (A) corneal epithelium in dataset GSE204791. (B) corneal stroma in dataset GSE204791. (C) corneal tissues from 6 organ donors and 6 keratoconus, experiments were repeated for 3 times. ns: p > 0.05, *: 0.01 < p ≤ 0.05, **: 0.001 < p ≤ 0.01, ***: p ≤ 0.001. |
Discussion
Keratoconus is a blinding ocular disease characterized by corneal dilatation, and its pathogenesis, clinical diagnosis, and treatment have garnered considerable attention. Keratoconus is one of the leading indications for corneal transplantation surgery worldwide,26 however, there is a global donor shortage that limits corneal transplantation to approximately 1 out of 70 potential patients.27 Ferroptosis is a form of iron-dependent cell death driven by intracellular iron overload and lipid peroxidation, and its role in physiological and pathogenic processes has been extensively studied.28 Previous studies have shown that keratoconus and ferroptosis are closely related to iron metabolism and oxidative stress.1,5 However, the specific connection between keratoconus and ferroptosis remains unclear. Therefore, this study utilized a comprehensive strategy to identify DE-FRGs associated with keratoconus and explored the functions of these DE-FRGs, thereby providing a novel perspective on the pathogenesis, diagnosis, and treatment of keratoconus.
We identified 39 DE-FRGs by combining FRGs and DEGs related to keratoconus. Subsequent enrichment analysis revealed that these DE-FRGs were primarily associated with the ROS metabolic process, intrinsic apoptotic signaling pathway, regulation of protein secretion, response to TGF-β and oxidative stress, proliferation of various immune cells, and other biological processes. These findings are consistent with previously reported factors related to keratoconus. Oxidative-antioxidant imbalance and oxidative stress markers, particularly ROS, nitrogen species and malondialdehyde, are increased in the corneas of keratoconus patients compared with those in healthy individuals.29 Morphological alterations of epithelial basal cells and degradation of the extracellular matrix (ECM) were observed in the keratoconus cornea, leading to thinning of the corneal stroma and keratocyte apoptosis.30 The expression of tissue inhibitor of metalloproteinase 3 is upregulated in keratoconus corneal stromal cells, which further induces apoptosis.31 TGF-β can induce cell differentiation, proliferation and migration; interact with different types of collagen and proteoglycans; and play important roles in maintaining corneal biomechanics, refraction, and transparency. Reduced TGF-β expression was found in the tears of keratoconus patients.32,33 Research on the TGF-β pathway and ferroptosis has been conducted in other diseases. For instance, PIAS3 promotes ferroptosis by regulating TXNIP via the TGF-β signaling pathway in hepatocellular carcinoma.34 Calcipotriol suppresses GPX4-mediated ferroptosis in osteoarthritis chondrocytes by blocking the TGF-β1 pathway.35
Machine learning has extensive applications in the biomedical field, demonstrating excellent efficiency in clinical diagnosis and optimal treatment.36 In this study, we applied two machine learning algorithms to screen marker genes from DE-FRGs and identified H19, GCH1, CHAC1, NOX4, CDKN1A, and SMAD7 as potentially effective diagnostic molecules for keratoconus. For these 6 marker genes, the AUC values in the validation sets were 0.878, 0.734, and 0.857, respectively, demonstrating that these marker genes were accurate and specific for distinguishing keratoconus patients from healthy individuals. Notably, GCH1 and CHAC1 had the highest AUC values. The expression of marker genes was then verified in the new dataset GSE204791, and the expression trends of these markers in the corneal epithelium and stroma of keratoconus patients were consistent with expectations. In particular, the GCH1 gene showed low expression in various tissues. For these reasons, GCH1 could not be effectively detected via qRT‒PCR. Finally, qRT‒PCR analysis of clinical samples indicated that the H19 gene was upregulated in the keratoconus group, confirming the initial hypothesis. Additionally, according to the qRT‒PCR results, CHAC1 was also upregulated in the keratoconus group, contrary to our expectations. We plan to increase the sample size in subsequent studies for further validation.
H19 is a long noncoding RNA (lncRNA). The lncRNA H19 contributes to oxidative damage repair in early age-related cataracts by regulating the miR-29a/TDG axis.37 In diabetic retinopathy, H19 overexpression prevents glucose-induced endothelial mesenchymal transition through TGF-β signaling.38 The guanosine 5′-triphosphate cyclohydrolase-1 (GCH1)/tetrahydrobiopterin (BH4) pathway, in which GCH1 is the rate-limiting enzyme, is a crucial regulatory system for ferroptosis.39 The expression level of GCH1 largely determines the degree of cell resistance to ferroptosis, and downregulation of GCH1 promotes peroxidation accumulation and ferroptosis in cells.40 Glutathione-specific gamma-glutamylcyclotransferase 1 (CHAC1), a component of the unfolded protein response pathway, plays a key role in oxidative stress-induced ferroptosis by regulating glutathione depletion.41 NADPH oxidases (NOXs) are a family of ROS-producing enzymes, and among the NOX isoforms, NOX4 is a major isoform in astrocytes.42 In a rabbit keratoconus model, RT‒PCR revealed that the NOX-4 mRNA level was higher in the keratoconus group than in the control group,43 which is consistent with our qRT‒PCR results. In Alzheimer’s disease, NOX4 promotes ferroptosis of astrocytes via oxidative stress-induced lipid peroxidation via the impairment of mitochondrial metabolism.44 Cyclin-dependent kinase inhibitor 1A (CDKN1A) is a key mediator of p53-dependent cell cycle arrest after DNA damage.45 p53 suppresses ferroptosis by inducing the expression of CDKN1A.46 SMAD family member 7 (SMAD7) is a negative regulator of the TGF-β signaling pathway, and SMAD7 expression is downregulated in human keratoconus cells (HKCs) compared to that in normal human corneal fibroblasts. This regulation of SMAD7 expression leads to increased TGF-β signaling, which promotes the formation of a fibrotic ECM characteristic of HKCs.47,48 However, the exact role of these 6 ferroptosis-related marker genes in keratoconus pathogenesis remains unknown and requires further study.
To further explore the potential associations between H19, GCH1, CHAC1, NOX4, CDKN1A, SMAD7 and keratoconus, we performed single-gene GSEA. The results indicated that these 6 biomarkers might play key roles in the pathogenesis of keratoconus through apoptosis, ECM-receptor interactions, immune responses, and TGF-β signaling pathways. Notably, keratoconus is classically considered to be a noninflammatory disease,49 however, both GO and GSEA suggested that the pathogenesis of keratoconus is related to immunity, and we therefore performed immune cell infiltration analysis. The proportions of M1 macrophages and resting mast cells were higher in keratoconus samples than in normal samples, while CD8+ T cells were downregulated in keratoconus samples, and H19, GCH1, CHAC1, and CDKN1A might be involved in the alteration of the immune microenvironment. It has been shown that the pathogenesis of keratoconus may be related to immunity, and the levels of immunoglobulin (Ig) are increased in the serum of keratoconus patients compared to those in the controls.50 Increased Ig κ chain C and Ig J levels in keratoconus tears have also been reported, suggesting that B-cell function may be altered in patients with keratoconus.51 Many cytokine changes are also found in the tears of patients with keratoconus, and high expression of the cytokines C-C motif chemokine ligand 5, matrix metalloproteinase 13, and nerve growth factor and low expression of interleukin 6 have been reported in severe keratoconus.52 Single-cell sequencing of keratoconus samples revealed increased cytokine and cytokine-mediated signaling pathway expression in corneal immune cells.53 Therefore, previous studies have suggested that immunological factors might be involved in the pathogenesis of keratoconus, yet the underlying mechanism remains unclear.
In conclusion, this study used a comprehensive strategy to screen and validate ferroptosis biomarkers associated with keratoconus and explored the functions and pathways of these biomarkers. Our results can contribute to an improved understanding of the molecular mechanism of keratoconus and provide new ideas for further elucidating the pathogenesis, diagnosis and precision treatment of keratoconus. Subsequently, we will perform further experimental validation studies to explore the underlying molecular mechanism of ferroptosis in keratoconus.
Conclusion
In conclusion, this study identified 6 DE-FRGs and established a diagnostic model with predictive value for keratoconus. Validation of these genes was subsequently conducted using the GSE204791 dataset and qRT‒PCR of corneal tissues from keratoconus patients. The findings of this study offer novel molecular biology insight into the pathogenic mechanisms of keratoconus.
Data Sharing Statement
The datasets analyzed during the current study are available in the “GSE151631, GSE77938, and GSE204791”, (http://www.ncbi.nlm.nih.gov/geo/).
Ethics Approval and Consent to Participate
This study complied with the Declaration of Helsinki and was approved by the Ethics Committee of the First Affiliated Hospital of Harbin Medical University (No. 2023IIT235). Written informed consent was obtained from all study participants.
Author Contributions
All authors made a significant contribution to the work reported, whether that is in the conception, study design, execution, acquisition of data, analysis and interpretation, or in all these areas; took part in drafting, revising or critically reviewing the article; gave final approval of the version to be published; have agreed on the journal to which the article has been submitted; and agree to be accountable for all aspects of the work.
Funding
This work has been supported by the National Natural Science Foundation of China (Grant No. U20A20363, 81970776), the Natural Science Foundation of Heilongjiang Province, China (Grant No. LH2020H039), Heilongjiang Provincial Higher Education Fundamental Research Project, (2021-KYYWF-0226), Provincial key research and development plan guidance project (GZ20220125, JD22C006).
Disclosure
The authors declare that they have no competing interests in this work.
References
1. Ferrari G, Rama P. The keratoconus enigma: a review with emphasis on pathogenesis. Ocul Surf. 2020;18:363–373. doi:10.1016/j.jtos.2020.03.006
2. Hashemi H, Heydarian S, Hooshmand E, et al. The prevalence and risk factors for keratoconus: a systematic review and meta-analysis. Cornea. 2020;39:263–270. doi:10.1097/ICO.0000000000002150
3. Torres Netto EA, Al-Otaibi WM, Hafezi NL, et al. Prevalence of keratoconus in paediatric patients in Riyadh, Saudi Arabia. Br J Ophthalmol. 2018;102:1436–1441. doi:10.1136/bjophthalmol-2017-311391
4. Assiri AA, Yousuf BI, Quantock AJ, et al. Incidence and severity of keratoconus in Asir province, Saudi Arabia. Br J Ophthalmol. 2005;89:1403–1406. doi:10.1136/bjo.2005.074955
5. Krachmer JH, Feder RS, Belin MW. Keratoconus and related noninflammatory corneal thinning disorders. Surv Ophthalmol. 1984;28:293–322. doi:10.1016/0039-6257(84)90094-8
6. Cao JY, Dixon SJ. Mechanisms of ferroptosis. Cell Mol Life Sci. 2016;73:2195–2209. doi:10.1007/s00018-016-2194-1
7. Dixon SJ, Lemberg KM, Lamprecht MR, et al. Ferroptosis: an iron-dependent form of nonapoptotic cell death. Cell. 2012;149:1060–1072. doi:10.1016/j.cell.2012.03.042
8. Yang WS, SriRamaratnam R, Welsch ME, et al. Regulation of ferroptotic cancer cell death by GPX4. Cell. 2014;156:317–331. doi:10.1016/j.cell.2013.12.010
9. Bertrand RL. Iron accumulation, glutathione depletion, and lipid peroxidation must occur simultaneously during ferroptosis and are mutually amplifying events. Med Hypotheses. 2017;101:69–74. doi:10.1016/j.mehy.2017.02.017
10. Jiang X, Stockwell BR, Conrad M. Ferroptosis: mechanisms, biology and role in disease. Nat Rev Mol Cell Biol. 2021;22:266–282. doi:10.1038/s41580-020-00324-8
11. Sakai O, Uchida T, Imai H, et al. Glutathione peroxidase 4 plays an important role in oxidative homeostasis and wound repair in corneal epithelial cells. FEBS Open Bio. 2016;6:1238–1247. doi:10.1002/2211-5463.12141
12. Totsuka K, Ueta T, Uchida T, et al. Oxidative stress induces ferroptotic cell death in retinal pigment epithelial cells. Exp Eye Res. 2019;181:316–324. doi:10.1016/j.exer.2018.08.019
13. Liu P, Zhang M, Shoeb M, et al. Metal chelator combined with permeability enhancer ameliorates oxidative stress-associated neurodegeneration in rat eyes with elevated intraocular pressure. Free Radic Biol Med. 2014;69:289–299. doi:10.1016/j.freeradbiomed.2014.01.039
14. Obolensky A, Berenshtein E, Lederman M, et al. Zinc-desferrioxamine attenuates retinal degeneration in the rd10 mouse model of retinitis pigmentosa. Free Radic Biol Med. 2011;51:1482–1491. doi:10.1016/j.freeradbiomed
15. Wei Z, Hao C, Huangfu J, et al. Aging lens epithelium is susceptible to ferroptosis. Free Radic Biol Med. 2021;167:94–108. doi:10.1016/j.freeradbiomed.2021.02.010
16. Zhang J, Sheng S, Wang W, et al. Molecular mechanisms of iron mediated programmed cell death and its roles in eye diseases. Front Nutr. 2022;9:844757. doi:10.3389/fnut.2022.844757
17. Rouault TA. The role of iron regulatory proteins in mammalian iron homeostasis and disease. Nat Chem Biol. 2006;2:406–414. doi:10.1038/nchembio807
18. Liu K, Li H, Wang F, et al. Ferroptosis: mechanisms and advances in ocular diseases. Mol Cell Biochem. 2023;478:2081–2095. doi:10.1007/s11010-022-04644-5
19. Shinde V, Hu N, Mahale A, et al. RNA sequencing of corneas from two keratoconus patient groups identifies potential biomarkers and decreased NRF2-antioxidant responses. Sci Rep. 2020;10:9907. doi:10.1038/s41598-020-66735-x
20. Kabza M, Karolak JA, Rydzanicz M, et al. Collagen synthesis disruption and downregulation of core elements of TGF-β, Hippo, and Wnt pathways in keratoconus corneas. Eur J Hum Genet. 2017;25:582–590. doi:10.1038/ejhg.2017.4
21. Stachon T, Nastaranpour M, Seitz B, et al. Altered regulation of mRNA and miRNA expression in epithelial and stromal tissue of keratoconus corneas. Invest Ophthalmol Vis Sci. 2022;63:7. doi:10.1167/iovs.63.8.7
22. Zhou N, Yuan X, Du Q, et al. FerrDb V2: update of the manually curated database of ferroptosis regulators and ferroptosis-disease associations. Nucleic Acids Res. 2023;51:D571–582. doi:10.1093/nar/gkac935
23. Alhamzawi R, Ali HTM. The Bayesian adaptive lasso regression. Math Biosci. 2018;303:75–82. doi:10.1016/j.mbs.2018.06.004
24. Lin X, Yang F, Zhou L, et al. A support vector machine-recursive feature elimination feature selection method based on artificial contrast variables and mutual information. J Chromatogr B Analyt Technol Biomed Life Sci. 2012;910:149–155. doi:10.1016/j.jchromb.2012.05.020
25. Wagner AH, Coffman AC, Ainscough BJ, et al. DGIdb 2.0: mining clinically relevant drug-gene interactions. Nucleic Acids Res. 2016;44:D1036–44. doi:10.1093/nar/gkv1165
26. Lu Y, Vitart V, Burdon KP, et al. Genome-wide association analyses identify multiple loci associated with central corneal thickness and keratoconus. Nat Genet. 2013;45:155–163. doi:10.1038/ng.2506
27. Gain P, Jullienne R, He Z, et al. Global survey of corneal transplantation and eye banking. JAMA Ophthalmol. 2016;134:167–173. doi:10.1001/jamaophthalmol
28. Kuang F, Liu J, Tang D, et al. Oxidative damage and antioxidant defense in ferroptosis. Front Cell Dev Biol. 2020;8:586578. doi:10.3389/fcell.2020.586578
29. Navel V, Malecaze J, Pereira B, et al. Oxidative and antioxidative stress markers in keratoconus: a systematic review and meta-analysis. Acta Ophthalmol. 2021;99:e777–794. doi:10.1111/aos.14714
30. Lasagni Vitar RM, Bonelli F, Rama P, et al. Nutritional and metabolic imbalance in keratoconus. Nutrients. 2022;14:193. doi:10.3390/nu14040913
31. Matthews FJ, Cook SD, Majid MA, et al. Changes in the balance of the tissue inhibitor of matrix metalloproteinases (TIMPs)-1 and −3 may promote keratocyte apoptosis in keratoconus. Exp Eye Res. 2007;84:1125–1134. doi:10.1016/j.exer.2007.02.013
32. Piñero DP, Alió JL, Alesón A, et al. Corneal volume, pachymetry, and correlation of anterior and posterior corneal shape in subclinical and different stages of clinical keratoconus. J Cataract Refract Surg. 2010;36:814–825. doi:10.1016/j.jcrs.2009.11.012
33. Runager K, Basaiawmoit RV, Deva T, et al. Human phenotypically distinct TGFBI corneal dystrophies are linked to the stability of the fourth FAS1 domain of TGFBIp. J Biol Chem. 2011;286:4951–4958. doi:10.1074/jbc.M110.181099
34. Bao W, Wang J, Fan K, et al. PIAS3 promotes ferroptosis by regulating TXNIP via TGF-β signaling pathway in hepatocellular carcinoma. Pharmacol Res. 2023;196:106915. doi:10.1016/j.phrs.2023.106915
35. Yang Z, Jiang W, Xiong C, et al. Calcipotriol suppresses GPX4-mediated ferroptosis in OA chondrocytes by blocking the TGF-β1 pathway. Cytokine. 2023;171:156382. doi:10.1016/j.cyto.2023.156382
36. Huang D, Zheng S, Liu Z, et al. Machine learning revealed ferroptosis features and a novel ferroptosis-based classification for diagnosis in acute myocardial infarction. Front Genet. 2022;13:813438. doi:10.3389/fgene.2022.813438
37. Cheng T, Xu M, Qin B, et al. lncRNA H19 contributes to oxidative damage repair in the early age-related cataract by regulating miR-29a/TDG axis. J Cell Mol Med. 2019;23:6131–6139. doi:10.1111/jcmm.14489
38. Thomas AA, Biswas S, Feng B, et al. lncRNA H19 prevents endothelial-mesenchymal transition in diabetic retinopathy. Diabetologia. 2019;62:517–530. doi:10.1007/s00125-018-4797-6
39. Hu Q, Wei W, Wu D, et al. Blockade of GCH1/BH4 axis activates ferritinophagy to mitigate the resistance of colorectal cancer to erastin-induced ferroptosis. Front Cell Dev Biol. 2022;10:810327. doi:10.3389/fcell.2022.810327
40. Liu Y, Lu S, L-L W, et al. The diversified role of mitochondria in ferroptosis in cancer. Cell Death Dis. 2023;14:519. doi:10.1038/s41419-023-06045-y
41. Liu Y, Wu D, Fu Q, et al. CHAC1 as a novel contributor of ferroptosis in retinal pigment epithelial cells with oxidative damage. Int J Mol Sci. 2023;24:1582. doi:10.3390/ijms24021582
42. Nayernia Z, Jaquet V, Krause K-H. New insights on NOX enzymes in the central nervous system. Antioxid Redox Signal. 2014;20:2815–2837. doi:10.1089/ars.2013.5703
43. Liu R, Yan X. Oxidative stress in corneal stromal cells contributes to the development of keratoconus in a rabbit model. Eur J Ophthalmol. 2021;31:3518–3524. doi:10.1177/11206721211028745
44. Park MW, Cha HW, Kim J, et al. NOX4 promotes ferroptosis of astrocytes by oxidative stress-induced lipid peroxidation via the impairment of mitochondrial metabolism in Alzheimer’s diseases. Redox Biol. 2021;41:101947. doi:10.1016/j.redox.2021.101947
45. Abbas T, Dutta A. p21 in cancer: intricate networks and multiple activities. Nat Rev Cancer. 2009;9:400–414. doi:10.1038/nrc2657
46. Kang R, Kroemer G, Tang D. The tumor suppressor protein p53 and the ferroptosis network. Free Radic Biol Med. 2019;133:162–168. doi:10.1016/j.freeradbiomed.2018.05.074
47. Priyadarsini S, McKay TB, Sarker-Nag A, et al. Keratoconus in vitro and the key players of the TGF-β pathway. Mol Vis. 2015;21:577–588.
48. Sharif R, Hjortdal J, Sejersen H, et al. Human in vitro model reveals the effects of collagen cross-linking on keratoconus pathogenesis. Sci Rep. 2017;7:12517. doi:10.1038/s41598-017-12598-8
49. Galvis V, Sherwin T, Tello A, et al. Keratoconus: an inflammatory disorder? Eye. 2015;29:843–859. doi:10.1038/eye.2015.63
50. Shetty R, Sureka S, Kusumgar P, et al. Allergen-specific exposure associated with high immunoglobulin E and eye rubbing predisposes to progression of keratoconus. Indian J Ophthalmol. 2017;65:399–402. doi:10.4103/ijo.IJO_217_17
51. Acera A, Vecino E, Rodríguez-Agirretxe I, et al. Changes in tear protein profile in keratoconus disease. Eye. 2011;25:1225–1233. doi:10.1038/eye.2011.105
52. Kolozsvári BL, Petrovski G, Gogolák P, et al. Association between mediators in the tear fluid and the severity of keratoconus. Ophthalmic Res. 2014;51:46–51. doi:10.1159/000351626
53. Dou S, Wang Q, Zhang B, et al. Single-cell atlas of keratoconus corneas revealed aberrant transcriptional signatures and implicated mechanical stretch as a trigger for keratoconus pathogenesis. Cell Discov. 2022;8:66. doi:10.1038/s41421-022-00397-z
 © 2024 The Author(s). This work is published and licensed by Dove Medical Press Limited. The full terms of this license are available at https://www.dovepress.com/terms.php and incorporate the Creative Commons Attribution - Non Commercial (unported, v3.0) License.
By accessing the work you hereby accept the Terms. Non-commercial uses of the work are permitted without any further permission from Dove Medical Press Limited, provided the work is properly attributed. For permission for commercial use of this work, please see paragraphs 4.2 and 5 of our Terms.
© 2024 The Author(s). This work is published and licensed by Dove Medical Press Limited. The full terms of this license are available at https://www.dovepress.com/terms.php and incorporate the Creative Commons Attribution - Non Commercial (unported, v3.0) License.
By accessing the work you hereby accept the Terms. Non-commercial uses of the work are permitted without any further permission from Dove Medical Press Limited, provided the work is properly attributed. For permission for commercial use of this work, please see paragraphs 4.2 and 5 of our Terms.