")
Back to Journals » Nature and Science of Sleep » Volume 15
Functional Connectivity of White Matter and Its Association with Sleep Quality
Authors Jiang C , Cai S, Zhang L
Received 6 February 2023
Accepted for publication 4 April 2023
Published 22 April 2023 Volume 2023:15 Pages 287—300
DOI https://doi.org/10.2147/NSS.S406120
Checked for plagiarism Yes
Review by Single anonymous peer review
Peer reviewer comments 2
Editor who approved publication: Prof. Dr. Ahmed BaHammam
Chunxiang Jiang,1,2 Siqi Cai,1,2 Lijuan Zhang1,2
1Paul. C. Lauterbur Research Center for Biomedical Imaging, Shenzhen Institute of Advanced Technology, Chinese Academy of Sciences, Shenzhen, People’s Republic of China; 2University of Chinese Academy of Sciences, Beijing, People’s Republic of China
Correspondence: Lijuan Zhang, Paul. C. Lauterbur Research Center for Biomedical Imaging, Shenzhen Institute of Advanced Technology, Chinese Academy of Sciences, 1068 Xueyuan Avenue, Shenzhen University Town, Shenzhen, 518055, People’s Republic of China, Tel +86 0755 86392247, Fax +86 0755 86392299, Email [email protected]
Purpose: Functional magnetic resonance imaging (fMRI) has been widely adopted to investigate the neural activity in gray matter (GM) in the field of sleep research, but the neural activity in white matter (WM) has received much less attention. The current study set out to test our hypothesis that WM functional abnormality is associated with poor sleep quality.
Participants and Methods: K-means clustering analysis was performed on 78 healthy adults drawn from the Human Connectome Project dataset to extract stable WM functional networks (WM-FNs) and GM-FNs. The differences in functional connectivity within WM-FNs and between WM- and GM-FNs, as well as the power spectrum between good sleep quality group (Pittsburgh Sleep Quality Index (PSQI) < 6, daytime dysfunction = 0) and poor sleep quality group (PSQI > 6, daytime dysfunction > 0) were examined between groups with good and poor sleep quality. Additionally, linear relationships between sleep quality and altered functional characteristics of WM-FNs were evaluated.
Results: Functional connectivity between middle and superficial WM-FNs, short- and long-range functional connectivity between WM- and GM-FNs were decreased in poor sleepers and negatively correlated with PSQI score. The mean amplitudes of right sensorimotor WM networks at whole, high and low frequency bands were higher in poor sleepers and were positively correlated with PSQI score.
Conclusion: WM functional abnormality is associated with poor sleep quality. The neurobiological mechanisms that underlie the functional alterations of WM-FNs in poor sleepers need to be investigated in future studies.
Keywords: human connectome project, sleep quality, white matter, functional connectivity, functional magnetic resonance imaging
Introduction
Sleep plays an essential role in the restoration and preservation of optimal brain function, although its functions remain to be fully elucidated. Poor sleep quality or sleep loss not only has a negative influence on attention, cognition, emotion and motion,1,2 but also increases the risk of neurological,3,4 psychiatric5,6 and cardiovascular diseases.7,8
The neural mechanisms that underlie poor sleep quality have been investigated in many aspects, such as gray matter (GM) structure and function, white matter (WM) integrity and immune system,9–11 yet how WM functional activity is related to sleep quality has received much less attention, especially in humans. Brain WM consists of axons and myelin sheath that facilitate electrical signal transmission between neurons. Animal studies have shown that sleep loss reduces myelin thickness and down-regulates transcripts involving myelin formation.12–14 In humans, poor sleep quality and sleep disorders were found to be associated with lower WM integrity in multiple brain regions.15–17 In addition, reduced WM structural connectivity has been demonstrated to be associated with poor sleep quality.18,19 Considering the complicated interplay between brain structure and function, these findings lead us to the hypothesis that WM structural alterations related to poor sleep quality may in turn lead to WM functional abnormality.
Relative to the abundance of studies assessing the links between WM structural characteristics and sleep quality/quantity, research investigating the role of WM functional activity played in sleep remains limited in humans. Currently, the blood oxygenation level-dependent functional MRI (BOLD-fMRI) technique has been proven to be a powerful tool to assess whole brain functional activity.20 In recent decades, BOLD-fMRI has been used to accumulate knowledge on how sleep quality/sleep disorder affects neural activity and network organization in GM.21,22 However, to our knowledge, no studies have evaluated the association between WM functional activity and sleep quality using WM BOLD signals. This may be ascribed to the engrained belief in the field of fMRI research that BOLD signals in WM have no physiological information and usually are regressed out as “nuisance” during BOLD-fMRI data preprocessing. Recent studies have demonstrated that BOLD signals in WM are robustly detectable under resting state and task conditions, providing evidence that BOLD signals in WM are related to brain functional activity and deserve greater attention.23,24
In this study, we drew 78 well-screened young healthy adults from the Human Connectome Project (HCP) repository to test our hypothesis that functional alterations of WM are associated with poor sleep quality indexed by WM functional connectivity and spontaneous activity. Functional connectivity is a powerful tool to detect the coupled activity between different brain areas/networks.25 Accumulating studies have demonstrated that the functional connectivity in GM alters under poor sleep quality,26 sleep/wake states,27 sleep deprivation,28 and sleep disorders.29 Frequency characteristics embedded in spontaneous BOLD signal fluctuations may reflect different neural activities and physiological functions.30 Power spectrum analysis has found that fluctuation amplitudes of WM functional networks (FNs) change with sleep/wake states.31 Yet the relationship between frequency characteristics in WM and sleep quality has not been investigated. To this end, WM-FNs were obtained using clustering analysis based on WM BOLD-fMRI signals, and functional connectivity within WM-FNs and between WM- and GM-FNs were calculated. Fast Fourier transform was used to calculate the power spectrum at different frequency bands for each WM-FN. Then, the alterations of the abovementioned parameters were investigated between groups with good and poor sleep quality.
Materials and Methods
Participants
Young adult participants were selected from the Human Connectome Project (HCP) Data S1200 release. Individuals with severe neurodevelopmental disorders (eg autism), documented neuropsychiatric disorders (eg schizophrenia or depression) or neurologic disorders (eg Parkinson’s disease), diabetes and high blood pressure were excluded to minimize the possible confounding effects of these diseases on the data analysis.32 Additionally, participants with identified HCP quality control issues (QC_Issue) or without resting-state fMRI data were also excluded from this study, resulting in 162 participants for the subsequent sleep measure. We had access to the HCP database through a signed agreement with Washington University–University of Minnesota Consortium of the Human Connectome Project. The data usage in this study was approved by the Institutional Review Board of Washington University. Informed consent was obtained from all participants. This retrospective study has been exempted by the local Institutional Review Board in compliance with the exemption policy that data sources are publicly available or the information is recorded by the HCP investigator in such a manner that subjects cannot be identified, directly or through identifiers linked to the subjects. We confirm that our study complies with the Declaration of Helsinki.
Sleep Measures
Sleep quality was assessed using the Pittsburgh Sleep Quality Index (PSQI), a self-reported questionnaire to measure seven components of sleep: subjective sleep quality, sleep latency, sleep duration, habitual sleep efficiency, sleep disturbance, use of sleep medication, and daytime dysfunction. To investigate the effect of sleep quality on WM functional networks, PSQI total score and its seventh sub-item score (Comp_7, daytime dysfunction) were adopted to further screen the selected 162 participants. Participants with PSQI total score of <6 and Comp 7=0 were selected as good sleepers (n = 55, 31 males, aged 28.4 ± 4.1 years), whereas people with PSQI total score of >6 and Comp 7 >0 were selected as poor sleepers (n = 23, 12 males, aged 29.0 ± 3.6 years).33 Finally, 78 participants were included in the following analysis.
MRI Data Acquisition
The MRI data were obtained from the public HCP repository (https://db.humanconnectome.org) as part of the HCP 1200 subjects release. The data were acquired on a 3T Siemens Skyra scanner with a 32-channel head coil (Siemens AG, Erlangen, Germany). Resting state fMRI (rsfMRI) data were acquired using a multi-band gradient echo-planar imaging sequence with parameters of TR 720ms, TE 33.1 ms, 2 mm isotropic voxel size, 1200 volumes. Each rsfMRI session consisted of 2 runs with left-to-right and right-to-left phase encoding directions. T1 weighted images were acquired using a 3D magnetization-prepared rapid gradient echo (MPRAGE) sequence with parameters of TR 2.4 s, TE 2.14 s, and 0.7mm isotropic voxel size.
Preprocessing of MRI Data
The MRI data obtained from HCP repository were preprocessed through the minimal preprocessing pipeline (MPP).34 Briefly, T1-weighted images were preprocessed including gradient distortion correction, bias field correction, nonlinear registration to MNI space and parcellation following Freesurfer pipeline. MMP steps for rsfMRI data included motion correction, distortion correction and nonlinear registration to MNI space. Then the preprocessed rsfMRI data underwent regression of nuisance variables, including head movement parameters from the output of MPP pipeline, as well as five principal components extracted from each subject’s CSF mask using a component-based noise correction method (CompCor),35 and followed by a linear trend correction and band-pass temporal filtering (0.01–0.15Hz). The rsfMRI data were spatially smoothed (FWHM = 4) within WM mask and GM mask separately to avoid mixing WM and GM signals.
Clustering of WM and GM Functional Networks
WM parcellation derived from Freesurfer across all subjects was averaged. Voxels identified in >60% of the subjects were selected to generate a group-level WM mask in order to keep as many valuable voxels due to individual differences in WM.23,31 A group-level GM mask was reconstructed in a similar manner. Then the group-level WM and GM masks were compared with fMRI data; voxels having functional data of less than 80% of the subjects were removed. The resulting group-level WM and GM masks had 66,888 and 60,012 voxels, respectively.
To reduce the computational demands, the group-level WM mask was downsampled in an interchanging grid manner.23 Specifically, every second voxel along the image rows and columns was kept and shifted by 1 between slices to reduce missing columns of data. Pearson’s correlation coefficients between each group-level WM voxel and downsampled voxels were calculated, resulting in a correlation matrix (66,888 × 10,796) for each subject. Then a group-level correlation matrix was obtained by averaging the correlation matrices across all subjects. K-means clustering (distance metric correlation, 10 replicates) was performed on the group-level correlation matrix, with k ranging between 2 and 22. In order to obtain the most stable number of WM networks, the group-level correlation matrix was randomly divided into four folds along the column dimension. For each k, clustering was performed on each fold, and the adjacency matrix was calculated. Dice’s coefficient was calculated to compare the similarity of every pair of these four adjacency matrices. Then, the Dice’s coefficients were averaged to assess the stability of clustering for each k. For the GM, similar k-means clustering and stability analysis were performed to identify the stable GM functional networks.
Functional Connectivity of WM Functional Networks
After clustering analysis, the mean rsfMRI time courses for each WM-FN and GM-FN were extracted by averaging the time courses across all voxels within the same network for each subject. Then, Pearson’s correlation coefficients between each pair of WM-FNs were calculated and transformed to Fisher’s z score. In addition, Pearson’s correlation coefficients between every pair of WM-FN and GM- FN were also calculated to evaluate the relationship between WM and GM.
Power Spectral Analysis of WM Functional Networks
Spontaneous oscillations of BOLD signals at different frequency bands may reflect different neural activities and physiological functions.30,36 Consistent with a previous study on WM BOLD signals, the whole band (band A: 0.01–0.15 Hz) was further divided into two sub-bands (band B: 0.01–0.08 Hz; band C: 0.08–0.15 Hz).37 Signal amplitudes in each frequency were calculated using Fourier transform (MATLAB’s FFT function), and then the amplitudes at each frequency band were averaged for each WM- and GM-FN of each subject.
Statistical Analyses
The group difference in sex was tested using chi-square test, and the differences in age, PSQI total score, daytime dysfunction score, functional connectivity within WM-FNs and between WM-FNs and GM-FNs, and frequency characteristics between good sleepers and poor sleepers were tested using two sample t-test (P <0.05, false discovery rate (FDR) corrected). Pearson’s correlation analysis was used to measure the relationship between PSQI total score and significant functional connectivity as well as frequency characteristics (P <0.05, Bonferroni corrected).
Results
Demographic Characteristics
Demographic information and sleep quality data are summarized in Table 1. There were no significant differences between good sleepers and poor sleepers in age (t = −0.653, P = 0.516) or sex (χ2 = 0.115, P = 0.734), but the poor sleepers showed higher PSQI total score (t = −16.327, P <0.001) and daytime dysfunction score (Comp_7, t = −17.472, P <0.001).
 |
Table 1 Demographic Characteristics of Good Sleeper and Poor Sleeper Groups |
Identification of WM and GM Functional Networks
K-means clustering was adopted to identify WM-FNs and GM-FNs from 78 healthy young adults. Dice’s coefficients at different k are shown in Figure 1. The local peaks of the Dice’s coefficients that represented the most stable clustering were located at k =2, 5, 7, 14 (Figure 1A) for WM, and at k = 2, 4, 10, 12 for GM (Figure 1B). In order to characterize the most detailed information of WM-FNs and GM-FNs, k = 14 and k = 12 clusters were adopted for WM and GM, respectively, in the following analysis.
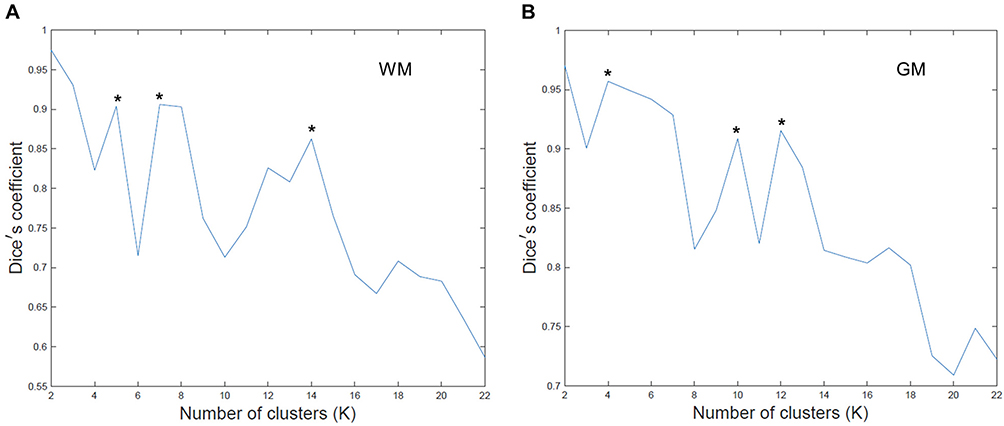 |
Figure 1 Dice’s coefficients at different clustering number K for WM (A) and GM (B). * Indicates the local peaks that represented the most stable clustering results. |
The 14 WM-FNs included one cerebellar network and 13 cerebral networks (Figure 2A). Consistent with previous studies, the WM-FNs could be classified as deep, middle and superficial layers based on the spatial locations (Figure 2B).23 The detailed information about these WM-FNs is summarized in Table 2. Twelve GM-FNs were identified, closely corresponding to known cortical network sub-divisions,38–40 which were labeled as visual network (GM1), posterior cerebellar network (GM2), anterior cerebellar network (GM3), default mode network A (GM4), sensorimotor network (GM5), control network A (GM6), ventral attention network (GM7), control network B (GM8), default mode network B (GM9), putamen–pallidum network (GM10), thalamus–caudate network (GM11), and limbic–temporal network (GM12) (Figure 3).
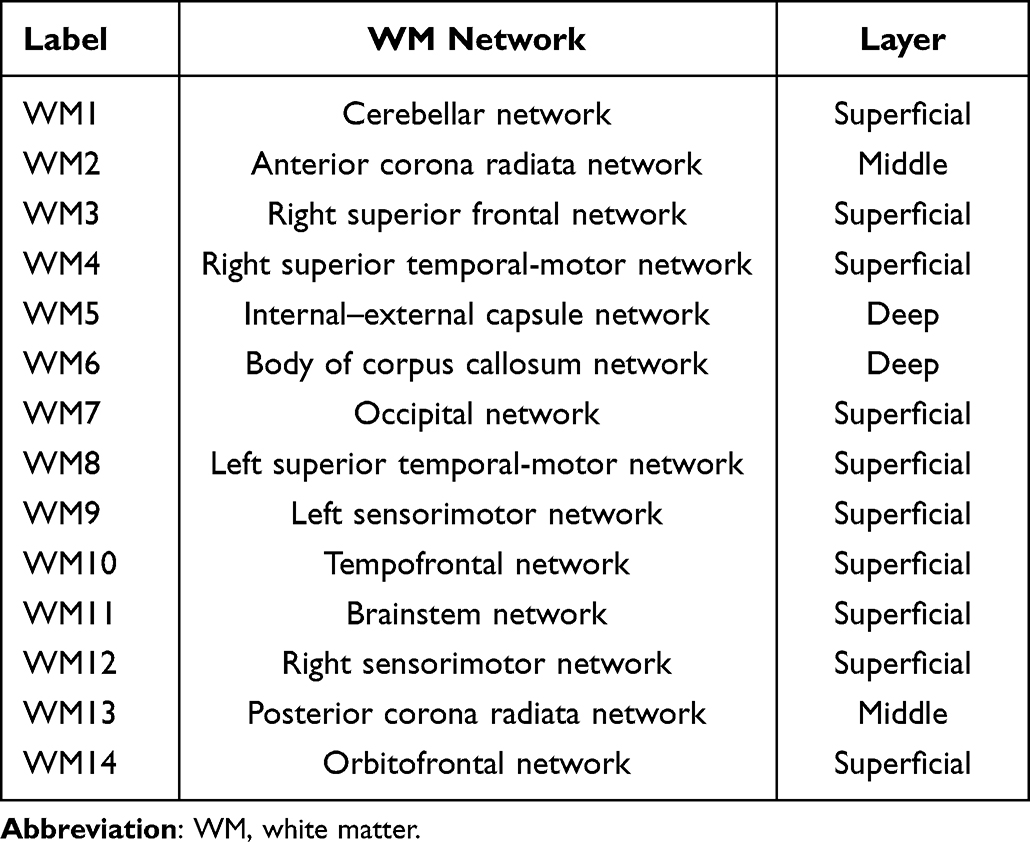 |
Table 2 Spatial Information of WM Functional Networks |
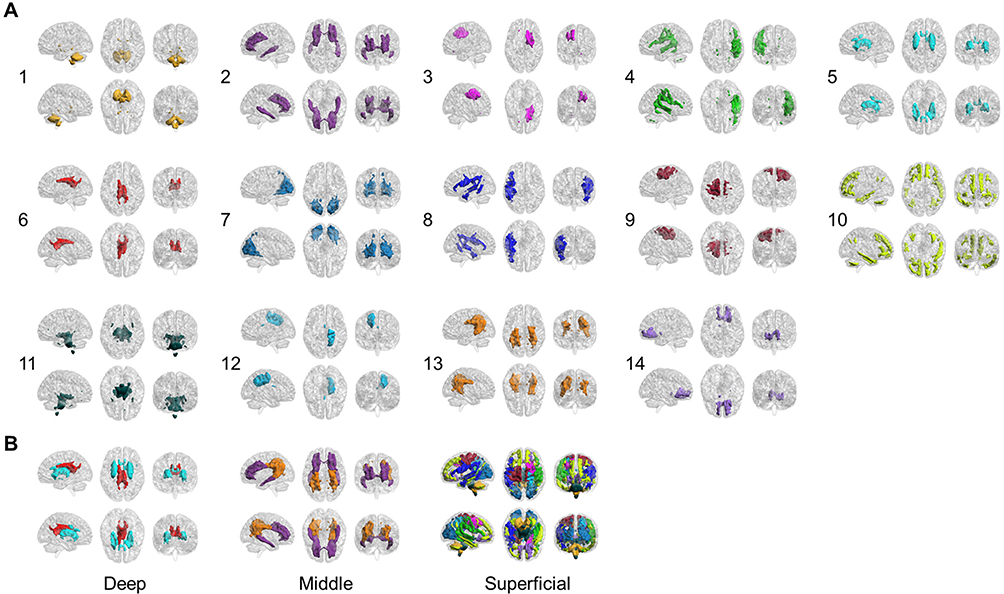 |
Figure 2 (A) Six views for each of the 14 WM functional networks. (B) WM functional networks can be spatially classified as deep, middle and superficial layers. |
 |
Figure 3 Spatial layout of 12 identified GM functional networks. 1: visual network; 2: posterior cerebellar network; 3: anterior cerebellar network; 4: default mode network A; 5: sensorimotor network; 6: control network A; 7: ventral attention network; 8: control network B; 9: default mode network B; 10: putamen–pallidum network; 11: thalamus–caudate network; 12: limbic–temporal network. |
Functional Connectivity Within WM-FNs
The relationship between different WM-FNs was evaluated by functional connectivity. Based on two sample t-tests, five pairs of WM functional networks showed a significant difference between good sleepers and poor sleepers (Figure 4). Functional connectivity between posterior corona radiata (WM13) and bilateral superior temporal and motor (WM4, WM8) and left sensorimotor (WM9) networks, between visual (WM7) and left sensorimotor (WM9), between anterior corona radiata network (WM2) and right superior temporal and motor (WM4) were significantly decreased in poor sleepers (P <0.05, FDR corrected).
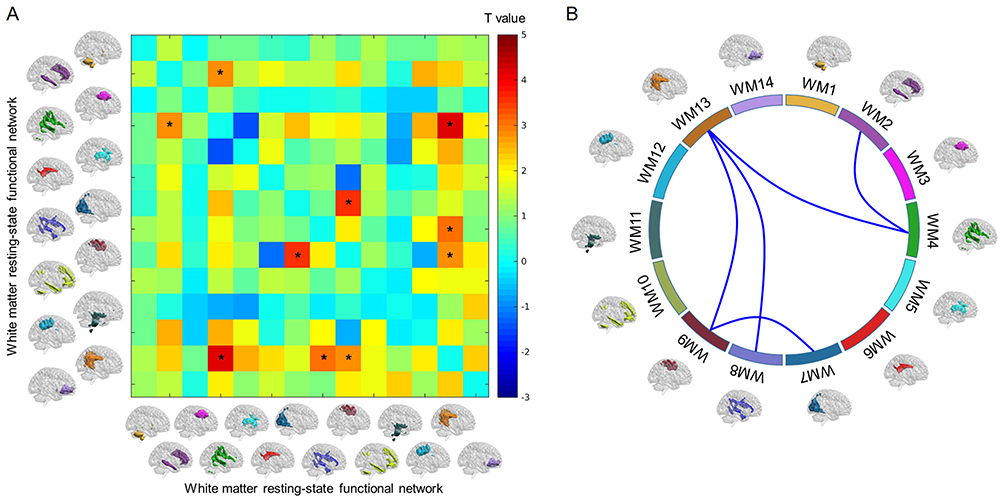 |
Figure 4 (A) Differences in functional connectivity within WM-FNs between good sleepers and poor sleepers. The color bar shows T value of two sample t-test. *Represents significant difference after FDR correction. (B) Five pairs of WM-FNs that showed significant difference in functional connectivity between good sleepers and poor sleepers. |
Functional Connectivity Between WM-FNs and GM-FNs
To further explore the relationship between WM-FNs and GM-FNs, functional connectivity was also calculated between each pair of WM-FN and GM-FN. The two groups showed no differences in functional connectivity between WM-FNs and GM-FNs after FDR correction for multiple comparisons. But the poor sleepers showed a decreased trend in functional connectivity between posterior corona radiata (WM13) and cortical visual network (GM1) (P < 0.01, uncorrected) and subcortical networks including putamen–pallidum network (GM10) (P < 0.01, uncorrected) and thalamus–caudate network (GM11) (P < 0.01, uncorrected), between orbitofrontal network (WM14) and two cerebellar networks (GM2, GM3) (P < 0.005, uncorrected) (Figure 5).
 |
Figure 5 (A) Differences in functional connectivity between WM and GM functional networks between good sleepers and poor sleepers. The color bar shows T value of two sample t-test. *Represents statistical significance (P <0.05, uncorrected). (B) Five pairs of functional connectivity between WM-FNs and GM-FNs showed a decreased trend in poor sleepers. |
Frequency Characteristics of WM-FNs
Based on the power spectral analysis, for both groups, all WM-FNs showed a gradual decrease in amplitude with increased frequency. The superficial and deep WM-FNs showed maximal amplitude at ~0.01Hz, whereas the middle layer WM-FNs (WM2 and WM13) showed maximal amplitude at ~0.07Hz (Figure 6A). The amplitudes at the whole frequency (band A: 0.01–0.15Hz) and high frequency (band C: 0.08–0.15Hz) were increased in the right sensorimotor network (WM12) in poor sleepers, whereas the amplitude at low frequency (band B: 0.01–0.08Hz) showed an increased trend in poor sleepers without passing FDR correction (P < 0.05, uncorrected) (Figure 6B).
 |
Figure 6 (A) Power spectrum of 14 WM functional networks for good sleepers and poor sleepers. (B) Differences of mean amplitude in three frequency bands between good sleepers and poor sleepers. GS: good sleepers; PS: poor sleepers; Band A 0.01–0.15Hz; Band B 0.01–0.08Hz; Band C 0.08–0.15Hz. *Represents the statistical significance after FDR correction (P <0.05, FDR corrected). |
Relationship Between PSQI Total Score and Altered Characteristics of WM-FNs
Pearson’s correlation analysis was used to measure the association between PSQI total score and significant altered functional connectivity within WM-FNs and between WM-FNs and GM-FNs, as well as the frequency characteristics. The mean amplitudes of WM12 in the whole band (band A: 0.01–0.15Hz), low frequency band (band B: 0.01–0.08Hz) and high frequency band (band C: 0.08–0.15Hz) were found to be positively correlated with PSQI total score (P <0.05, Bonferroni corrected) (Figure 7A). Functional connectivities between WM networks including WM13–WM4 and WM13–WM8 were negatively correlated with PSQI total score (P <0.05, Bonferroni corrected), while functional connectivities between WM9–WM7 and between WM4–WM2 showed a negative correlated trend with PSQI total score (P <0.05, uncorrected) (Figure 7B). In addition, functional connectivities between WM and GM networks including WM13–GM1 and WM14–GM3 were negatively correlated with PSQI total score (P <0.05, Bonferroni corrected), functional connectivities including WM13–GM10, WM13–GM11 and WM14–GM2 showed a negative correlated trend with PSQI total score (P <0.05, uncorrected) (Figure 7C).
 |
Figure 7 Correlations between PSQI total score and altered characteristics of WM functional networks. (A) The amplitudes of three frequency bands of WM8 network were positively correlated with PSQI total score (P <0.05, Bonferroni corrected). (B) Two white matter functional connectivities were negatively correlated with PSQI total score (WM13–WM4, WM 13–WM8, P <0.05, Bonferroni corrected). Functional connectivity between WM9–WM7 and between WM2–WM4 showed negative correlated trend with PSQI total score (P <0.05, uncorrected), but did not pass the Bonferroni correction (illustrated as dotted lines in glass brain). (C) Two functional connectivities between GM and WM were negatively correlated with PSQI total score (WM13–GM1, WM14–GM3, P <0.05, Bonferroni corrected). Functional connectivity between WM13–GM10, between WM13–GM11 and between WM14–GM2 showed negative correlated trend with PSQI total score (P <0.05, uncorrected), but did not pass the Bonferroni correction (illustrated as dotted lines in glass brain). The fitted dotted lines represent 95% confidence interval. |
Discussion
White matter, as a major component of human brain tissue, plays a crucial role in optimal brain function. Despite this, WM activity has been overlooked and misunderstood in the field of fMRI research.41 Recent studies suggest that WM BOLD signal is strongly related with WM microstructure, energy demanding and neurovascular coupling,42–44 although the precise biophysical basis of the BOLD signal in WM remains to be fully revealed. In this study, the association between sleep quality and functional characteristics of WM-FNs was investigated. Fourteen distinct WM-FNs were identified by k-means clustering analysis based on WM BOLD signals. Then, the functional connectivity within the WM-FNs and between WM-FNs and GM-FNs, as well as power spectral characteristics, were compared between good sleep quality group and poor sleep quality group. In addition, the correlations between PSQI total score and the significantly altered characteristics of WM-FNs were also evaluated.
Decreased Functional Connectivity Within WM-FNs is Associated with Poor Sleep Quality
Compared to good sleepers, poor sleepers showed decreased functional connectivity mainly between anterior/posterior corona radiata and bilateral superior temporal-motor networks and left sensorimotor networks (WM13–WM4, WM13–WM8, WM13–WM9, WM2–WM4), as well as visual and left sensorimotor networks (WM7–WM9).
As corona radiata relays information to and from the widespread cerebral cortex, the decreased functional connectivity between corona radiata and sensorimotor, superior temporal-motor networks found in this study may underlie the functional neural basis for the cognitive and behavioral deficits of poor sleepers. Despite a lack of documentation on the functional abnormality in WM-FNs, impaired structural integrity in corona radiata was found in subjects with poor sleep quality, insomnia or major depressive disorders.15,45,46 Dysfunction of neural activity may arise at the local or network level as a result of the impaired structural integrity of WM. Accumulative studies have identified that structural alterations of corona radiata are linked with behavioral deficits, particularly in attention and cognitive control.47–49 Therefore, the decreased functional connectivity within the WM-FNs in this study, especially those involving corona radiata, may serve as a convergent neural basis mediating the behavioral consequences of sleep. Furthermore, these decreased functional connectivities between posterior corona radiata and bilateral superior temporal-motor networks (WM13–WM4, WM13–WM8) were negatively correlated with PSQI total score, suggesting the lower the functional connectivity, the poorer the sleep quality. The links between WM functional connectivity and cognition and behavioral performance should be investigated in future studies.
Decreased Functional Connectivity Between WM-FNs and GM-FNs is Associated with Poor Sleep Quality
Poor sleepers showed a trend of decreased functional connectivity in two pathways: short-range and long-range pathways. The short-range communication included functional connectivity between posterior corona radiata (WM13) and visual cortex, subcortical nuclei including putamen, pallidus, thalamus and caudate (GM1, GM10, GM11). The long-range communication includes orbitofrontal network (WM14) and two cerebellar networks (GM2 and GM3). It should be noted that these alterations did not survive in the FDR correction; however, in the subsequent correlation analysis, the functional connectivity between WM13–GM1 and between WM14–GM3 showed significant negative correlations with PSQI total score, while those between WM13–GM10, between WM13–GM11, and between WM14–GM2 showed a trend of negative correlation (P <0.05, uncorrected).
The subcortical nuclei above are usually involved in networks with functions of sleep and arousal regulation. The thalamus acts as a relay station to process the information between the cortex and sleep–wake control regions of the lower brain, playing a dual-role in controlling wakefulness and sleep.50 The caudate nuclei have been suggested to be a key region for sleep because of their role in reward/sensory processing and regulation of cortical excitability. Reduced recruitment of caudate (reduced BOLD response) during executive functioning was associated with hyper-arousal severity in patients with insomnia.51 Caudate volume was also found to be significantly correlated with sleep duration.52 The putamen receives afferent input from different cortical regions and projects efferent output to the cortex through the thalamus.53 Atrophic changes in the putamen were significantly associated with higher arousal in patients with chronic insomnia.54 A positron emission tomography (PET) study reported that sleep benefit in patients with Parkinson’s disease is associated with the dopamine transporter expression in putamen.55 An animal study found that lesions in globus pallidus remarkably reduced sleep by ~45%, suggesting that globus pallidus promotes sleep.56 Taken together, the structural and functional disruptions in the above subcortical nuclei may alter the neural activity in these regions, which in turn contribute to poor sleep quality. The decreased functional connectivity between posterior corona radiata and these subcortical nuclei found in this study reflects the desynchronized neural activity, indicating impaired communication in the short-range pathway for subjects with poor sleep quality. Given the weak correlation between the functional connectivity of the subcortical nuclei and posterior corona radiata with PSQI total score, caution should be taken in the deduction of sleep quality based on functional connectivity. Further study incorporating molecular and electrophysiological evidence would be helpful to clarify the biological relevance of the WM-FNs variations to sleep quality.
Decreased functional connectivity associated with poor sleep quality was also found in long-range pathways in this study involving orbitofrontal networks and cerebellum networks. Although the link between the functional connectivity of this long-range pathway and sleep quality remains to be elucidated, the breakdown of the functional connectivity of this pathway was found to underlie the negative symptoms (such as lack of motivation, expressive deficits and anhedonia) or suboptimal cognitive control in patients with schizophrenia or emotional disorders.57,58 This evidence suggests behaviorally dependent network activity of the pathway between prefrontal cortex and cerebellum mediating emotional intelligence and cognitive adjustment. Since these symptoms are shared in subjects with sustained poor sleep quality or insomnia, the decreased functional connectivity of the orbitofrontal–cerebellar pathway may underlie the subjective perceptions of daytime performance. In addition, WM structural changes in orbitofrontal regions affected by sleep deprivation and habitual sleep durations have been found in previous studies.45,59 Cerebellum has been increasingly recognized to closely interact with neocortex.60,61 Malfunction of cerebellum can change the sleep–wake cycle, leading to sleep disorders and impaired memory formation and consolidation.62 The decreased functional connectivity between orbitofrontal and cerebellar cortex implied a disrupted interaction between cerebellum and cerebral cortex, and such disruption may also contribute to poor memory performance, which is commonly seen as a consequence of sleep deprivation and poor sleep quality.63
Altered Frequency Characteristics of WM-FNs is Associated with Sleep Quality
For both good sleepers and poor sleepers, middle layer WM-FNs showed a distinct activity pattern with maximal amplitude at ~0.07Hz, whereas superficial and deep WM-FNs showed maximal amplitude at ~0.01Hz. Such a distinct pattern was also found in previous studies on WM BOLD signals,23,31,37 ascribed to specific functions of the middle networks or the heterogeneous characteristics of the BOLD hemodynamic response function in WM. Nonetheless, there was no confirmative explanation for this phenomenon, which should be investigated in future studies.
The mean amplitudes of the right sensorimotor WM network at whole (band A) and high (band C) frequency bands were higher in poor sleepers compared to good sleepers, whereas the mean amplitude at the low frequency band also showed an increased trend in poor sleepers. Furthermore, the mean amplitudes at these three frequency bands were positively correlated with PSQI total score. In the majority of GM BOLD-fMRI studies, the spontaneous low frequency oscillations were mainly focused on the conventional low frequency range (0.01–0,1Hz). Oscillations within different frequency bands showed distinct spatial profiles and were linked to various neural processes and physiological functions.30,36 Considering the differences in energy demands of different cell types, vascular characteristics, and tissue microstructure between GM and WM, the oscillations in WM at different frequency bands may have distinct physiological origins.42 The amplitude of right sensorimotor WM-FN increased with poor sleep quality, indicating abnormality of WM activity or signal transmission along sensorimotor fiber tracts, which may be linked to impaired sensory and motor functions in poor sleepers.
Limitations
There are several limitations in the present study. First, limited to the cross-sectional design, we cannot confirm the causal relationship between poor sleep quality and the altered characteristics of WM-FNs, although the negative impact of poor sleep quality on WM integrity has been reported in previous longitudinal sleep deprivation studies.16,64 Second, cognitive and psychological tests were not included in this study. The association between cognition and alterations of WM-FNs should be explored in future studies to reveal the underlying neural mechanism of cognitive deficits due to poor sleep quality. Third, WM-FNs were derived from k-means clustering analysis based on group-level WM mask. It will be useful in future studies to derive WM-FNs using other approaches, such as independent component analysis, to test the generalization of the findings in this study.
Conclusion
The current work represents the distinct differences in functional connectivity within WM-FNs and between WM-FNs and GM-FNs, as well as power spectral characteristics of WM-FNs between good sleepers and poor sleepers. These differences are highly correlated with sleep quality. Our findings highlight the importance of functional activity of WM in sleep research. This will be of great interest to the sleep field, leading to investigations on the cellular or physiological mechanisms of WM-FNs.
Acknowledgments
This work was supported by GuangDong Basic and Applied Basic Research Foundation (2021A1515010200) and Key Laboratory for Magnetic Resonance and Multimodality Imaging of Guangdong Province (2020B1212060051). Data were provided by the Human Connectome Project, Washington University–University of Minnesota (WU–Minn) Consortium (principal investigators: David Van Essen and Kamil Ugurbil; 1U54MH091657), funded by the 16 NIH institutes and centers that support the NIH Blueprint for Neuroscience Research and by the McDonnell Center for Systems Neuroscience at Washington University.
Disclosure
The authors report no conflicts of interest in this work.
References
1. Killgore WDS. Effects of sleep deprivation on cognition. In: Kerkhof GA, Dongen H, editors. Progress in Brain Research. Vol. 185. Elsevier; 2010:105–129.
2. Lowe CJ, Safati A, Hall PA. The neurocognitive consequences of sleep restriction: a meta-analytic review. Neurosci Biobehav Rev. 2017;80:586–604. doi:10.1016/j.neubiorev.2017.07.010
3. Leng Y, Cappuccio FP, Wainwright NWJ, et al. Sleep duration and risk of fatal and nonfatal stroke. Prospective Study Meta-Analysis. 2015;84(11):1072–1079.
4. Owen JE, Benediktsdottir B, Cook E, Olafsson I, Gislason T, Robinson SR. Alzheimer’s disease neuropathology in the hippocampus and brainstem of people with obstructive sleep apnea. Sleep. 2020;1:53.
5. Zanini MA, Castro J, Cunha GR, et al. Abnormalities in sleep patterns in individuals at risk for psychosis and bipolar disorder. Schizophr Res. 2015;169(1):262–267. doi:10.1016/j.schres.2015.08.023
6. Kaskie RE, Graziano B, Ferrarelli F. Schizophrenia and sleep disorders: links, risks, and management challenges. Nat Sci Sleep. 2017;9:227–239. doi:10.2147/NSS.S121076
7. Kwok CS, Kontopantelis E, Kuligowski G, et al. Self‐Reported Sleep Duration and Quality and Cardiovascular Disease and Mortality: a Dose‐Response Meta‐Analysis. J Am Heart Assoc. 2018;7(15):e008552. doi:10.1161/JAHA.118.008552
8. Lao XQ, Liu X, Deng H-B, et al. Sleep Quality, Sleep Duration, and the Risk of Coronary Heart Disease: a Prospective Cohort Study With 60,586 Adults. J Clin Sleep Med. 2018;14(1):109–117. doi:10.5664/jcsm.6894
9. Kaufmann T, Elvsåshagen T, Alnæs D, et al. The brain functional connectome is robustly altered by lack of sleep. NeuroImage. 2016;127:324–332. doi:10.1016/j.neuroimage.2015.12.028
10. Areal CC, Warby SC, Mongrain V. Sleep loss and structural plasticity. Curr Opin Neurobiol. 2017;44:1–7. doi:10.1016/j.conb.2016.12.010
11. Besedovsky L, Lange T, Haack M. The sleep-immune crosstalk in health and disease. Physiol Rev. 2019;99(3):1325–1380. doi:10.1152/physrev.00010.2018
12. Bellesi M, Haswell JD, de Vivo L, et al. Myelin modifications after chronic sleep loss in adolescent mice. Sleep. 2018;41(5):zsy034. doi:10.1093/sleep/zsy034
13. Bellesi M, Pfister-Genskow M, Maret S, Keles S, Tononi G, Cirelli C. Effects of sleep and wake on oligodendrocytes and their precursors. J Neurosci. 2013;33(36):14288–14300. doi:10.1523/JNEUROSCI.5102-12.2013
14. Cirelli C, Faraguna U, Tononi G. Changes in brain gene expression after long-term sleep deprivation. J Neurochem. 2006;98(5):1632–1645. doi:10.1111/j.1471-4159.2006.04058.x
15. Sexton CE, Zsoldos E, Filippini N, et al. Associations between self-reported sleep quality and white matter in community-dwelling older adults: a prospective cohort study. Hum Brain Mapp. 2017;38(11):5465–5473. doi:10.1002/hbm.23739
16. Elvsåshagen T, Norbom LB, Pedersen PO, et al. Widespread changes in white matter microstructure after a day of waking and sleep deprivation. PLoS One. 2015;10(5):e0127351. doi:10.1371/journal.pone.0127351
17. Li S, Tian J, Bauer A, et al. Reduced integrity of right lateralized white matter in patients with primary insomnia: a Diffusion-Tensor Imaging Study. Radiology. 2016;280(2):520–528. doi:10.1148/radiol.2016152038
18. Li C, Schreiber J, Bittner N, et al. White Matter Microstructure Underlies the Effects of Sleep Quality and Life Stress on Depression Symptomatology in Older Adults. Front Aging Neurosci. 2020;12:12. doi:10.3389/fnagi.2020.00012
19. Jespersen KV, Stevner A, Fernandes H, et al. Reduced structural connectivity in Insomnia Disorder. J Sleep Res. 2020;29(1):e12901. doi:10.1111/jsr.12901
20. Ogawa S, Lee T-M, Kay AR, Tank DW. Brain magnetic resonance imaging with contrast dependent on blood oxygenation. Proce Nat Acad Sci. 1990;87(24):9868–9872. doi:10.1073/pnas.87.24.9868
21. Chee MWL, Zhou J. Chapter 7 - Functional connectivity and the sleep-deprived brain. In: Van Dongen HPA, Whitney P, Hinson JM, Honn KA, Chee MWL, editors. Progress in Brain Research. Vol. 246. Elsevier; 2019:159–176.
22. Li C, Fronczek-Poncelet J, Lange D, et al. Impact of acute sleep deprivation on dynamic functional connectivity states. Hum Brain Mapp. 2020;41(4):994–1005. doi:10.1002/hbm.24855
23. Peer M, Nitzan M, Bick AS, Levin N, Arzy S. Evidence for functional networks within the human brain’s white matter. J Neurosci. 2017;37(27):6394–6407. doi:10.1523/JNEUROSCI.3872-16.2017
24. Ding Z, Huang Y, Bailey SK, et al. Detection of synchronous brain activity in white matter tracts at rest and under functional loading. Proce Nat Acad Sci. 2018;115(3):595–600. doi:10.1073/pnas.1711567115
25. Buckner RL, Krienen FM, Yeo BTT. Opportunities and limitations of intrinsic functional connectivity MRI. Nat Neurosci. 2013;16(7):832–837. doi:10.1038/nn.3423
26. Cheng W, Rolls ET, Ruan H, Feng J. Functional Connectivities in the brain that mediate the association between depressive problems and sleep quality. JAMA Psychiatry. 2018;75(10):1052–1061. doi:10.1001/jamapsychiatry.2018.1941
27. Zhou S, Zou G, Xu J, et al. Dynamic functional connectivity states characterize NREM sleep and wakefulness. Hum Brain Mapp. 2019;40(18):5256–5268. doi:10.1002/hbm.24770
28. Sun J, Zhao R, He Z, et al. Abnormal dynamic functional connectivity after sleep deprivation from temporal variability perspective. Hum Brain Mapp. 2022;43(12):3824–3839. doi:10.1002/hbm.25886
29. Fasiello E, Gorgoni M, Scarpelli S, Alfonsi V, Ferini Strambi L, De Gennaro L. Functional connectivity changes in insomnia disorder: a systematic review. Sleep Med Rev. 2022;61:101569. doi:10.1016/j.smrv.2021.101569
30. Zuo XN, Di Martino A, Kelly C, et al. The oscillating brain: complex and reliable. Neuroimage. 2010;49(2):1432–1445. doi:10.1016/j.neuroimage.2009.09.037
31. Yang Y, Wang S, Liu J, et al. Changes in white matter functional networks during wakefulness and sleep. Hum Brain Mapp. 2022;43(14):4383–4396. doi:10.1002/hbm.25961
32. Van Essen DC, Smith SM, Barch DM, Behrens TEJ, Yacoub E, Ugurbil K. The WU-Minn Human Connectome Project: an overview. NeuroImage. 2013;80:62–79. doi:10.1016/j.neuroimage.2013.05.041
33. Buysse DJ, Reynolds CF, Monk TH, Berman SR, Kupfer DJ. The Pittsburgh Sleep Quality Index: a new instrument for psychiatric practice and research. Psychiatry Res. 1989;28(2):193–213. doi:10.1016/0165-1781(89)90047-4
34. Glasser MF, Sotiropoulos SN, Wilson JA, et al. The minimal preprocessing pipelines for the Human Connectome Project. Neuroimage. 2013;80:105–124. doi:10.1016/j.neuroimage.2013.04.127
35. Behzadi Y, Restom K, Liau J, Liu TT. A component based noise correction method (CompCor) for BOLD and perfusion based fMRI. NeuroImage. 2007;37(1):90–101. doi:10.1016/j.neuroimage.2007.04.042
36. Buzsáki G, Draguhn A. Neuronal oscillations in cortical networks. Science. 2004;304(5679):1926–1929. doi:10.1126/science.1099745
37. Jiang Y, Luo C, Li X, et al. White-matter functional networks changes in patients with schizophrenia. NeuroImage. 2019;190:172–181. doi:10.1016/j.neuroimage.2018.04.018
38. Yeo BT, Krienen FM, Sepulcre J, et al. The organization of the human cerebral cortex estimated by intrinsic functional connectivity. J Neurophysiol. 2011;106(3):1125–1165. doi:10.1152/jn.00338.2011
39. Power JD, Cohen AL, Nelson SM, et al. Functional network organization of the human brain. Neuron. 2011;72(4):665–678. doi:10.1016/j.neuron.2011.09.006
40. Ji JL, Spronk M, Kulkarni K, Repovš G, Anticevic A, Cole MW. Mapping the human brain’s cortical-subcortical functional network organization. Neuroimage. 2019;185:35–57. doi:10.1016/j.neuroimage.2018.10.006
41. Grajauskas LA, Frizzell T, Song X, D’Arcy RCN. White Matter fMRI Activation Cannot Be Treated as a Nuisance Regressor: overcoming a Historical Blind Spot. Front Neurosci. 2019;13. doi:10.3389/fnins.2019.01024
42. Schilling KG, Li M, Rheault F, et al. Anomalous and heterogeneous characteristics of the BOLD hemodynamic response function in white matter. Cerebral Cortex Commun. 2022;3(3). doi:10.1093/texcom/tgac035
43. Li M, Newton AT, Anderson AW, Ding Z, Gore JC. Characterization of the hemodynamic response function in white matter tracts for event-related fMRI. Nat Commun. 2019;10(1):1140. doi:10.1038/s41467-019-09076-2
44. Li M, Gao Y, Ding Z, Gore JC. Power spectra reveal distinct BOLD resting-state time courses in white matter. Proce Nat Acad Sci. 2021;118(44):e2103104118. doi:10.1073/pnas.2103104118
45. Khalsa S, Hale JR, Goldstone A, et al. Habitual sleep durations and subjective sleep quality predict white matter differences in the human brain. Neurobiol Sleep Circadian Rhythms. 2017;3:17–25. doi:10.1016/j.nbscr.2017.03.001
46. Yang Y, Zhu D, Zhang C, et al. Brain Structural and Functional Alterations Specific to Low Sleep Efficiency in Major Depressive Disorder. Front Neurosci. 2020;14. doi:10.3389/fnins.2020.00050
47. Stave EA, De Bellis MD, Hooper SR, Woolley DP, Chang SK, Chen SD. Dimensions of Attention Associated With the Microstructure of Corona Radiata White Matter. J Child Neurol. 2017;32(5):458–466. doi:10.1177/0883073816685652
48. Thillainadesan S, Wen W, Zhuang L, et al. Changes in mild cognitive impairment and its subtypes as seen on diffusion tensor imaging. Int Psychogeriatrics. 2012;24(9):1483–1493. doi:10.1017/S1041610212000270
49. de Zeeuw P, Mandl RCW, Hulshoff Pol HE, van Engeland H, Durston S. Decreased frontostriatal microstructural organization in attention deficit/hyperactivity disorder. Hum Brain Mapp. 2012;33(8):1941–1951. doi:10.1002/hbm.21335
50. Gent TC, Bassetti CLA, Adamantidis AR. Sleep-wake control and the thalamus. Curr Opin Neurobiol. 2018;52:188–197. doi:10.1016/j.conb.2018.08.002
51. Stoffers D, Altena E, van der Werf YD, et al. The caudate: a key node in the neuronal network imbalance of insomnia? Brain. 2014;137(Pt 2):610–620. doi:10.1093/brain/awt329
52. Jones NF, Ikuta T. Sleep duration is associated with Caudate volume and executive function. Brain Imaging Behav. 2022;16(6):2601–2607. doi:10.1007/s11682-022-00715-9
53. Haber SN. The primate basal ganglia: parallel and integrative networks. J Chem Neuroanat. 2003;26(4):317–330. doi:10.1016/j.jchemneu.2003.10.003
54. Koo DL, Shin J-H, Lim J-S, Seong J-K, Joo EY. Changes in subcortical shape and cognitive function in patients with chronic insomnia. Sleep Med. 2017;35:23–26. doi:10.1016/j.sleep.2017.04.002
55. Wang R-F, Li Y-P, Zhang H-Y, et al. Sleep benefit in patients with Parkinson’s disease is associated with the dopamine transporter expression in putamen. Brain Res. 2023;1802:148173. doi:10.1016/j.brainres.2022.148173
56. Qiu M-H, Vetrivelan R, Fuller PM, Lu J. Basal ganglia control of sleep–wake behavior and cortical activation. Eur J Neurosci. 2010;31(3):499–507. doi:10.1111/j.1460-9568.2009.07062.x
57. Brady RO, Gonsalvez I, Lee I, et al. Cerebellar-Prefrontal Network Connectivity and Negative Symptoms in Schizophrenia. Am J Psychiatry. 2019;176(7):512–520. doi:10.1176/appi.ajp.2018.18040429
58. Cao H. Prefrontal-cerebellar dynamics during post-success and post-error cognitive controls in major psychiatric disorders. Psychol Med. 2022;1–8. doi:10.1017/S0033291722001829
59. Bosch OG, Rihm JS, Scheidegger M, et al. Sleep deprivation increases dorsal nexus connectivity to the dorsolateral prefrontal cortex in humans. Proce Nat Acad Sci. 2013;110(48):19597–19602. doi:10.1073/pnas.1317010110
60. Xu W, De Carvalho F, Clarke AK, Jackson A. Communication from the cerebellum to the neocortex during sleep spindles. Prog Neurobiol. 2021;199:101940. doi:10.1016/j.pneurobio.2020.101940
61. Popa D, Spolidoro M, Proville RD, Guyon N, Belliveau L, Léna C. Functional role of the cerebellum in gamma-band synchronization of the sensory and motor cortices. J Neurosci. 2013;33(15):6552–6556. doi:10.1523/JNEUROSCI.5521-12.2013
62. Canto CB, Onuki Y, Bruinsma B, van der Werf YD, De Zeeuw CI. The Sleeping Cerebellum. Trends Neurosci. 2017;40(5):309–323. doi:10.1016/j.tins.2017.03.001
63. Banks S, Dinges DF. Behavioral and Physiological Consequences of Sleep Restriction. J Clin Sleep Med. 2007;03(05):519–528. doi:10.5664/jcsm.26918
64. Zhu Y, Wang L, Xi Y, et al. White Matter Microstructural Properties are Related to Inter-Individual Differences in Cognitive Instability after Sleep Deprivation. Neuroscience. 2017;365:206–216. doi:10.1016/j.neuroscience.2017.09.047
 © 2023 The Author(s). This work is published and licensed by Dove Medical Press Limited. The full terms of this license are available at https://www.dovepress.com/terms.php and incorporate the Creative Commons Attribution - Non Commercial (unported, v3.0) License.
By accessing the work you hereby accept the Terms. Non-commercial uses of the work are permitted without any further permission from Dove Medical Press Limited, provided the work is properly attributed. For permission for commercial use of this work, please see paragraphs 4.2 and 5 of our Terms.
© 2023 The Author(s). This work is published and licensed by Dove Medical Press Limited. The full terms of this license are available at https://www.dovepress.com/terms.php and incorporate the Creative Commons Attribution - Non Commercial (unported, v3.0) License.
By accessing the work you hereby accept the Terms. Non-commercial uses of the work are permitted without any further permission from Dove Medical Press Limited, provided the work is properly attributed. For permission for commercial use of this work, please see paragraphs 4.2 and 5 of our Terms.