")
Back to Journals » Neuropsychiatric Disease and Treatment » Volume 11
Electroencephalography reveals lower regional blood perfusion and atrophy of the temporoparietal network associated with memory deficits and hippocampal volume reduction in mild cognitive impairment due to Alzheimer’s disease
Authors Vito Moretti D
Received 7 December 2014
Accepted for publication 15 January 2015
Published 23 February 2015 Volume 2015:11 Pages 461—470
DOI https://doi.org/10.2147/NDT.S78830
Checked for plagiarism Yes
Review by Single anonymous peer review
Peer reviewer comments 5
Editor who approved publication: Dr Roger Pinder
Davide Vito Moretti
National Institute for the research and cure of Alzheimer’s disease, S. John of God, Fatebenefratelli, Brescia, Italy
Background: An increased electroencephalographic (EEG) upper/lower alpha power ratio has been associated with less regional blood perfusion, atrophy of the temporoparietal region of the brain, and reduction of hippocampal volume in subjects affected by mild cognitive impairment due to Alzheimer’s disease as compared with subjects who do not develop the disease. Moreover, EEG theta frequency activity is quite different in these groups. This study investigated the correlation between biomarkers and memory performance.
Methods: EEG α3/α2 power ratio and cortical thickness were computed in 74 adult subjects with prodromal Alzheimer’s disease. Twenty of these subjects also underwent assessment of blood perfusion by single-photon emission computed tomography (SPECT). Pearson’s r was used to assess the correlation between cortical thinning, brain perfusion, and memory impairment.
Results: In the higher α3/α2 frequency power ratio group, greater cortical atrophy and lower regional perfusion in the temporoparietal cortex was correlated with an increase in EEG theta frequency. Memory impairment was more pronounced in the magnetic resonance imaging group and SPECT groups.
Conclusion: A high EEG upper/low alpha power ratio was associated with cortical thinning and less perfusion in the temporoparietal area. Moreover, atrophy and less regional perfusion were significantly correlated with memory impairment in subjects with prodromal Alzheimer’s disease. The EEG upper/lower alpha frequency power ratio could be useful for identifying individuals at risk for progression to Alzheimer’s dementia and may be of value in the clinical context.
Keywords: electroencephalography, perfusion, atrophy, temporoparietal network, memory deficits, hippocampal volume, mild cognitive impairment, Alzheimer’s disease
Introduction
Mild cognitive impairment (MCI) commonly represents an “at-risk” state for developing dementia. Therefore, there is a need to develop early biomarkers allowing identification of subjects who could develop Alzheimer’s disease (AD), early diagnosis, and potentially effective prevention therapies. The identification and validation of biomarkers for diagnosis, monitoring progression, and predicting the onset of AD have been a main focus of neurology research in the past 10 years. In line with recently published research criteria, it is becoming clear that integration of biomarkers is a cornerstone for correct and early diagnosis of AD.1,2 To date, the most studied and validated biomarkers are Abeta42 and tau protein in the cerebrospinal fluid, glucose hypometabolism on fluorodeoxyglucose positron emission tomography, atrophy of hippocampal volume on magnetic resonance imaging (MRI), and brain amyloid deposition on imaging with positron emission tomography.3,4 In the conceptual framework concerning integration of biomarkers for an early and highly predictive diagnosis, the electroencephalogram (EEG) could be a reliable tool.5–11 Indeed, it is widely accepted that EEG rhythms reflect underlying brain network activity.12–16 As a consequence, changes in EEG rhythms could be an early sign of AD. Recently, it has been demonstrated that an increase in high alpha power relative to low alpha power is a reliable EEG marker for atrophy of the hippocampus and amygdalohippocampal complex.17,18 Further, the increase in α3/α2 power ratio has been demonstrated to be predictive of conversion to AD in patients with MCI, but not in non-AD dementia.19 The same increase in the α3/α2 power ratio was found to be correlated with hippocampal atrophy in subjects with AD.20 Finally, a recent study showed that MCI subjects with the highest α3/α2 power ratio had a peculiar pattern of basal ganglia and thalamic atrophy detected by voxel-based morphometry when compared with MCI subjects with a middle or low α3/α2 power ratio.21 In contrast, subjects with a higher α3/α2 frequency power ratio showed a consistent trend of lower perfusion than subjects with a low α3/α2 frequency power ratio. The two groups were significantly different with regard to hippocampal volume and correlation with theta frequency activity.22
This study investigated the correlation between MRI and single-photon emission computed tomography (SPECT) values and memory impairment in subjects with MCI and a high α3/α2 frequency power ratio. The results showed that memory impairment was more pronounced in MCI subjects with a higher upper/lower alpha frequency power ratio in both the MRI and SPECT groups. Memory impairment was also correlated with greater cortical atrophy and less perfusion in the temporoparietal cortex.
Materials and methods
Subjects
Seventy-four subjects with MCI was recruited from the memory clinic at the Scientific Institute for Research and Care of Alzheimer’s and Psychiatric Diseases in Brescia, Italy. All experimental protocols were approved by the local ethics committee. Informed consent was obtained from all participants or their caregivers in accordance with the code of ethics laid down in the Declaration of Helsinki. Other data on the same subjects has been published previously by our group.
Diagnostic criteria
Patients were selected from a prospective study on the natural history of cognitive impairment being carried out in the National Institute for the Research and Care of Alzheimer’s Disease. Inclusion criteria for the study have been described elsewhere.23–33 The demographic and cognitive characteristics of the study population are summarized in Table 1. There were no statistically significant differences between the study groups with regard to age, sex, or education.
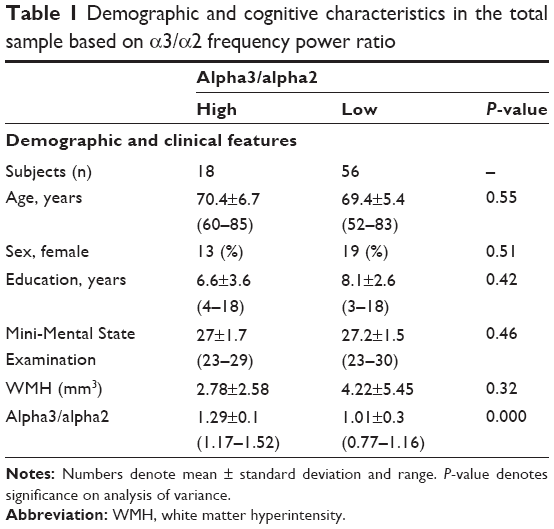 | Table 1 Demographic and cognitive characteristics in the total sample based on α3/α2 frequency power ratio |
EEG recordings
EEG activity was recorded continuously from 19 sites using electrodes set in an elastic cap (Electro-Cap International Inc, Eaton, OH, USA) and positioned according to the 10–20 international system (Fp1, Fp2, F7, F3, Fz, F4, F8, T3, C3, Cz, C4, T4, T5, P3, Pz, P4, T6, O1, and O2). The EEG procedure used has been described elsewhere.34–43
Analysis of individual frequency bands
Digital Fast Fourier Transform (FFT)-based power spectrum analysis (Welch technique, Hanning windowing function, no phase shift) was used to compute (range 2–45 Hz) the power density of EEG rhythms with a 0.5 Hz frequency resolution. Two anchor frequencies were selected according to the guidelines in the literature.16,19,44–50 The α3/α2 power ratio was computed in all subjects, and three groups were obtained according to increasing tertile values of α3/α2, ie, low (α3/α2 <1), middle (1< α3/α2 <1.16), and high (α3/α2 >1.17). Division into tertiles allowed a balanced distribution of the study sample with the advantage of avoiding extreme values in the statistical analysis. The three groups of MCI have been demonstrated in previous studies to be different.19–22
MRI scans
For each subject, a high-resolution sagittal T1-weighted volumetric MRI scan was acquired at the Neuroradiology Unit, Città di Brescia Hospital, Brescia, Italy, using a 1.0 T scanner (Gyroscan, Philips, Eindhoven, the Netherlands) with a gradient echo three-dimensional technique: repetition time 20 ms, echo time 5 ms, flip angle 30°, field of view 220 mm, acquisition matrix 256×256, and slice thickness 1.3 mm.
Estimation of cortical thickness
Cortical thickness in the 74 MCI patients was measured using FreeSurfer version 5.1.0, a fully automated MRI-based analysis technique comprising a set of software tools for the study of cortical and subcortical anatomy, as described elsewhere.50–59
Statistical analysis
Differences in sociodemographic and neuropsychological characteristics between the groups were tested for using Statistical Package for the Social Sciences version 13.0 software (SPSS Inc, Chicago, IL, USA). Analysis of variance was performed for continuous variables and the paired χ2 test for dichotomous variables. For continuous variables, post hoc pairwise comparisons between groups were performed using the Games–Howell or Bonferroni tests depending on homogeneity of variance, estimated with Levene’s test. The correlation analysis was computed with Spearman’s correlation coefficients.
SPECT scans
Twenty-seven patients and 17 controls underwent SPECT scanning in the nuclear medicine department at the Ospedali Riuniti Hospital, Bergamo, Italy, according a protocol described elsewhere.60
Statistical analysis
We investigated the significance of differences in sociodemographic, clinical, and cognitive characteristics between the two groups (MCI subjects at low risk or high risk of developing AD) using the χ2 test for categorical variables (sex and apolipoprotein E carrier status) and the Student’s independent t-test for continuous variables (volumetrics, perfusion features, and EEG frequencies). In all cases, we set the threshold for statistical significance at P<0.05. Spearman’s r correlations were assessed between the selected regions of interest for perfusion (in terms of age-corrected W scores) and the acquired EEG frequencies in both groups.
Results
MRI
Table 1 shows the sociodemographic and neuropsychological characteristics of the MCI subgroups defined according to α3/α2 ratio. Analysis of variance showed no statistically significant differences between the groups, which were well matched for age, sex, white matter hyperintensity (WMH) burden, level of education, and global cognitive level. Age, sex, education, global cognitive level (Mini-Mental State Examination score) and WMH burden were introduced as covariates in the subsequent analysis to avoid confounding factors. The post hoc pairwise comparisons between groups were performed using the Games-Howell test.
Pattern of cortical thickness
When compared with subjects who had a low α3/α2 ratio, patients with a high α3/α2 ratio showed bilateral thinning in the superotemporal, supramarginal, and precuneus cortex, as well as in the right inferior parietal and insula areas (Figure 1).
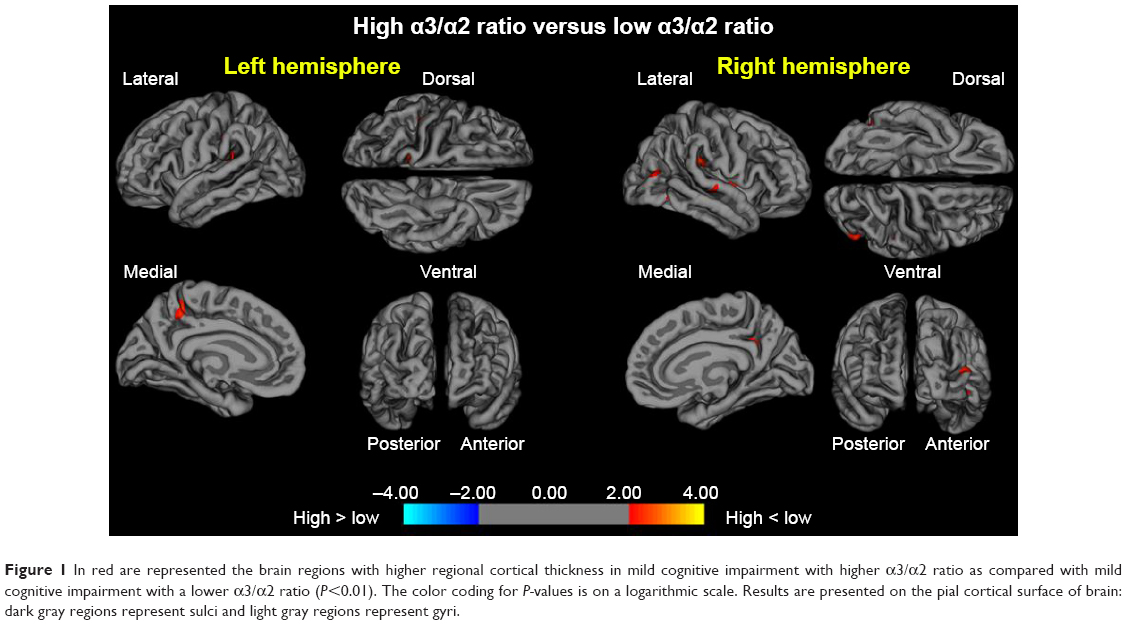 | Figure 1 In red are represented the brain regions with higher regional cortical thickness in mild cognitive impairment with higher α3/α2 ratio as compared with mild cognitive impairment with a lower α3/α2 ratio (P<0.01). The color coding for P-values is on a logarithmic scale. Results are presented on the pial cortical surface of brain: dark gray regions represent sulci and light gray regions represent gyri. |
Neuropsychological memory tests and cortical thickness
In the high α3/α2 group, a significant positive correlation was found between logical memory performance on the Babcock test and thickness values in the left caudal middle frontal area (cluster size 36 mm2, stereotaxic coordinates x, y, z =−34, 22, 47, respectively; r=0.70, P<0.001) and left inferior temporal area (15 mm2, −54, −28, −26; r=0.65, P<0.01), right rostral middle frontal area (28 mm2; 2, 56, −13; r=0.69, P<0.005). No significant correlation was found with the same regions nor in the other groups nor in the whole sample (Table 2).
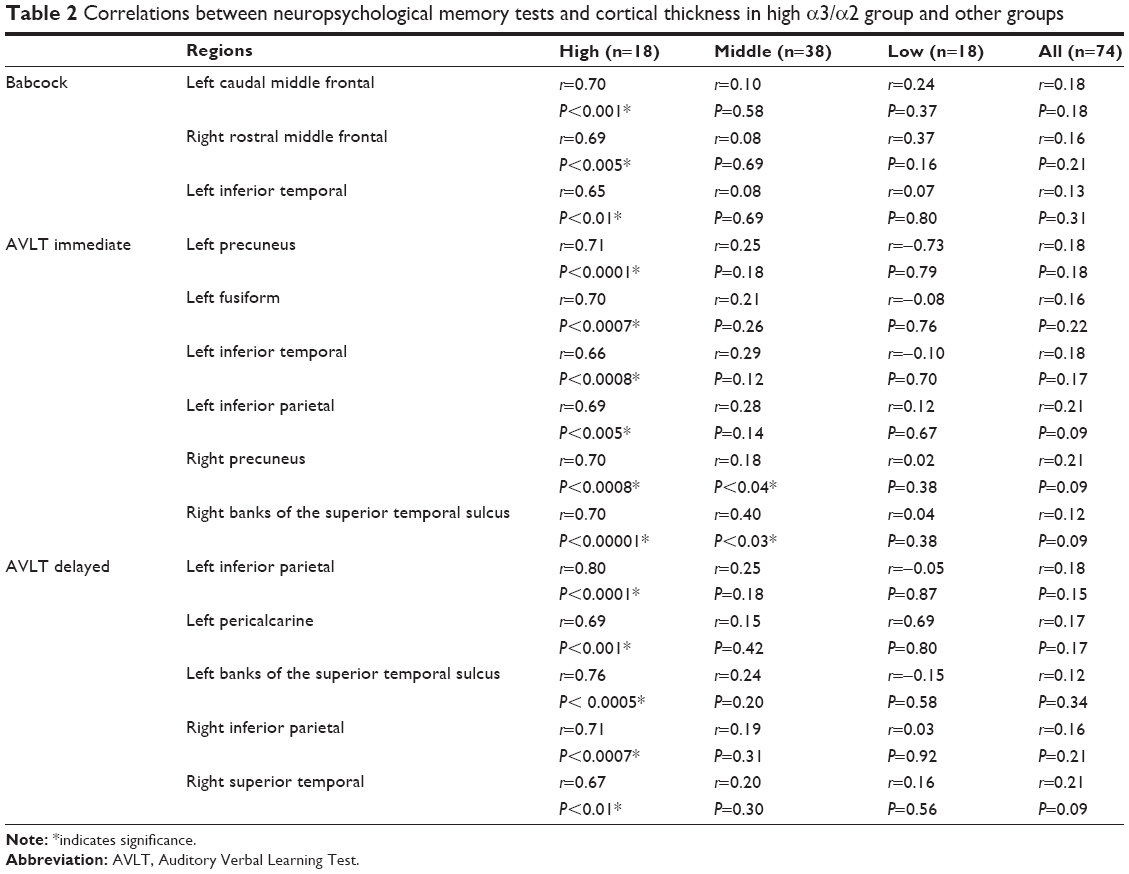 | Table 2 Correlations between neuropsychological memory tests and cortical thickness in high a3/a2 group and other groups |
In the high α3/α2 group, immediate recall on the Auditory Verbal Learning Test (AVLT) was significantly correlated with cortical thickness in the bilateral precuneus area (left 47 mm2, stereotaxic coordinates x, y, z =−21, −61, 20, respectively; r=0.71, P<0.0001; right 58 mm2, 20, −60, 25; r=0.70, P=0.0008), left fusiform area (40 mm2, −41, −25, −21; r=0.70, P<0.0007), left inferior parietal area (43 mm2, −46, −60, 11; r=0.69, P<0.005), left inferior temporal area (35 mm2, −53, −34, −21; r=0.66, P<0.0009), and right bank of the superior temporal sulcus (44 mm2, 48, −48, 9; r=0.79, P<0.0001). Memory performance was also correlated in the middle group with both the right precuneus area (r=0.18, P<0.04), and the right bank of the superior temporal sulcus (r=0.40, P=0.03). No significant associations was found either in the low group or in the entire sample.
In the high α3/α2 group, delayed recall on the AVLT was significantly correlated with cortical thickness in the bilateral inferior parietal area (left 95 mm2, stereotaxic coordinates x, y, z =−44, −58, 12, respectively; r=0.80, P<0.0001; right 49 mm2, 50, −50, 9; r=0.71, P<0.0007), left pericalcarine cortex (54 mm2, −7, −8, 11; r=0.69, P<0.001), left bank of the superior temporal sulcus (31 mm2, −51, −41, −5; r=0.76, P<0.0005), and in the right superior temporal area (22 mm2, 56, −34, 13; r=0.67, P<0.01). No significant correlation was found with the same regions nor in the other groups nor in the whole sample.
SPECT
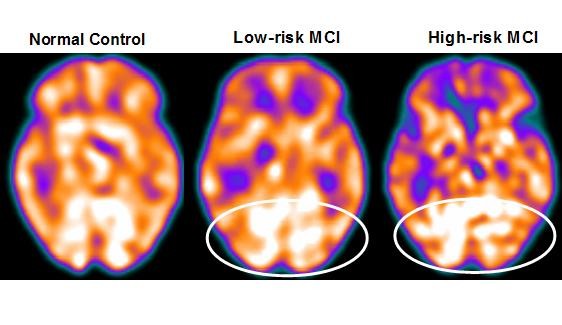
Twenty-seven MCI patients were enrolled in this study and were classified as at high risk (when the α3/α2 EEG rhythm median was above 1.17) or at low risk (when the median α3/α2 EEG rhythm was under 1.17) for developing AD. The two groups (high risk of AD, n=13; low risk of AD, n=14) were similar for age (P=0.56), years of education (P=0.87), sex (P=0.17), apolipoprotein E genotype (P=0.15), Mini-Mental State Examination scores (P=0.31), and white matter lesion load (P=0.88; Table 3). Figure 2 shows the visual rating scale of the SPECT scans representative of normal controls, subjects with MCI and a low risk of conversion to AD, and MCI subjects with a high risk of conversion to AD. Analysis of variance showed that the selected cutoff was effective in detecting the two different groups, ie, patients at high risk of developing AD had a significantly higher α3/α2 power ratio than patients at low risk (P=0.0001).
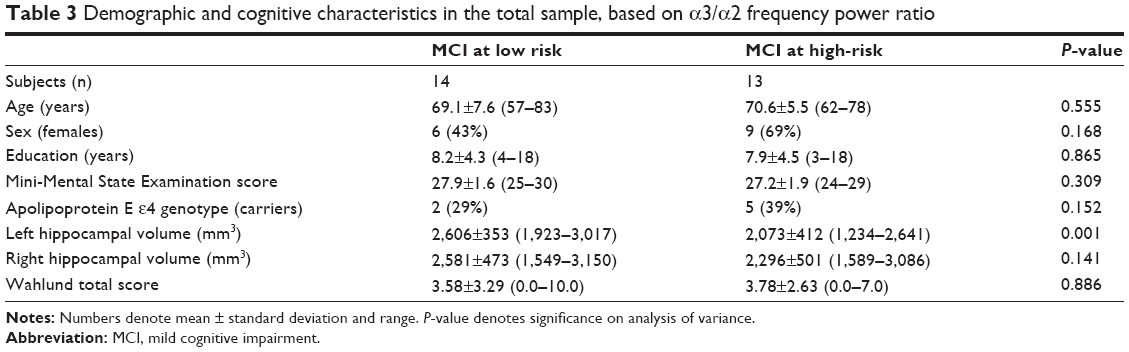 | Table 3 Demographic and cognitive characteristics in the total sample, based on α3/α2 frequency power ratio |
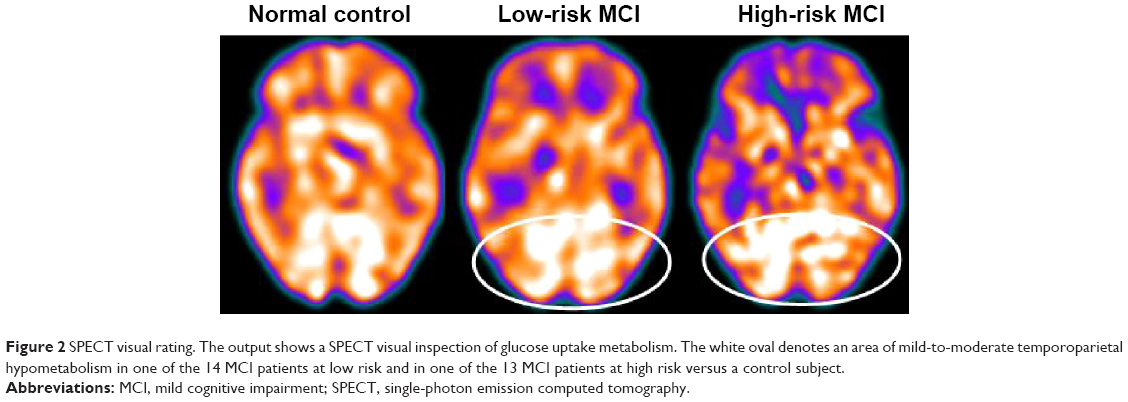 | Figure 2 SPECT visual rating. The output shows a SPECT visual inspection of glucose uptake metabolism. The white oval denotes an area of mild-to-moderate temporoparietal hypometabolism in one of the 14 MCI patients at low risk and in one of the 13 MCI patients at high risk versus a control subject. |
Pattern of cortical perfusion differences between groups
Although mean perfusion in all the selected regions of interest was similar between the groups (all P>0.38), the group with a high α3/α2 frequency ratio showed a consistent trend of lower perfusion. Moreover, left hippocampal volumes were lower in subjects at high risk of AD when compared with those at low risk (P=0.001).
In patients at low risk of developing AD, a significant Pearson’s r negative correlation was found between the perfusion in the region of interest, the hippocampal comolex volume and the theta rhythm (r=−0.544, P=0.044). In patients at high risk of developing AD, more and dissimilar correlations were found: a positive correlation, inverted respect to patients at low risk, between the perfusion in the region of interest, the hippocampal comolex volume and the theta rhythm (r=0.729, P=0.005).
Neuropsychological memory tests and regional brain perfusion
In the high α3/α2 group, a significant positive correlation was found between logical memory performance on the Babcock test and lower perfusion values in the bilateral precuneus (left, r=0.63, P<0.03; right, r=0.70, P<0.001) and superior temporal sulcus (r=0.72, P<0.006). Moreover, a positive correlation was found with hippocampal atrophy (r=0.75, P=0.001).
In the high α3/α2 group, immediate recall on the AVLT was significant correlated with lower perfusion values in the caudal bank of the right inferior temporal sulcus (r=0.71, P<0.001) and middle frontal gyrus (r=0.73, P<0.003). Further, memory function on the AVLT was significantly correlated with lower perfusion values in the left inferior parietal lobule, particularly in the supramarginal gyrus (r=0.80, P<0.0001, Table 4).
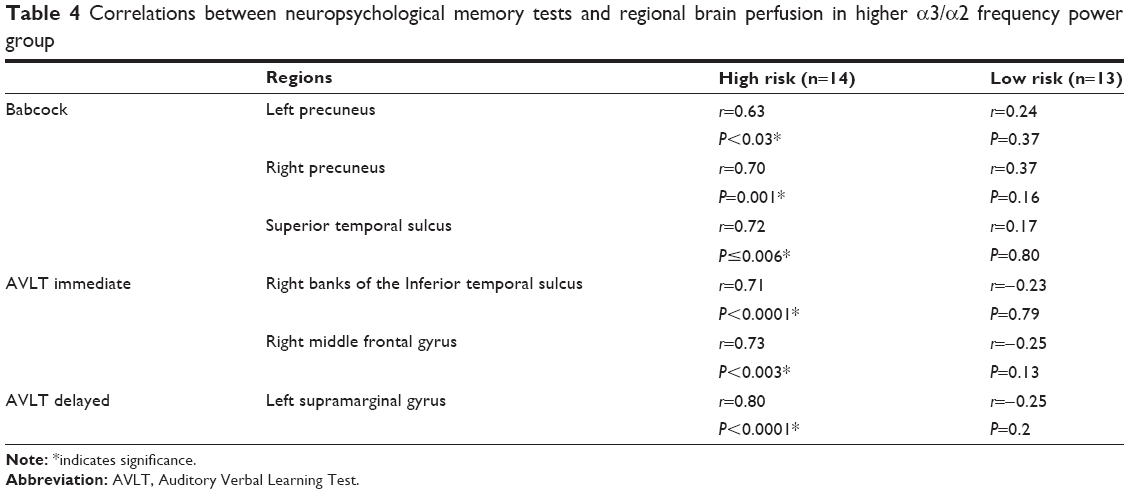 | Table 4 Correlations between neuropsychological memory tests and regional brain perfusion in higher α3/α2 frequency power group |
Discussion
The present study provides an overview of the correlation between structural and neurodegeneration biomarkers and brain rhythms associated with MCI due to AD.
Association between EEG markers and changes in gray matter
This study investigated the relationship between an EEG marker (the α3/α2 power ratio) and cortical thickness in subjects with MCI. The α3/α2 power ratio was chosen because previous work has demonstrated that MCI subjects with a higher α3/α2 ratio are at increased risk of developing AD.19–22 In the present study, the MCI group with a higher α3/α2 ratio had more global cortical atrophy than the other subgroups, thus confirming a large body of literature.6,19 Further, the greater extent of atrophy was significant in two specific brain areas, ie, the precuneus and the supramarginal gyrus (located in the inferior parietal lobule), in both the left and right hemispheres. These results were largely expected, considering previous studies. Indeed, structural and functional abnormalities of the precuneus were observed in subjects with MCI as well as in those with AD, so atrophy of the precuneus has been considered as pathognomonic of early AD.61–66 Recent studies suggest that specific regions, namely the precuneus and posterior cingulate gyrus, together with the medial temporal lobe, are particularly vulnerable to early amyloid deposition in AD pathology.67,68
Relationship between EEG markers and changes in perfusion
These results confirm previous studies showing that patients at high risk of developing AD have reduced perfusion on SPECT in the temporoparietal intersection and inferior parietal lobule,55,56 and also confirm the well-known correlation between reduced regional perfusion and hyppocampal atrophy.55 The present study shows a correlation between cerebral perfusion and theta rhythm, which emerges only when the different groups individuated by the a3/a2 frequency power ratio. This is confirmed by the lack of a correlation when the groups are merged. This result represents the principal issue of the study and the main novelty of this research.
The subjects at lower risk of developing AD, in whom there was a steady trend toward higher regional blood perfusion in the brain, maintained low levels of hippocampal theta power, while subjects at higher risk, with a basically lower cerebral blood perfusion, tended to show a higher theta rhythm. Theta rhythms are usually not appreciated in a normal awakening EEG. However, an increase in theta power is observed over the frontal and temporal areas during learning and memory tasks. Theta rhythms recorded during these tasks are thought to be produced by activation of the septal-hippocampal system. The hippocampus has cholinergic innervation originating from the basal forebrain, medial septum, and vertical limb of the diagonal band of Broca. Populations of GABAergic and glutamatergic neurons have also been described in several basal forebrain structures. The synchronized depolarization of hippocampal neurons produces field potentials that have a main frequency of 3–12Hz and is usually known as hippocampal theta rhythm.47,48 A cholinergic-glutamatergic hypothesis of AD has been advanced, whereby most symptoms may be explained by cholinergic-glutamatergic deficits. Neuronal injury/loss may include an excitotoxic component that possibly contributes to the early cholinergic deficit. This excitotoxic component may occur, at least in part, at the septal level where somas of cholinergic neurons are found. This insult may modify septal networks and contribute to the abnormal information processing observed in the AD brain, including its hyperexcitability states.
Neurophysiological and clinical implications
Recent studies have demonstrated that, during successful encoding of new items, there is a desynchronization in the temporoparietal memory-related networks whereas a synchronization prevent a successful semantic encoding.66,69 The deleterious role of synchronization has recently been demonstrated by an interesting study addressing the intriguing relationship between functional and structural degeneration in AD.67 The authors detected some hub (heteromodal associative) regions that are selectively vulnerable in AD pathology, caused by damage to inhibitory interneurons, providing a loss of inhibition at the cellular level.70–75 According to the authors, this disinhibition provokes an increasing amount of neural activity at the network level, ultimately resulting in a hypersynchronization of brain areas. Of note, this overactivity is excitotoxic and determines cellular apoptosis and brain atrophy. Palop and Mucke emphasize the role of dysfunctional inhibitory interneurons in hypersynchronization.54 Our results are in line with these previous influential studies. A possible integrative view of all the results could be as follows: the higher neuronal activity in the hub regions starts from dysfunctional cellular inhibition; the consequent disinhibition drives the neural network toward oversynchronization; this oversynchronization is specific to hub regions with a higher amyloid burden; these overactivated regions are prone to degeneration and atrophy; a possible neurophysiological sign of this oversynchronization is the higher α3/α2 power ratio we have found in typical hub regions.70–75 It is of great interest that there is overlap between the brain regions associated with an increased EEG α3/α2 power ratio (hypersynchronization of upper alpha) in our study and the regions associated with higher amyloid burden related to memory processes.70,71 Moreover, in the present study, there is a very interesting result. Atrophy of the precuneus is coupled with atrophy in the supramarginal gyrus and, to a lesser extent, with the inferior parietal lobule, insula, and superior temporal gyrus. This pattern of atrophy was clearly expressed in the MCI subjects with a higher α3/α2 power ratio. This finding fits well with the results of a recent study that investigated the functional connectivity of the human precuneus by resting state functional MRI.75 The authors of that study found that there is a preferential pathway for connectivity between the dorsal precuneus and the supramarginal gyrus, parietal cortex, superior temporal gyrus, and insula. As a consequence, the atrophy detected in the MCI group with a higher α3/α2 power ratio could be hypothesized to reflect loss of gray matter in an entire anatomofunctional network rather than atrophy of isolated brain areas. Of note, it is widely accepted that AD is the result of cortical network impairment more than atrophy of single cortical areas.75 In subjects with a low or middle α3/α2 power ratio, the cognitive impairment is possibly due to cerebrovascular impairment or a non-AD degenerative process. Although the rigid selection criteria adopted to include in the study patients with primary cognitive deficits, in the clinical practice is not infrequent to have MCI subjects not due to AD.
Memory performance
In order to exclude a random relationship between the EEG marker and cortical atrophy, the correlation between brain areas and performance on memory tests was investigated in all MCI subgroups. The memory tests were chosen because of their well-known greater impairment in MCI subjects who convert to AD.1,9 Our results showed no significant difference in memory performance between the groups. This could be a paradoxical outcome, but should not be considered too surprising, bearing in mind the globally mild and early impairment of the whole group of subjects. In other words, the groups are not different when considering memory performance alone. This is probably due to early and general MCI. Despite the lack of a significant difference in the memory test scores, when focusing on the relationship between memory performance and a reliable structural marker, such as cortical thickness, the MCI group with the higher α3/α2 power ratio showed a (negative) correlation between performance on memory tests and cortical thickness, as expected in patients likely to have prodromal AD. This result confirms the peculiar nature of this MCI group, and shows a clear specificity as regard to both cortical atrophy and the correlated memory performance. Moreover, no other sociodemographic or structural differences were observed in the MCI groups that could explain the results of the correlation analysis. Cortical areas associated with cortical thinning and those correlated with performance on memory tests are only partly overlapping. This could be due to the particular nature of the memory domain, underpinning a large number of brain areas. On the other hand, MCI subjects at higher risk of converting to AD may show impairment in other cognitive domains, such as visuospatial attention or in execution and preparation of spatially guided behavior.75 Of note, the cortical network encompassing the precuneus and inferior parietal cortex is deeply involved in visuospatial abilities.75 As a speculative interpretation, we could hypothesize that the memory deficits may be due to an impaired network underlying the semantic coding of the spatial features of episodic memory traces. In this view, the atrophy of a specific brain network (more than global volume measures) is more reliable in detecting MCI subjects with prodromal AD. However, discussion of memory-related brain networks is beyond the scope of the present study. Only a weak negative correlation was found in the group with a middle α3/α2 EEG power ratio, suggesting a possible degenerative type of memory impairment in this group. No significant associations were found in the low α3/α2 power ratio group or in the whole sample. Taken together, these results strengthen the view that MCI patients with a higher α3/α2 ratio are at increased risk for developing AD.75
Conclusion
In this study, a higher EEG upper/low alpha power ratio was associated with cortical thinning and decreased perfusion in the temporo-parietal brain areas. This atrophy and decreased perfusion were both significantly correlated with memory impairment in MCI subjects. The EEG upper/low alpha frequency power ratio could be useful for identifying MCI individuals at risk for progression to AD dementia and may be of value in the clinical context.
Disclosure
The author reports no conflicts of interest in this work.
References
Dubois B, Feldman HH, Jacova C, et al. Research criteria for the diagnosis of Alzheimer’s disease: revising the NINCDS-ADRDA criteria. Lancet Neurol. 2007;6:734–746. | ||
Albert MS, DeKosky ST, Dickson D, et al. The diagnosis of mild cognitive impairment due to Alzheimer’s disease: recommendations from the National Institute on Aging-Alzheimer’s Association workgroups on diagnostic guidelines for Alzheimer’s disease. Alzheimers Dement. 2011;7:270–279. | ||
Hampel H, Burger K, Teipel SJ, Bokde AL, Zetterberg H, Blennow K. Core candidate neurochemical and imaging biomarkers of Alzheimer’s disease. Alzheimers Dement. 2008;4:38–48. | ||
van Strien NM, Cappaert NL, Witter MP. The anatomy of memory: an interactive overview of the parahippocampal-hippocampal network. Nat Rev Neurosci. 2009;10:272–282. | ||
Missonnier P, Herrmann FR, Michon A, Fazio-Costa L, Gold G, Giannakopoulos P. Early disturbances of gamma band dynamics in mild cognitive impairment. J Neural Transm. 2010;117:489–498. | ||
Steriade M. Grouping of brain rhythms in corticothalamic systems. Neuroscience. 2006;137:1087–1106. | ||
Lopes da Silva FH, Vos JE, Mooibroek J, Van Rotterdam A. Relative contributions of intracortical and thalamo-cortical processes in the generation of alpha rhythms, revealed by partial coherence analysis. Electroencephalogr Clin Neurophysiol. 1980;50:449–456. | ||
Moretti DV, Babiloni F, Carducci F, et al. Computerized processing of EEG-EOG-EMG artifacts for multi-centric studies in EEG oscillations and event-related potentials. Int J Psychophysiol. 2003;47:199–216. | ||
Moretti DV, Babiloni C, Binetti G, et al. Individual analysis of EEG frequency and band power in mild Alzheimer’s disease. Clin Neurophysiol. 2004;115:299–308. | ||
Moretti DV, Miniussi C, Frisoni G, et al. Vascular damage and EEG markers in subjects with mild cognitive impairment. Clin Neurophysiol. 2007;118:1866–1876. | ||
Moretti DV, Miniussi C, Frisoni GB, et al. Hippocampal atrophy and EEG markers in subjects with mild cognitive impairment. Clin Neurophysiol. 2007;118:2716–2729. | ||
Moretti DV, Frisoni GB, Pievani M, et al. Cerebrovascular disease and hippocampal atrophy are differently linked to functional coupling of brain areas: an EEG coherence study in MCI subjects. J Alzheimers Dis. 2008;14:285–299. | ||
Moretti DV, Frisoni GB, Pievani M, et al. Brain vascular damage of cholinergic pathways and EEG markers in mild cognitive impairment. J Alzheimers Dis. 2008;15:357–372. | ||
Bakkour A, Morris JC, Dickerson BC. The cortical signature of prodromal AD: regional thinning predicts mild AD dementia. Neurology. 2009;72:1048–1055. | ||
Klimesch W, Doppelmayr M, Hanslmayr S. Upper alpha ERD and absolute power: their meaning for memory performance. Prog Brain Res. 2006;159:151–165. | ||
Folstein MF, Folstein SE, McHugh PR. ‘Mini mental state’. A practical method for grading the cognitive state of patients for the clinician. J Psychiatr Res. 1975;12:189–198. | ||
Hughes CP, Berg L, Danziger WL, Cohen LA, Martin RL. A new clinical rating scale for the staging of dementia. Br J Psychiatry. 1982;140:1225–1230. | ||
Rosen WG, Terry RD, Fuld PA, Katzman R, Peck A. Pathological verification of ischemic score in differentiation of dementias. Ann Neurol. 1980;7:486–488. | ||
Lawton MP, Brodie EM. Assessment of older people: self-maintaining and instrumental activity of daily living. J Gerontol. 1969;9:179–186. | ||
Lezak M, Howieson D, Loring DW. Neuropsychological Assessment. 4th ed. Oxford, UK: University Press; 2004. | ||
Radloff LS. The CES-D scale: A self-report depression scale for research in the general population. Appl Psychol Meas. 1977;1:385–401. | ||
Moretti DV, Babiloni F, Carducci F, et al. Computerized processing of EEG-EOG-EMG artifacts for multi-centric studies in EEG oscillations and event-related potentials. Int J Psychophysiol. 2003;47:199–216. | ||
Moretti DV, Fracassi C, Pievani M, et al. Increase of theta/gamma ratio is associated with memory impairment. Clin Neurophysiol. 2009;120:295–303. | ||
Moretti DV, Pievani M, Fracassi C, et al. Increase of theta/gamma and alpha3/alpha2 ratio is associated with amygdalo-hippocampal complex atrophy. J Alzheimers Dis. 2009;17:349–357. | ||
Moretti DV, Pievani M, Geroldi C, et al. Increasing of hippocampal atrophy and cerebrovascular damage is differently associated with functional cortical coupling in MCI patients. Alzheimer Dis Assoc Disord. 2009;23:323–332. | ||
Cabeza R. Hemispheric asymmetry reduction in older adults: the HAROLD model. Psychol Aging. 2002;17:85–100. | ||
Balsters JH, O’Connell RG, Galli A, et al. Changes in resting connectivity with age: a simultaneous electroencephalogram and functional magnetic resonance imaging investigation. Neurobiol Aging. 2013;34:2194–2207. | ||
Watson P, Conroy A, Moran G, Duncan S. Retrospective study of sensitivity and specificity of EEG in the elderly compared with younger age groups. Epilepsy Behav. 2012;25:408–411. | ||
Tenke CE, Kayser J, Miller L, et al. Neuronal generators of posterior EEG alpha reflect individual differences in prioritizing personal spirituality. Biol Psychol. 2013;94:426–432. | ||
Grandy TH, Werkle-Bergner M, Chicherio C, Schmiedek F, Lövdén M, Lindenberger U. Peak individual alpha frequency qualifies as a stable neurophysiological trait marker in healthy younger and older adults. Psychophysiology. 2013;50:570–582. | ||
Grandy TH, Werkle-Bergner M, Chicherio C, Lövdén M, Schmiedek F, Lindenberger U. Individual alpha peak frequency is related to latent factors of general cognitive abilities. Neuroimage. 2013;79:10–18. | ||
Bekhtereva V, Sander C, Forschack N, Olbrich S, Hegerl U, Müller MM. Effects of EEG-vigilance regulation patterns on early perceptual processes in human visual cortex. Clin Neurophysiol. 2014;125:98–107. | ||
Ségonne F, Dale AM, Busa E, et al. A hybrid approach to the skull stripping problem in MRI. Neuroimage. 2004;22:1060–10675. | ||
Fischl B, Dale AM. Measuring the thickness of the human cerebral cortex using magnetic resonance images. Proc Natl Acad Sci U S A. 2000;97:11044–11049. | ||
Han X, Jovicich J, Salat D, et al. Reliability of MRI-derived measurements of human cerebral cortical thickness: the effects of field strength, scanner upgrade and manufacturer. Neuroimage. 2006;32:180–194. | ||
Gronenschild EH, Habets P, Jacobs HI, et al. The effects of FreeSurfer version, workstation type, and Macintosh operating system version on anatomical volume and cortical thickness measurements. PLoS One. 2012;7:238–234. | ||
DeCarli C, Fletcher E, Ramey V, Harvey D, Jagust WJ. Anatomical mapping of white matter hyperintensities (WMH): exploring the relationships between periventricular WMH, deep WMH, and total WMH burden. Stroke. 2005;36:50–55. | ||
Pennanen C, Testa C, Laasko MP, et al. A voxel based morphometry study on mild cognitive impairment. J Neurol Neurosurg Psychiatry. 2005;76:11–1214. | ||
Markesbery WR, Schmitt RA, Kryscio RJ, Davis D, Smith C, Wekstein D. Neuropathologic substrate of mild cognitive impairment. Arch Neurol. 2006;63:38–46. | ||
McKhann GM, Knopman DS, Chertkow H, et al. The diagnosis of dementia due to Alzheimer’s disease: recommendations from the national institute on aging-Alzheimer’s association workgroups on diagnostic guidelines for Alzheimer’s disease. Alzheimers Dement. 2011;7:263–269. | ||
Sperling RA, Aisen PS, Beckett LA, et al. Toward defining the preclinical stages of Alzheimer’s disease: recommendations from the National Institute on Aging-Alzheimer’s Association workgroups on diagnostic guidelines for Alzheimer’s disease. Alzheimers Dement. 2011;7:280–292. | ||
Caroli A, Testa C, Geroldi C, et al. Brain perfusion correlates of medial temporal lobe atrophy and white matter hyperintensities in mild cognitive impairment. J Neurol. 2007;254:1000–1008. | ||
Matsuda H. The role of neuroimaging in mild cognitive impairment. Neuropathology. 2007;27:570–577. | ||
Petrella JR, Wang L, Krishnan S, et al. Cortical deactivation in mild cognitive impairment: high-field-strength functional MR imaging. Radiology. 2007;245:224–235. | ||
Pihlajamaki M, Jauhiainen AM, Soininen H. Structural and functional MRI in mild cognitive impairment. Curr Alzheimer Res. 2009;6:179–185. | ||
Dickerson BC, Sperling RA. Large-scale functional brain network abnormalities in Alzheimer’s disease: insights from functional neuroimaging. Behav Neurol. 2009;21:63–75. | ||
Ryu SY, Kwon MJ, Lee SB, et al. Measurement of precuneal and hippocampal volumes using magnetic resonance volumetry in Alzheimer’s disease. J Clin Neurol. 2010;6:196–203. | ||
Sperling RA, Dickerson BC, Pihlajamaki M, et al. Functional alterations in memory networks in early Alzheimer’s disease. Neuromolecular Med. 2010;12:27–43. | ||
de Haan W, Mott K, van Straaten EC, Scheltens P, Stam CJ. Activity dependent degeneration explains hub vulnerability in Alzheimer’s disease. PLoS Comput Biol. 2012;8:e1002582. | ||
Pievani M, de Haan W, Wu T, Seeley WW, Frisoni GB. Functional network disruption in the degenerative dementias. Lancet Neurol. 2011;10:829–843. | ||
Chatwal JP, Sperling RA. Functional MRI of mnemonic networks across the spectrum of normal aging, mild cognitive impairment, and Alzheimer’s disease. J Alzheimers Dis. 2012;31:S155–S167. | ||
Jones DT, Machulda MM, Vemuri P, et al. Age-related changes in the default mode network are more advanced in Alzheimer disease. Neurology. 2011;77:1524–1531. | ||
Brier MR, Thomas JB, Snyder AZ, et al. Loss of intranetwork and internetwork resting state functional connections with Alzheimer’s disease progression. J Neurosci. 2012;32:8890–8899. | ||
Palop JJ, Mucke L. Synaptic depression and aberrant excitatory network activity in Alzheimer’s disease: two faces of the same coin? Neuromolecular Med. 2010;12:48–55. | ||
Stam CJ, van der Made Y, Pijnenburg YA, Scheltens P. EEG synchronization in mild cognitive impairment and Alzheimer’s disease. Acta Neurol Scand. 2003;108:90–96. | ||
Bhattacharya BS, Coyle D, Maguire LP. Alpha and theta rhythm abnormality in Alzheimer’s disease: a study using a computational model. Adv Exp Med Biol. 2011;718:57–73. | ||
Rossini PM, Buscema M, Capriotti M, et al. Is it possible to automatically distinguish resting EEG data of normal elderly vs mild cognitive impairment subjects with high degree of accuracy? Clin Neurophysiol. 2008;119:1534–1545. | ||
Wu X, Li R, Fleisher AS, et al. Altered default mode network connectivity in Alzheimer’s disease – a resting functional MRI and Bayesian network study. Hum Brain Mapp. 2011;32:1868–1881. | ||
Wonderlick JS, Ziegler DA, Hosseini-Varnamkhasti P, et al. Reliability of MRI-derived cortical and subcortical morphometric measures: effects of pulse sequence, voxel geometry, and parallel imaging. Neuroimage. 2009;44:1324–1323. | ||
Zhang S, Li CS. Functional connectivity mapping of the human precuneus by resting state fMRI. Neuroimage. 2012;59:3548–3562. | ||
Morbelli S, Drzezga A, Perneczky R, et al. Resting metabolic connectivity in prodromal Alzheimer’s disease. A European Alzheimer Disease Consortium (EADC) project. Neurobiol Aging. 2012;33:2533–2550. | ||
Ghaem O, Mellet E, Crivello F, et al. Mental navigation along memorized routes activates the hippocampus, precuneus, and insula. Neuroreport. 1997;8:739–744. | ||
Leichnetz GR. Connections of the medial posterior parietal cortex (area 7 m) in the monkey. Anat Rec. 2001;263:215–236. | ||
Cavanna AE, Trimble MR. The precuneus: a review of its functional anatomy and behavioural correlates. Brain. 2006;129:564–583. | ||
Moretti DV, Pievani M, Geroldi C, et al. EEG markers discriminate among different subgroup of patients with mild cognitive impairment. Am J Alzheimers Dis Other Demen. 2010;25:58–73. | ||
Moretti DV, Frisoni GB, Fracassi C, et al. MCI patients’ EEGs show group differences between those who progress and those who do not progress to AD. Neurobiol Aging. 2011;32:563–571. | ||
Moretti DV, Frisoni GB, Binetti G, Zanetti O. Anatomical substrate and scalp EEG markers are correlated in subjects with cognitive impairment and Alzheimer’s disease. Front Psychiatry. 2011;1:152. | ||
Moretti DV, Prestia A, Fracassi C, et al. Volumetric differences in mapped hippocampal regions correlate with increase of high alpha rhythm in Alzheimer’s disease. Int J Alzheimers Dis. 2011;2011:208–218. | ||
Moretti DV, Paternicò D, Binetti G, Zanetti O, Frisoni GB. EEG markers are associated to gray matter changes in thalamus and basal ganglia in subjects with mild cognitive impairment. Neuroimage. 2012;60:489–496. | ||
Moretti DV, Prestia A, Fracassi C, Binetti G, Zanetti O, Frisoni GB. Specific EEG changes associated with atrophy of hippocampus in subjects with mild cognitive impairment and Alzheimer’s disease. Int J Alzheimers Dis. 2012;2012:253153. | ||
Moretti DV, Zanetti O, Binetti G, Frisoni GB. Quantitative EEG markers in mild cognitive impairment: degenerative versus vascular brain impairment. Int J Alzheimers Dis. 2012;2012:917537. | ||
Moretti DV, Paternicò D, Binetti G, Zanetti O, Frisoni GB. Analysis of grey matter in thalamus and basal ganglia based on EEG α3/α2 frequency ratio reveals specific changes in subjects with mild cognitive impairment. ASN Neuro. 2012;4:e00103. | ||
Moretti DV, Paternicò D, Binetti G, Zanetti O, Frisoni GB. EEG upper/low alpha frequency power ratio relates to temporo-parietal brain atrophy and memory performances in mild cognitive impairment. Front Aging Neurosci. 2013;5:63. | ||
Moretti DV, Prestia A, Binetti G, Zanetti O, Frisoni GB. Increase of theta frequency is associated with reduction in regional cerebral blood flow only in subjects with mild cognitive impairment with higher upper alpha/low alpha EEG frequency power ratio. Front Behav Neurosci. 2013;7:188. | ||
Moretti DV, Paternicò D, Binetti G, Zanetti O, Frisoni GB. Electroencephalographic upper/low alpha frequency power ratio relates to cortex thinning in mild cognitive impairment. Neurodegener Dis. 2014;14:18–30. |
 © 2015 The Author(s). This work is published and licensed by Dove Medical Press Limited. The full terms of this license are available at https://www.dovepress.com/terms.php and incorporate the Creative Commons Attribution - Non Commercial (unported, v3.0) License.
By accessing the work you hereby accept the Terms. Non-commercial uses of the work are permitted without any further permission from Dove Medical Press Limited, provided the work is properly attributed. For permission for commercial use of this work, please see paragraphs 4.2 and 5 of our Terms.
© 2015 The Author(s). This work is published and licensed by Dove Medical Press Limited. The full terms of this license are available at https://www.dovepress.com/terms.php and incorporate the Creative Commons Attribution - Non Commercial (unported, v3.0) License.
By accessing the work you hereby accept the Terms. Non-commercial uses of the work are permitted without any further permission from Dove Medical Press Limited, provided the work is properly attributed. For permission for commercial use of this work, please see paragraphs 4.2 and 5 of our Terms.