")
Back to Journals » International Journal of Nanomedicine » Volume 16
Design and Optimization of New Enteric Nanoparticles of Ceftriaxone for Oral Delivery: In vitro and in vivo Assessments
Authors Maghrabia A, Boughdady M , Meshali M
Received 12 May 2021
Accepted for publication 17 August 2021
Published 28 August 2021 Volume 2021:16 Pages 5937—5953
DOI https://doi.org/10.2147/IJN.S319176
Checked for plagiarism Yes
Review by Single anonymous peer review
Peer reviewer comments 3
Editor who approved publication: Dr Mian Wang
Amir Maghrabia,1 Mariza Boughdady,2 Mahasen Meshali2
1Department of Pharmacy, Urology and Nephrology Center, Mansoura University, Mansoura, 35516, Egypt; 2Department of Pharmaceutics, Faculty of Pharmacy, Mansoura University, Mansoura, 35516, Egypt
Correspondence: Amir Maghrabia
Department of Pharmacy, Urology and Nephrology Center, Mansoura University, Mansoura, 35516, Egypt
Tel +201007285809
Fax +20502247496
Email [email protected]
Purpose: Development of new strategies for oral delivery of existing antibiotics administered exclusively through intravenous route is one of the global priorities of pharmaceutical research. The encapsulation of these active pharmaceutical agents within nanosized natural products offers several traits due to their tunable surface properties. Ceftriaxone (CTX) is an injectable, third-generation cephalosporin that suffers poor oral bioavailability.
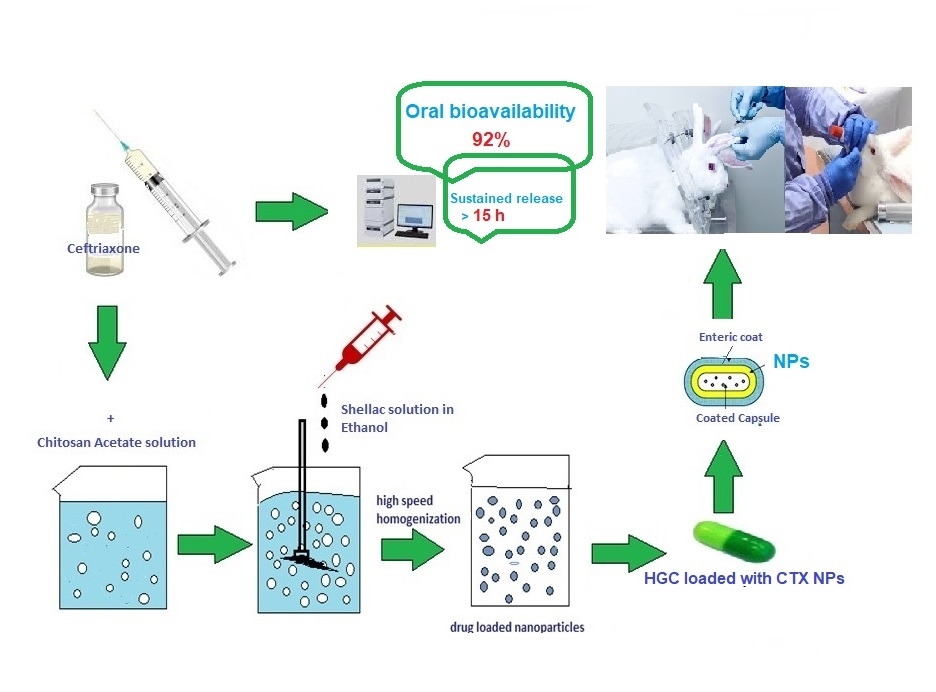
Methods: In the present study, ionic gelation of two biopolymers, namely chitosan (CH) and shellac (SH), was implemented to consolidate CTX, within elegant nanoparticles (NPs) for oral administration that would increase its bioavailability and sustainability. Quality by design approach (23 full factorial design) was adopted to optimize CTX-loaded nanoparticles. The optimized formula (F2) was characterized through transmission electron microscopy (TEM), Fourier transform infrared (FT-IR) spectroscopy and differential scanning calorimetry (DSC). In vitro release behavior and stability study were also evaluated. Pharmacokinetic studies of enteric-coated hard gelatin capsules (HGCs) loaded with F2-NPs were finally assessed.
Results: The optimized spherical F2-NPs had a mean particle size of 258 nm, zeta potential of about +30.1 and appreciable drug entrapment efficiency of 83%. The in vitro drug release profile of F2-NPs in pH 7.4 experienced biphasic configuration with an initial burst release for an hour, followed by a sustained release over 15 h with Higuchi model and non-Fickian diffusion mechanism (R2=0.9852). High stability upon storage at refrigerated and room temperature for 3 months and good flow properties (θ= 32.2 and HR= 1.13) of the optimized formula were also conferred. In vivo pharmacokinetic assessment in rabbits fruitfully displayed 92% absolute bioavailability of CTX.
Conclusion: The obtained results provide evidence for the potential combination of CH and SH in NPs preparation to enhance the oral bioavailability of CTX.
Keywords: ceftriaxone, chitosan, shellac, nanoparticles, oral, factorial design
Graphical Abstract:
Introduction
Ceftriaxone (CTX) is a widely used broad-spectrum cephalosporin that exhibits robust activity counter Gram-negative and Gram-positive bacteria. It belongs to class III biopharmaceutical classification system. It has a good safety record in neonates and good CNS penetration. CTX has much slower eviction than penicillin and other third-generation cephalosporins, so single daily dose is possible.1 Despite having these precious criteria, it is confined for injectable administration. This fact could be attributed to its gastric instability and lower permeability through GIT epithelia; both are the main bottlenecks that hinder its oral bioavailability.2 Oral drug delivery provides utmost patient satisfaction owing to self and painless administration. A very neoteric endeavor was recently published by the authors in which a new perspective enteric-coated tablet dosage form for oral administration of CTX was maneuvered.3 The promising results of this survey made the authors more eager to dedicate the present study with an epochal strategy that could accomplish the oral march of CTX with better bioavailability and sustained release.
Nanotechnology provides gold opportunities for antibiotics dosing and delivery. The unique structural and biological properties of the nanomedicine demonstrate numerous advantages for the encapsulated drugs over unencapsulated “free” ones. Their large specific surface area increases drug solubility, intestinal contact area and hence penetration and bioavailability. The encapsulated drug payloads are also protected from degradation in GIT by the nanoscale carrier. The tunable properties of the nanocarriers can be further modified to improve the release profiles of delivery, penetration, and thereby achieving higher cellular uptake, lower dose, less adverse reactions, less drug resistance, shorter treatment duration and lower cost.4,5 Furthermore, recent updates to engineer nanoparticles with desired physicochemical properties can be a new line of defense against bacterial resistance.6–8 NPs are considered to be an influential tool to combat antibiotic resistance. As well, they increase the effective concentration of the antibiotic within the bacterial cell, together with protection of the encapsulated antibiotic from bacterial enzymes.7
Drug encapsulation within biodegradable carriers can be advantageous to consolidate the stability and bioavailability of drugs altogether. Nanoparticles (NPs) made from natural biodegradable polymers are known for their small size, biodegradability, nontoxicity, and long shelf-life.9–11 These merits make them a point of interest for targeted drug delivery. An interesting mean to attain NPs is through ionic gelation.12 This process involves cross-linking between cationic macromolecules and polyvalent anions via electrostatic interaction. The polyelectrolyte complexes (NPs) would act as a carrier for the drug. Chitosan (CH) is the most commonly used natural cationic biopolymer. Its polycationic behavior is attributed to the primary amine group at the C-2 position of its glucosamine residues. This group manipulates the electrostatical interaction with polyanions when it becomes protonated at pH less than 6. Respectably, shellac (SH) is a natural animal-produced resin and wax blend which is used as a cement, or as a film-forming material or in enteric-coating.13 In alkaline solutions, SH carboxylic groups become deprotonated giving polyanions. Consequently, it could be used with CH for the formation of polyelectrolyte complexes.14 CH- NPs are claimed to be beneficial in IV/oral switch program of CTX due to their ability to enhance its cellular uptake which is impeded by its high molecular weight and hydrophilicity.15
Recent work has demonstrated that NPs can be used either alone or with other ligands to improve CTX absorption.16–18 Bali et al encapsulated CTX using blood serum albumin NPs.19 CTX conjugated gold NPs have also been reported.20 The use of lipid NPs as promising carriers to enhance the bactericidal effect of CTX was reviewed.16,21 Highly functionalized magnetic iron oxide NPs were reported to enhance CTX oral absorption as well.22 However, all these studies were based on the preparation of NPs and in vitro estimation of their effects without assessment of their biological effects (in vivo) compared to what is present in the market (injectable dosage form). Therefore, the ongoing study was warranted to encapsulate the poorly oral bioavailable CTX into NPs using two natural biopolymers (CH and SH), by a simple technique (ionic crosslinking) with a dual purpose of enhancing CTX absolute oral bioavailability, as well as increasing its efficacy and thus enhanced patient compliance. Moreover, the developed NPs also could be a perspective dosage form for peptides and proteins.23
Materials and Methods
Materials
Ceftriaxone Sodium (CTX) (lot NO. 25I50490/R151832) was purchased from Fresenius Kabi (Bad Homburg, Germany). Chitosan (CH) (CAS NO. 9012-76-4), was purchased from Sigma-Aldrich (Saint-Louis, MO, USA), characterized by low molecular weight (LMW) and degree of deacetylation >75%. Shellac (SH) (SSB 55 FL, batch NO.148310) was kindly obtained from Strover Schellack (Auf der Muggenburg, Bremen, Germany). Analytical grade of potassium phosphate monobasic (KH2PO4), disodium hydrogen phosphate (Na2HPO4), hydrochloric acid 33% (HCl), glacial acetic acid 99%, ortho-phosphoric acid 99% and absolute ethanol were obtained from El-Nasr Pharmaceutical Chemical Co, (Cairo, Egypt). HPLC grade ammonium acetate and methanol were purchased from Cornell Lab (Cairo, Egypt). Dexamethasone sodium phosphate® was purchased from Parchem (New Rochelle, New York). Hard gelatin capsules of size 4 were purchased from CapsuICN International co., Ltd (Zhejiang, China). Eudragit® L100-55 was kindly donated by RÖhm Pharma (Darmstadt, Germany). All materials were used as received from their sources without any further treatment.
Methods
Design of Experiment
A 23 full factorial design was followed to adequately define the relationship between critical process parameters (CPPs) and critical quality attributes (CQAs). For boosting the drug absolute bioavailability, vital CQAs comprising minimal particle size, minimal particle size distribution, maximal drug entrapment efficiency %, maximal yield %, and reasonable zeta potential are set in mind. Three critical process parameters (CPPs) namely: CH concentration (XA), SH concentration (XB) and CTX concentration (XC) were explored at two levels symbolized by the coded values as −1 (low levels) and +1 (high levels) as shown in Table 1.
 |
Table 1 23 Full Factorial Design Levels and Independent Variables |
Eight formulae, each with three runs, were prepared following the design and characterized for six CQAs namely; particle size (PS) (R1), poly dispersity index (PDI) (R2), zeta potential (ZP) (R3), % entrapment efficiency (%EE) (R4), % drug content (%DC) (R5), and % yield (R6).
The complete first order polynomial regression equation was initiated as follows:
Y=β0 +β1 XA +β2 XB +β3 XC +β4 XAXB+ β5 XAXC +β6 XBXC +β7XAXBXC
Where:
Y is the dependent variable (CQA).
XA, XB, XC are the independent variables (CPPs).
β0 represents the arithmetic mean response of the eight runs.
β1, β2, β3 correspond to the linear coefficients.
β4, β5, β6 correspond to the coefficients of interaction between the two CPP.
β7 corresponds to the coefficients of interaction between the three CPP.
After identifying the optimum level for each independent variable, an optimized formula was suggested. The optimized formula would be further characterized using TEM, FT-IR spectroscopy and DSC then evaluated for its flow properties, in vitro drug release, stability, and eventually oral pharmacokinetics in rabbits.
Preparation of Chitosan Acetate Solution
Chitosan acetate solution (0.4% w/v) was prepared by dissolving LMW-CH in 1% (v/v) acetic acid solution. The pH was adjusted to 5 with ammonium hydroxide solution (33%); then the solution was filtered through a 0.45 µm Millipore filter and stored at 4°C until use. Finally, chitosan acetate solution was diluted with deionized water to the final desired concentrations (0.1% and 0.2% w/v).
Preparation of Shellac Solution
Shellac solution was prepared by dissolving 100 mg of SH in 25 mL absolute ethanol. Ammonium hydroxide solution (33%) was used to adjust the pH to 5 and enhance SH solubility. The solution was stirred overnight; then SH solution was filtered through a 0.45 μm Millipore filter and diluted with absolute ethanol to the final desired concentrations (0.1% and 0.2% w/v).
Preparation of CTX- Loaded NPs
CTX-loaded NPs were assembled by ionic cross-linking among the cationic CH molecules and the anionic ones of SH.24 Briefly, a specified weight of CTX (50 mg or 100 mg) was dispersed in 25 mL of (0.1% or 0.2% w/v) chitosan acetate solution using an ultrasonic bath (Sonix SS101H230, USA) for 5 min until a uniform dispersion was obtained. The NPs were formed by adding 25 mL of SH solution (0.1% or 0.2% w/v) drop-wise using a 28G disposable syringe under magnetic stirring at room temperature. The falling distance was adjusted at 5 cm from the CH-CTX suspension surface. The resulting dispersion was further stirred for 30 min to allow homogenous gelation and complete formation of the NPs. The NPs were then separated from the dispersion using a high-speed cooling centrifuge (Sigma 1-14k, Germany) at 15,000 rpm and 4°C for 30 min. The supernatant from the centrifugation was decanted and saved for determination of % EE.
The obtained sediment was resuspended in deionized water and dried in a vacuum freeze drier (SIM FD8-8T, SIM international, USA) at −50°C for 18 h. Ultimately, the freeze-dried NPs were stored for further evaluation at room temperature. Five mL of chitosan acetate solution (0.1% or 0.2%) without CTX and 5 mL SH solution (0.1% or 0.2%) were used to prepare plain NPs corresponding to each formula.
Characterization of the Prepared NPs
Particle Size (PS) and Polydispersity Index (PDI)
PS and PDI of the prepared NPs were determined using Laser particle size analyzer (CILAS 1064L, USA) after proper dilution (1mL of the formed dispersion was diluted to 10mL with deionized water).25
Zeta Potential (ZP)
ZP measurements were performed on the freshly prepared samples from each formula via photon correlation spectroscopy instrument (Malvern Instruments Limited, UK) at 25°C.26
Entrapment Efficiency (%EE)
%EE of CTX loaded NPs was indirectly determined by measuring the amount of un-entrapped drug in the clear supernatant after centrifugation.27 The obtained supernatant was filtered through a 0.45 µm Millipore filter and the absorbance of this clear supernatant was measured using UV/VIS spectrophotometer (Jasco, Japan) after suitable dilution with phosphate buffer (PB) of pH 7.4 at λmax (241 nm). The supernatant obtained from plain NPs was used as blank. The %EE was then determined using the following equation:

Drug Content (%DC)
Actual %DC was determined by dissolving 10 mg of dry NPs from each formula in 10 mL of PB pH 7.4 using a vortex mixer (Model VM-300, Taiwan, Gemmy Industrial Corp.), and stirring for 2h. The obtained dispersion was then filtered to remove undissolved material, if any, and 0.1mL of the solution was further diluted with 10 mL PB pH 7.4 and measured spectrophotometrically at 241 nm. Plain NPs, treated in the same manner, were employed as a blank. No absorbance interference was detected from CH at this wavelength.28
%Yield
%yield was calculated as the total weight of dry NPs prepared with respect to the summation of weights of starting materials (drug and polymer) as follows:29

Where, Wm and Wt represent the weight of prepared dry NPs and the summation of weights of all solid components used in preparation, respectively.
Characterization and Evaluation of the Optimized Formula
Transmission Electron Microscopy (TEM)
Morphological examination of the optimum formula (F2-NPs) was implemented using JEOL TEM (100 CX, Japan). One milliliter of the prepared NPs suspension was tenfold diluted with ultrapure water and sonicated using an ultrasonic bath for 5 min. One drop of the obtained diluted sample was dripped onto a Formvar-coated copper grid (200 mesh, Science Services, Munich, Germany). With the aid of filter paper, the surplus material was discarded leaving a thin film stretched over the holes. After complete drying at room temperature, analysis and image capture were performed using digital micrograph and soft imaging.19
Fourier Transform Infrared Spectroscopy (FT-IR)
FT-IR studies of CTX, CH, SH and their physical mixture at a ratio representing the optimized formula (F2), and dried F2-NPs were done by using Mattson 5000 FT-IR spectrophotometer. Potassium bromide discs were prepared by using hydrostatic press. The scanning range was from 400 to 4000 cm−1. Each sample was pulverized, blended with potassium bromide, and compressed for the measurement.14
Differential Scanning Calorimetry (DSC)
DSC of CTX, CH, SH, their physical mixture at a ratio representing the optimized formula (F2), beside the dried F2-NPs was performed using Perkin-Elmer Differential Scanning Calorimeter (Perkin-Elmer 4, USA). It was calibrated with indium (99.99% purity, melting point 156.6°C). Eight milligrams of each sample were crimped in standard aluminum pans and heated from 30°C to 350°C at a heating rate of 10°C/min under constant purging of dry nitrogen at 30 mL/min. An empty pan, sealed in the same way as the sample, was used as a reference.3
Flow Properties
The flow properties are critical for efficient mixing and capsule filling operation. The flow property measurements including bulk density, tapped density, angle of repose and Hausner’s ratio for the dried F2-NPs were assessed.30
Angle of Repose 
To determine the frictional force that occurs in the powder of the NPs, the angle of repose of F2-NPs was measured using the funnel method, and it was calculated using the following equation:31

Where,  is the angle of repose, h represents the height of the cone of powder in cm and r represents the diameter of the powder cone in cm.
Hausner’s Ratio (HR)
Hausner’s ratio was determined by placing 4 gm of F2-NPs in a cylinder of 10 mL volume capacity. The bulk volume (Vo) and the tapped volume (Vf) were recorded initially and after 40 tapings, respectively. The bulk density (BD), tapped density (TD), and HR were calculated by taking the average of three determinations using the following equations:32


Stability Study
The effect of temperature and humidity on F2-NPs was evaluated for 3 months under different storage conditions. NPs were filled into amber glass bottles with air-tight closures of a plastic cap; then, they were stored at refrigerated temperature (5°C ± 3°C) and room temperature (25°C ± 2°C/40% ± 5% RH). To achieve conditions of accelerated stability study, other airtight bottles with F2-NPs were placed in a desiccator containing a saturated solution of sodium chloride to provide RH of 75 ± 5% and stored in a thermostatically controlled hot air oven (Heraeus Gs, Model B 5042, Germany) at 40 ± 2°C for the same period. The NPs were evaluated initially and at specified time intervals (1, 2 and 3 months) for physical appearance, PS, PDI, ZP and % DC.33
In vitro Drug Release from the Optimized Formula
The in vitro release studies of the pure drug (control) as well as the freshly prepared NPs of the optimum formula (F2) were evaluated by a dialysis method using the modified Franz diffusion cells (3 cm in diameter) for 16 h. The cells were placed in a shaking incubator (GFL Gesellschaft für Labortechnik, Burgwedel, Germany) maintained at 37 ± 0.5°C/ 100 rpm during the entire experiment. The release media were either phosphate buffers (PB) with pH values of 6.8 or 7.4. A semipermeable cellulose membrane (MW cut-off of 12,000–14,000 Daltons) was equilibrated with the release medium for 12 h and then attached firmly between the donor and receptor compartments. Pure CTX (20 mg) or equivalent of F2-NPs were dissolved or suspended in 1 mL of distilled water separately and introduced to the donor compartment. The receptor compartments were 50 mL of PB of pH values 6.8 or 7.4. At consecutive time intervals of 2 hours, 5 mL samples were withdrawn from receptor compartment, filtered through Millipore filter (0.45 μm) then analyzed spectrophotometrically for drug content at 241 nm. In order to maintain sink condition throughout the experiment, equal volumes of fresh media were used to replenish the samples. Each experiment was done in triplicate. Plain NPs were used as blanks.17
Kinetic Analysis of the Drug Release Data
In vitro release data were analyzed using linear regression equations of zero-order, first-order diffusion-controlled release mechanism,34 Higuchi’s model,35 and Korsmeyer–Peppas kinetic model to determine the kinetics and the mechanism of the drug release.36 The highest coefficient of determination (R2) model was deemed to depict the drug release mechanism.
Oral Absolute Bioavailability and Pharmacokinetic Studies
To investigate the pharmacokinetics of the optimized formula, F2- NPs were loaded in an enteric-coated hard gelatin capsule. This enteric-coated dosage form would facilitate NPs administration and protect CTX from the hostile environment of the stomach as well.
Preparation of CTX Enteric-Coated Hard Gelatin Capsules Loaded with the Optimized Nanoparticles
Hard gelatin capsules (HGCs) (size 4) were manually filled with the optimized freeze-dried NPs equivalent to 50 mg of CTX.
To confer gastro-resistance, the previously prepared capsules were subjected to a film-coating process by immersing them individually in 10% w/v ethanolic solution of Eudragit® L100-55 for 5 min; then the capsules were air-dried. The process was repeated five times.37 To assess the efficiency of the coating, a disintegration test was carried out at 37 ± 2°C as subsequently described.
Testing of Enteric-Coating Efficiency (Disintegration Test)
Briefly, each coated capsule (n = 6) was individually placed in the basket of a Six cell Disintegration Test Apparatus (Erweka Apparatebau, ZT3, West-Germany); the disintegration medium (1000 mL) was added and the basket-rack was subjected to vertical movements 30 cycle/min. The test was performed in 0.1N HCl solution for 2 h followed by immersion in PB (pH 6.8) for an additional 1 h at 37 ± 2°C. The integrity of each capsule was visually examined and the time for complete disintegration of the capsule was recorded.38
Experimental Animal Protocol
Male New Zealand rabbits (≈1.8 kg) were used in this study in accordance with the ethical principles of the Scientific Committee of Faculty of Pharmacy, Mansoura University, Egypt. Mansoura University Research Ethical Committee approved the protocol of animal use in agreement with “Principles of Laboratory Animal Care” (NIH publication No. 85–23, revised 1985). A group of six rabbits were fasted with free access to water one night before the experiment. This group was given enteric-coated HGCs loaded with F2-NPs orally via gastric intubation. All rabbits were dosed with CTX equivalent to 50 mg/kg. Rabbits were held in rabbit restrainers during blood sampling.
Sample Handling, HPLC Analysis of CTX in Rabbit Plasma, Chromatographic Conditions, Construction of Calibration Curve, Validation Method and Sample Processing
The above procedures were the same as those published in the authors’ previous work.3
Pharmacokinetic Data Analysis
After oral administration of the enteric-coated HGCs loaded with F2-NPs to male New Zealand rabbits, a noncompartmental model was applied to assess the concentration-time profile curve of CTX. The peak plasma concentration (Cmax) and its occurrence time (Tmax) were directly obtained from the concentration-time profile. The oral absolute bioavailability (F) was calculated from the relationship = (oral AUC0–∞/IV AUC0–∞), where IV AUC0–∞ is for intravenously administered CTX.3 The mean residence time (MRT) was calculated as the ratio of area under the first moment curve (AUMC0–∞) to (AUC0–∞) where the mean absorption time (MAT) was the difference between oral MRT and that after IV one.3 Kabs is the first-order absorption rate constant, and it was calculated as 1/MAT; while the absorption half-life (T1/2abs) was calculated as 0.693/Kabs. The obtained results were statistically compared with those of the previously prepared CTX tablets.3
Statistical Analysis
Data in Table 2 were expressed as mean ± standard deviation (SD) of three determinations (n=3). The statistical significance of the model was assessed through ANOVA via Design-Expert software (Design-Expert 12, State-Ease Inc., Minneapolis, USA). Statistically significant F-value (p < 0.05) and adjusted determination coefficients (adjusted R2= 0.8–1.0) were the criteria for validation of the model chosen. The effect of CPP on the CQA was also presented as response surface plots and contour plots generated by fixing the XC factor at its high and low levels and varying XA and XB over the range used in the study.
 |
Table 2 Formulations and CQAs Values of CTX-Loaded NPs as Claimed by 23 Full Factorial Design |
The in vitro release data were represented in terms of mean ± standard error (SE) and analyzed using analysis of variance (ANOVA) followed by Tukey–Kramer multiple comparisons test while the in vivo pharmacokinetic parameters ones were expressed as mean ± standard error of the mean (SEM) and statistically analyzed using unpaired Student’s t-test. The analysis process was employed using a computer program (GraphPad Prism 5 Software Inc., San Diego, CA, version 5.03).
Results and Discussions
Characterization of the Prepared NPs
The results of CQAs for various formulations have been detailed in Table 2. The effect of each CPP on PS, PDI, and ZP, % EE, % DC and % yield was quantified through the polynomial coded equations. The positive value before a factor indicates that the response increases with this factor and vice versa for a negative value.39
Particle Size (PS) and Polydispersity Index (PDI)
PS analysis, as well as PDI are two crucial factors that influence the drug release, absolute bioavailability and hence the drug’s pharmacodynamics. The mean PS of the prepared NPs was ranged from 258.77 ± 0.57 nm to 1465.33 ± 42.72 nm. The obtained polynomial equations representing these CQAs are:
PS= 742.77–181.66A - 38B + 192.41C + 94.72AB −22.14AC −134.47BC + 59.13ABC
F=295.48, P < 0.0001, and adjusted R2 = 0.9890
PDI= 0.50–0.18A + 0.04B + 0.05C + 0.08AB - 0.03AC - 0.05BC- 0.01ABC
F=137.06, P < 0.0001, and adjusted R2 = 0.9764
Careful screening of the equation of PS discloses that both CH and CTX concentrations dictate the outcome results. Contrary to each other, the most potent effects are for CH and CTX (−181.66 and + 192.41, respectively). The interaction between both however, has a low negative coefficient on PS (−22.14). Table 2 depicts the lowest and highest PS at 258.77 ± 0.57 and 1465.33 ± 42.72 nm for F2 and F5, respectively. Interestingly, CH in F2 is at its highest concentration while that of CTX is at its lowest one. The reverse is true for F5. Meanwhile, SH concentration is at its lowest level in both formulae. The results of PS may be explained by the fact that a low concentration of CH with low viscosity facilitates rapid movement and coalescence of the polymer molecules.40 High crosslinking prevails with the results of high PS. Intuitively, F2 with high CH concentration and low CTX one is the formula with lowest PS and PDI. Both SH and CTX concentrations (XB and XC) have a positive effect on the PDI value; while CH concentration (XA) has a negative one. The PDI values of all NPs were in the range of 0.1–0.8; It is worthy to note that the lower the value of PDI in a design, the more uniform the particle size distribution.41
Zeta Potential (ZP)
ZP is one of the essential parameters for the characterization of the NPs’ system stability. It measures the surface charge of the particle, based on their electrophoretic mobility. It indicates the degree of repulsion between similarly charged particles in the dispersion precluding particles’ aggregation. ZP can either be negative or positive in polarity, relying on the particle’s chemistry and the repulsion degree of similarly charged ones in the dispersion medium; as the electrostatic repulsion between the particles increases the stability increases. The reduction in the zeta potential causes the NPs to come closer until they become aggregated. NPs are considered highly stable in the dispersion medium when they have ZP lesser or higher than −30 mV and +30 mV respectively.26 The polynomial equation describing the regression model of ZP is as follows:
ZP= 18.4275 + 5.48A −3.31B −2.89C + 0.98AB −0.53AC + 1.197BC-0.75ABC
F = 96.3, p < 0.0001, and adjusted R2 = 0.9667.
All the prepared formulae have a consistently positive ZP in the range of (8.23 ± 0.85 mv to 30.1 ± 1.57mv) (Table 2). The unoccupied amine groups of CH molecules were the main reason for these positive charges.42 The higher the positive charge, the more repulsive force is generated allowing singular NPs to be formed.43 The polynomial equation reveals that only CH concentration (XA) has a positive coefficient towards ZP, while both SH and CTX concentrations (XB and XC) exhibit negative ones at relatively low numerical values.
Table 2 shows that F2, with the highest concentration of CH and the lowest ones of both SH and CTX, experienced the highest ZP value (30.1 ±1.57 mv). This may be due to the increase in the positive charge from the amine groups of CH.44 Contrarily, the increase in the negative charge of SH resulted in reduction of ZP (F7).
Percentage Entrapment Efficiency (%EE), Drug Content (%DC), and Percentage Yield (%yield)
These three CQAs are considered as convenient “red flag” to appraise the effectiveness, as well as reproducibility of the processing technique.
The obtained polynomial equations for these three CQAs are as follows:
● % EE= 56.62 + 11.70A −4.87B-9.62C + 0.37AB −0.87AC-1.12BC + 0.79ABC
F= 104.4, P < 0.0001, adjusted R2 =0.9692% ● DC= 46.29 + 12.29A −3.62B −7.62C + 2.20AB + 0.54AC −1.04BC + 0.62ABC
F= 71.13, P < 0.0001, adjusted R2 =0.9552
● %yield = 39.13 + 4.61A −2.97B −11.55C −0.77AB −4.52AC + 1.72BC-0.63ABC
F= 153.25, P < 0.0001, adjusted R2 =0.9669
Careful examination of these equations discloses that only the concentration of CH (XA) has positive effect toward the three CQAs, while the other CPP (SH and CTX concentrations) have negative impacts. From the equations, it can be also observed that the interaction of both terms CH and SH (AB) demonstrates a positive effect in case of %EE, and %DC. This can be explained by the fact that both CH and SH provide void spaces for CTX to be entrapped.45 Furthermore, both contour plots (Figure 1) and 3D surface plots (Figure 2) reveal that high levels of CH, with low levels of SH and CTX (in the range used) are desired to produce NPs with low PS and high %EE (F2). Compared to the previous studies; it was deduced that, in spite of the smaller PS of the NPs prepared by Gad-Elrab et al and kawish et al, the optimized formula (F2) has revealed superior %EE (83%) and ZP (+30.1).20,22
 |
Figure 1 Contour plots elucidating the effect of the independent variables (CH concentration (XA) and SH concentration (XB)) on PS (A and B) and % EE (C and D) at the minimum and maximum levels of CTX concentration (XC), respectively. |
 |
Figure 2 Three dimensional surface plots elucidating the effect of the independent variables (CH concentration (XA) and SH concentration (XB)) on PS (A and B) and % EE (C and D) at the minimum and maximum levels of CTX concentration (XC), respectively. |
Characterization and Evaluation of the Optimized Formula
Transmission Electron Microscopy (TEM)
Figure 3 discloses that F2-NPs have a smooth surface and nearly spherical shape, encapsulating drug crystals with irregular shape and size. This confirmed the formation of NPs loaded with CTX through ionic gelation between positively charged CH and negatively charged SH. Here, CTX was entrapped within the polyelectrolyte complex of CH and SH; whereas it was conjugated at the surface in case of magnetic iron oxide NPs.22
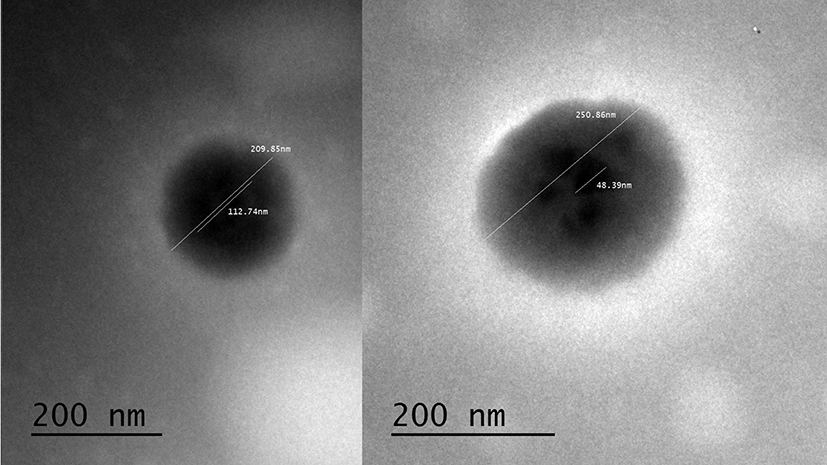 |
Figure 3 TEM image of F2- NPs (see Table 1 for F2 composition). |
Fourier Transform Infrared Spectroscopy (FT-IR)
FT-IR has been used to study the possibility of interaction that may occur between CTX, CH and SH. The FT-IR spectra of CTX, CH, SH, each alone, their physical mixture at a ratio representing the optimized formula (F2), as well as F2-NPs are shown in Figure 4A–E, respectively. The IR spectrum of plain CTX shows characteristic bands at 3426 cm−1 due to the amide group (H-bond stretching), 1742 cm−1 due to β-lactam C=O vibrations and 1607 cm−1 due to oxime C=N stretching vibrations (Figure 4A). The overlapped amide and ester (C=O) bands appear at 1649 cm−1.46 CH spectrum shows two bands at 1650 cm−1 and 1560 cm−1 due to carbonyl stretching vibration of the secondary and primary amide groups, respectively (Figure 4B).47 A strong band exists in the region 3423 cm−1, corresponding to N-H and O-H stretching, as well as the intramolecular hydrogen bonds.48 Figure 4C shows a very characteristic band of SH at 3450 cm– 1 due to O-H stretching and at 1718 cm–1 due to C=O stretch (ketone).13 The bands at 1549 and 1378 cm−1 were also assigned to the carboxylate group of SH.14 A distinct band at 1254 cm−1 associated with the carbonyl stretching could also be observed.49
 |
Figure 4 FT-IR spectra of (A) CTX, (B) CH, (C) SH, (D) physical mixture of CH: SH: CTX (2:1:2) and (E) F2-NPs. |
Both spectra of the physical mixture and F2-NPs show broad band at 3000–3600 cm−1 indicating the overlap of OH and NH stretching in the same region (Figure 4D and E respectively).50 In this zone, CH and the physical mixture show the same bands; while that of F2-NPs were broader, indicating hydrogen bond formation.51 As shown in the spectrum of F2-NPs, SH carboxylate stretching band at 1549 cm−1 was hardly visible while those at 1378 and 1254 cm−1 were slightly shifted to 1345 and 1278 cm−1, respectively (Figure 4E). All these findings denote that SH together with CH were the cornerstone in the process of NPs formation. The results affirm the compatibility among the NPs ingredients.
Differential Scanning Calorimetry (DSC)
To investigate the melting and crystallization behavior of the drug and other polymers used in NPs preparation, DSC was performed. Figure 5A–E illustrates the DSC data of CTX, CH, SH, their physical mixtures in weight ratios representing F2-NPs and F2 –NPs, respectively. Figure 5A, shows a wide endothermic peak at 169°C corresponding to CTX melting point which indicates the crystalline anhydrous nature of untreated CTX.46 CH shows a broad endothermic peak at 75°C, due to polymer dehydration and loss of water associated with the hydrophilic groups (OH and NH2) of the amorphous CH (Figure 5B).52,53 Figure 5C, illustrates SH thermogram with a sharp endothermic peak at 65 oC.54 The physical mixture thermogram shows the same peaks of the drug and the plain polymers (Figure 5D). On the other hand, the DSC curve of F2-NPs reveals broadening of SH peak in addition to a shift of CTX peak to 186°C as a result of hydrogen bonding between CH and SH, in addition to NPs formation (Figure 5E).14 DSC results support the results of FT-IR which confirm that CTX was encapsulated within the NPs formed by the use of two naturally opposite charged polymers.14,16
 |
Figure 5 DSC thermograms of (A) CTX, (B) CH, (C) SH, (D) physical mixture of CH: SH: CTX (2:1:2) and (E) F2-NPs. |
Flow Properties
Hausner’s ratio is the most simple, fast and popular method of predicting powder flow characteristics. Table 3 summarizes the results of the angle of repose ( ) and HR of F2-NPs. The results show that dried NPs have good flow properties as per USP guidelines.55
 |
Table 3 Parameters of F2-NPs Flow Properties (See Table 2 for F2 Composition) |
Stability Study
Table 4 points out the high stability of F2-NPs upon storage at refrigerated and room temperature for 3 months with regard to PS, ZP and %DC. On the other hand, upon storage under high temperature of 40°C, NPs darkening was experienced, which may be attributed to drug decomposition through moisture absorbed by the polymers.56
 |
Table 4 PS, PDI, ZP and % DC of Dry F2-NPs, Stored at Different Storage Condition (See Table 2 for F2 Composition) |
In vitro Drug Release from the Optimized Formula
The in vitro release of the pure drug and F2-NPs were quite different. Pure CTX experienced burst release in both buffers of pH 6.8 and 7.4 and manifested almost complete release (90%) in about six hours maximally (Figure 6A and B). However, in F2-NPs, the release pattern was biphasic where an initial burst release was held for an hour followed by a second phase of sustained release lasting for 15 h. Possible justification for this biphasic release pattern of F2-NPs is that the initial burst release might be due to dissolution of free CTX adsorbed on the NPs surface. On the other hand, the second sustained release phase was attributed to diffusion of CTX from the NPs core. A more close insight into Figure 6 divulges that after one hour of release; both pure CTX and F2-NPs exhibited 68% and 15% drug release, respectively, at pH 6.8 (Figure 6A), while about 90% and 25% drug release at pH 7.4 (Figure 6B), which is indicative that CTX dissolution is dependent on the pH of the medium.46 These data reveal that the prepared NPs would exhibit sustained release for CTX for more than 16 h according to the pH of the medium.
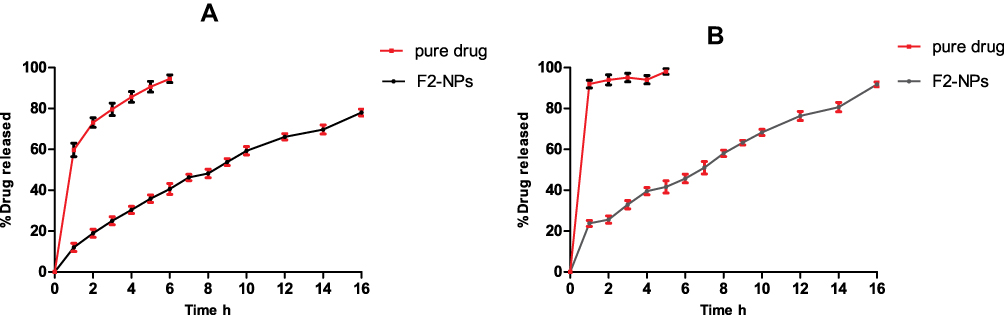 |
Figure 6 In vitro release of CTX from pure drug and F2-NPs in: (A) pH of 6.8 and (B) pH of 7.4. Each point represents the mean ± SE (n=3). |
By comparing the current in vitro drug release results of F2-NPs with those of the previously prepared enteric-coated tablets, it could be deduced that both dosage forms were able to sustain CTX release behavior; yet the NPs were more efficient.3
Kinetic Analysis of the Drug Release Data
Both first-order kinetic and Higuchi’s model with non-Fickian diffusion mechanism are the best models to describe the release kinetics of F2-NPs at pH 6.8 and 7.4, respectively, as inferred from R2 values (Table 5).
 |
Table 5 Kinetic Analysis of the Drug Release Data of F2-NPs (See Table 2 for F2 Composition) |
Oral Absolute Bioavailability and Pharmacokinetic Studies
Testing of Enteric-Coating Efficiency (Disintegration Test)
Results of enteric-coating efficiency confirmed the resistance of the prepared capsules to disintegration in gastric pH (1.2) for 2 h and their fast disintegration at intestinal pH 6.8 (in approximately 15 ± 0.38 min).
Pharmacokinetic Data Analysis
The incorporation of CTX into CH-NPs was explored to achieve the dual purpose; sustained drug release and improved oral absolute bioavailability of CTX. A noncompartmental analysis model was adopted to calculate the pharmacokinetic parameters. Results are summarized in Table 6.
 |
Table 6 Pharmacokinetic Parameters After Oral Administration of Enteric-Coated Hard Gelatin Capsules Loaded with F2-NPs (See Table 2 for F2 Composition) |
As seen in Figure 7 and Table 6, oral administration of enteric-coated HGCs loaded with F2-NPs elicited significant differences in pharmacokinetic parameters compared to those reported previously by the authors after administration of an equal dose of CTX to rabbits.3 F2-NPs are a new perspective for achieving good oral absolute bioavailability for CTX (F= 92%). The presence of CH could be mainly a possible justification for such enhancement. It would boost the electrostatic interaction frequency with the gut mucus (negatively charged), inevitably unlatching the tight junctions of epithelial cells and permitting CTX paracellular transport.29 It has also a pivotal role in inhibiting P-gp efflux which is considered one of the major obstacles against CTX absorption.57 Moreover, the direct uptake of NPs through the GIT, adhesion of the small positively charged NPs to its wall, as well as their prolonged release would undoubtedly augment the effects mentioned above. It might be inferred that the NPs acted as multi-scaffold for CTX release in the colon. Interestingly, 50 mg of CTX in the form of F2-Nps enhanced the MRT, MAT and Tmax by 1.5, 4.7 and 2-fold, respectively, compared to the previously prepared tablet.3
 |
Figure 7 Mean plasma concentration-time profile in male New Zealand white rabbits after oral administration of the enteric-coated HGCs loaded with F2-NPs equals to 50 mg of CTX. Each point represents the mean ± SE (n=6). |
Conclusion
Enteric-coated HGCs loaded with NPs enclosing CTX with a combination of CH and SH were successfully maneuvered. The NPs were prepared by the interaction of the cationic polymer (CH) and the anionic one (SH). The optimized NPs manifested encouraging results with respect to PS, ZP, and %EE (258 nm, +30.1 mv, 83% respectively). In vitro drug release of the optimized formula (F2) showed sustained release over 15 h in pH 7.4. The absolute bioavailability of the HGCs loaded with F2-NPs in rabbits was about 92% compared to our previously prepared enteric-coated CTX tablets, which experienced 80%. The remarkable increase in bioavailability was generally owed to boosting drug cellular uptake and stability through the tunable size and surface properties of the NPs, together with the unique mucoadhesion and p-glycoprotein inhibition effects of CH in particular. For the time being no available oral dosage form of CTX exists in the market. These NPs could be clinically tested. Besides, this nanotechnology could be applied to class III BCS drugs such as peptides and proteins taking in mind nanotoxicity.
Acknowledgment
The authors report that this manuscript is based on the Master’s thesis of the first author (Amir Elsayed Maghrabia). The second author (Mariza Fouad Boughdady) and the third author (Mahasen Mohamed Meshali) were supervisors.
Disclosure
The authors report no conflicts of interest for this work.
References
1. Ba B, Gaudin K, Désiré A, et al. Ceftriaxone absorption enhancement for noninvasive administration as an alternative to injectable solutions. Antimicrob Agents Chemother. 2018;62(12):1–12. doi:10.1128/AAC.01170-18
2. Raza A, Ngieng SC, Sime FB, et al. Oral meropenem for superbugs: challenges and opportunities. Drug DiscToday. 2020;26(2):551–560. doi:10.1016/j.drudis.2020.11.004
3. Maghrabia AE, Boughdady MF, Meshali MM. New perspective enteric-coated tablet dosage form for oral administration of ceftriaxone: in vitro and in vivo assessments. AAPS PharmSciTech. 2019;20(306):1–12. doi:10.1208/s12249-019-1512-y
4. Ghosh S, Ghosh S, Sil PC. Role of nanostructures in improvising oral medicine. Toxicol Rep. 2019;6:358–368. doi:10.1016/j.toxrep.2019.04.004
5. Wu Z-L, Zhao J, Xu R. Recent advances in oral nano-antibiotics for bacterial infection therapy. Int J Nanomed. 2020;15:9587. doi:10.2147/IJN.S279652
6. Das B, Patra S. Antimicrobials: meeting the challenges of antibiotic resistance through nanotechnology. In Nanostructures for Antimicrobial Therapy. Elsevier; 2017:1–22. doi:10.1016/B978-0-323-46152-8.00001-9
7. Ojemaye MO, Adefisoye MA, Okoh AI. Nanotechnology as a viable alternative for the removal of antimicrobial resistance determinants from discharged municipal effluents and associated watersheds: a review. J Environ Manage. 2020;275:111234. doi:10.1016/j.jenvman.2020.111234
8. Jaglal Y, Osman N, Omolo CA, Mocktar C, Devnarain N, Govender T. Formulation of pH-responsive lipid-polymer hybrid nanoparticles for co-delivery and enhancement of the antibacterial activity of vancomycin and 18β-glycyrrhetinic acid. J Drug Deliv Sci Technol. 2021;64:102607. doi:10.1016/j.jddst.2021.102607
9. Alruwaili NK, Zafar A, Imam SS, et al. Stimulus responsive ocular gentamycin-ferrying chitosan nanoparticles hydrogel: formulation optimization, ocular safety and antibacterial assessment. Int J Nanomed. 2020;15:4717–4737. doi:10.2147/IJN.S254763
10. Ali J, Bhatnagar A, Kumar N, Ali A. Chitosan nanoparticles amplify the ocular hypotensive effect of cateolol in rabbits. Int J Biol Macromol. 2014;65:479–491. doi:10.1016/j.ijbiomac.2014.02.002
11. Bin-Jumah M, Gilani SJ, Jahangir MA, et al. Clarithromycin-loaded ocular chitosan nanoparticle: formulation, optimization, characterization, ocular irritation, and antimicrobial activity. Int J Nanomedicine. 2020;15:7861. doi:10.2147/IJN.S269004
12. Agnihotri SA, Mallikarjuna NN, Aminabhavi TM. Recent advances on chitosan-based micro-and nanoparticles in drug delivery. JCR. 2004;100(1):5–28. doi:10.1016/j.jconrel.2004.08.010
13. Derry J. Investigating shellac: documenting the process, defining the product.: a study on the processing methods of shellac, and the analysis of selected physical and chemical characteristics.MD[dissertation].Oslo: uiO; 2012. Available from: https://www.duo.uio.no/bitstream/handle/10852/34480/Derry-Master.pdf.
14. Kraisit P, Limmatvapirat S, Nunthanid J, Sriamornsak P, Luangtana-Anan M. Nanoparticle formation by using shellac and chitosan for a protein delivery system. Pharm Dev Technol. 2013;18(3):686–693. doi:10.3109/10837450.2012.685657
15. Raza A, Sime FB, Cabot PJ, Maqbool F, Roberts JA, Falconer JR. Solid nanoparticles for oral antimicrobial drug delivery: a review. Drug Discov Today. 2019;24(3):858–866. doi:10.1016/j.drudis.2019.01.004
16. Zaki NM, Hafez MM. Enhanced antibacterial effect of ceftriaxone sodium-loaded chitosan nanoparticles against intracellular Salmonella typhimurium. AAPS Pharmscitech. 2012;13(2):411–421. doi:10.1208/s12249-012-9758-7
17. Kumar S, Bhanjana G, Kumar A, et al. Synthesis and optimization of ceftriaxone-loaded solid lipid nanocarriers. Chem Phys Lipids. 2016;200:126–132. doi:10.1016/j.Chem.Phys.Lip.2016.09.002
18. Manimekalai P, Dhanalakshmi R, Manavalan R. Preparation and characterization of ceftriaxone sodium encapsulated chitosan nanoparticles. Int J App Pharm. 2017;9:10–15. doi:10.22159/ijap.2017v9i6.16317
19. Bali GK, Singla S, Kashyap Y, et al. Preparation, physico-chemical characterization and pharmacodynamics of ceftriaxone loaded BSA nanoparticles. Nanomed Nanotech J. 2018;9(34):1–6. doi:10.4172/2157-7439.1000509
20. GadEl-Rab SM, Halawani EM, Hassan AM. Formulation of ceftriaxone conjugated gold nanoparticles and their medical applications against extended-spectrum β-lactamase producing bacteria and breast cancer. Microbiol Biotech J. 2018;28(9):1563–1572. doi:10.4014/jmb.1711.11037
21. Ebrahimi S, Farhadian N, Karimi M, et al. Enhanced bactericidal effect of ceftriaxone drug encapsulated in nanostructured lipid carrier against gram-negative Escherichia coli bacteria: drug formulation, optimization, and cell culture study. Antimicrob Resist Infect Control. 2020;9(1):1–2. doi:10.1186/s13756-020-0690-4
22. Kawish M, Elhissi A, Jabri T, et al. Enhancement in oral absorption of ceftriaxone by highly functionalized magnetic iron oxide nanoparticles. Pharmaceutics. 2020;12(6):1–17. doi:10.3390/pharmaceutics12060492
23. Ndayishimiye J, Popat A, Blaskovich M, Falconer JR. Formulation technologies and advances for oral delivery of novel nitroimidazoles and antimicrobial peptides. J Controlled Release. 2020;324:728–749. doi:10.1016/j.jconrel.2020.05.002
24. Raja MM, Lim PQ, Wong YS, et al. Polymeric nanomaterials: methods of preparation and characterization. In: Nanocarriers for Drug Delivery.
25. Clayton KN, Salameh JW, Wereley ST, Kinzer-Ursem TL. Physical characterization of nanoparticle size and surface modification using particle scattering diffusometry. Biomicrofluidics. 2019;10:557–653. doi:10.1016/B978-0-12-814033-8.00018-7
26. Clogston JD, Patri AK. Zeta potential measurement. In: Characterization of Nanoparticles Intended for Drug Delivery. USA: Springer;2011:63–70. doi:10.1007/978-1-60327-198-1
27. Wallace SJ, Li J, Nation R, Nation RL, Boyd BJ. Drug release from nanomedicines: selection of appropriate encapsulation and release methodology. Drug Deliv Transl Rev. 2012;2(4):284–292. doi:10.1007/s13346-012-0064-4
28. Mansi P, Ayushi M. Development and validation of UV spectrophotometric method for the estimation of ceftriaxone sodium in nanoparticles. Der Pharma Chemica. 2018;10(3):151–157.
29. Aman RM, Abuhashim II, Meshali MM. Novel chitosan-based solid-lipid nanoparticles to enhance the bio-residence of the miraculous phytochemical “apocynin”. Eur J Pharm Sci. 2018;124:304–318. doi:10.1016/j.ejps.2018.09.001
30. Osorio JG, Muzzio FJ. Effects of powder flow properties on capsule filling weight uniformity. Drug Dev Ind Pharm. 2013;39(9):1464–1475. doi:10.3109/03639045.2012.728227
31. Maheen S, Rasul A. Formulation, characterization and statistical optimization of enalapril loaded lipospheres by Box-Behnken Design. Bioinspired, Biomimetic Nanobiomater. 2020;9(4):202–212. doi:10.1680/jbibn.19.00065
32. Sreeharsha N, Rajpoot K, Tekade M, et al. Development of metronidazole loaded chitosan nanoparticles using qbd approach—a novel and potential antibacterial formulation. Pharmaceutics. 2020;12(10):920–942. doi:10.3390/pharmaceutics12100920
33. Pathak K, Pattnaik S. Stability testing parameters and issues for nanotechnology-based drug products. In: Methods for Stability Testing of Pharmaceuticals. USA: Springer;2018:293–305. doi:10.1007/978-1-4939-7686-7_13
34. Maheen S, Rasul A, Hanif M, Khan HU. Lipospheres for simultaneous controlled release and improved pharmacokinetic profiles of saxagliptin-enalapril: formulation, optimization, and comparative in vitro-in vivo evaluation. AAPS PharmSciTech. 2020;21(5):1–16. doi:10.1208/s12249-020-01733-w
35. Higuchi T. Mechanism of sustained-action medication: theoretical analysis of rate of release of solid drugs dispersed in solid matrices. J Pharm Sci. 1963;52(12):1145–1149. doi:10.1002/jps.2600521210
36. Korsmeyer RW, Gurny R, Doelker E, Buri P, Peppas NA. Mechanisms of solute release from porous hydrophilic polymers. Int J Pharm. 1983;15(1):25–35. doi:10.1016/0378-5173(83)90064-9
37. Imperiale JC, Nejamkin P, Delsole MJ, Lanusse CE, Sosnik A. Novel protease inhibitor-loaded nanoparticle-in-microparticle delivery system leads to a dramatic improvement of the oral pharmacokinetics in dogs. Biomaterials. 2015;37:383–394. doi:10.1016/j.biomaterials.2014.10.026
38. Oliveira H, Peixoto M, Tacon L. Enteric coating of hard gelatin capsules by the spouted bed process. J Appl Pharm Sci. 2013;3(8):57–63. doi:10.7324/JAPS.2013.3810
39. Thakkar HP, Desai JL, Parmar MP. Application of box-behnken design for optimization of formulation parameters for nanostructured lipid carriers of candesartan cilexetil. AJP. 2014;8(2):81–89. doi:10.4103/0973-8398.134921
40. Gan Q, Wang T. Chitosan nanoparticle as protein delivery carrier—systematic examination of fabrication conditions for efficient loading and release. Colloids Surf B Biointerfaces. 2007;59(1):24–34. doi:10.1016/j.colsurfb.2007.04.009
41. Rajinikanth PS, Chellian J. Development and evaluation of nanostructured lipid carrier-based hydrogel for topical delivery of 5-fluorouracil. Int J Nanomedicine. 2016;11:5067–5077. doi:10.2147/IJN.S117511
42. Kafshgari MH, Khorram M, Mansouri M, Samimi A, Osfouri S. Preparation of alginate and chitosan nanoparticles using a new reverse micellar system. IPJ. 2012;21(2):99–107. doi:10.1007/s13726-011-0010-1
43. Gan Q, Wang T, Cochrane C, Mccarron P. Modulation of surface charge, particle size and morphological properties of chitosan–TPP nanoparticles intended for gene delivery. Colloids Surf B Biointerfaces. 2005;44(2–3):65–73. doi:10.1016/j.colsurfb.2005.06.001
44. De Moura MR, Aouada FA, Mattoso LH. Preparation of chitosan nanoparticles using methacrylic acid. J Colloid Interface Sci. 2008;321(2):477–483. doi:10.1016/j.jcis.2008.02.006
45. Dudhipala N, Janga KY, Gorre T. Comparative study of nisoldipine-loaded nanostructured lipid carriers and solid lipid nanoparticles for oral delivery: preparation, characterization, permeation and pharmacokinetic evaluation. Artif Cells Nanomed Biotechnol. 2018;46(sup2):616–625. doi:10.1080/21691401.2018.1465068
46. Owens HM, Dash AK. Ceftriaxone sodium: comprehensive profile. In: Harry B, editor. Profiles of Drug Substances, Excipients and Related Methodology. Vol. 30. USA: Elsevier; 2003:21–57. doi:10.1016/S0099-5428(03)30002-4.
47. Xu Y, Du Y. Effect of molecular structure of chitosan on protein delivery properties of chitosan nanoparticles. Int J Pharm. 2003;250(1):215–226. doi:10.1016/S0378-5173(02)00548-3
48. Fernandes QM, Melo KRT, Sabry DA, Sassaki GL, Rocha HAO. Does the use of chitosan contribute to oxalate kidney stone formation. Mar Drugs. 2014;13(1):141–158. doi:10.3390/md13010141
49. Limmatvapirat S, Panchapornpon D, Limmatvapirat C, et al. Formation of shellac succinate having improved enteric film properties through dry media reaction. Eur J Pharm Biopharm. 2008;70(1):335–344. doi:10.1016/j.ejpb.2008.03.002
50. Nunthanid J, Laungtana-Anan M, Sriamornsak P, et al. Characterization of chitosan acetate as a binder for sustained release tablets. JCR. 2004;99(1):15–26. doi:10.1016/j.jconrel.2004.06.008
51. Papadimitriou S, Bikiaris D, Avgoustakis K, Karavas E, Georgarakis M. Chitosan nanoparticles loaded with dorzolamide and pramipexole. Carbohydr Polym. 2008;73(1):44–54. doi:10.1016/j.carbpol.2007.11.007
52. Shantha K, Harding D. Synthesis and characterisation of chemically modified chitosan microspheres. Carbohydr Polym. 2002;48(3):247–253. doi:10.1016/S0144-8617(01)00244-2
53. Guinesi LS, Cavalheiro ETG. The use of DSC curves to determine the acetylation degree of chitin/chitosan samples. Thermochim Acta. 2006;444(2):128–133. doi:10.1016/j.tca.2006.03.003
54. Zhang RG, Zhang H, Zhang Z, Zheng H, Feng Y, Zhang W. Characterization of five natural resins and waxes by differential scanning calorimetry (DSC). Adv Mater Res. 2006;444(2):128–133. doi:10.1016/j.tca.2006.03.003
55. USP. The United States Pharmacopeia. National Formulary. 40th Revision. Rockville (MD) 20852: United States Pharmacopeial Convention; 2017.
56. De Diego M, Godoy G, Mennickent S. Chemical stability of ceftriaxone by a validated stability-indicating liquid chromatographic method. JCCHEMS. 2010;55(3):335–337. doi:10.4067/S0717-97072010000300013
57. Föger F, Schmitz T, Bernkop A. In vivo evaluation of an oral delivery system for p-gp substrates based on thiolated chitosan. Biomaterials. 2006;27(23):4250–4255. doi:10.1016/j.biomaterials.2006.03.033
 © 2021 The Author(s). This work is published and licensed by Dove Medical Press Limited. The full terms of this license are available at https://www.dovepress.com/terms.php and incorporate the Creative Commons Attribution - Non Commercial (unported, v3.0) License.
By accessing the work you hereby accept the Terms. Non-commercial uses of the work are permitted without any further permission from Dove Medical Press Limited, provided the work is properly attributed. For permission for commercial use of this work, please see paragraphs 4.2 and 5 of our Terms.
© 2021 The Author(s). This work is published and licensed by Dove Medical Press Limited. The full terms of this license are available at https://www.dovepress.com/terms.php and incorporate the Creative Commons Attribution - Non Commercial (unported, v3.0) License.
By accessing the work you hereby accept the Terms. Non-commercial uses of the work are permitted without any further permission from Dove Medical Press Limited, provided the work is properly attributed. For permission for commercial use of this work, please see paragraphs 4.2 and 5 of our Terms.