")
Back to Journals » Journal of Inflammation Research » Volume 17
Construction of Immune-Related Diagnostic Model for Latent Tuberculosis Infection and Active Tuberculosis
Authors Zhang Z, Wang Y, Zhang Y, Geng S, Wu H, Shao Y, Kang G
Received 23 November 2023
Accepted for publication 16 April 2024
Published 24 April 2024 Volume 2024:17 Pages 2499—2511
DOI https://doi.org/10.2147/JIR.S451338
Checked for plagiarism Yes
Review by Single anonymous peer review
Peer reviewer comments 2
Editor who approved publication: Dr Tara Strutt
Zhihua Zhang,1 Yuhong Wang,2 Yankun Zhang,3 Shujun Geng,2 Haifeng Wu,4 Yanxin Shao,5 Guannan Kang6
1Department of Science & Education, Hebei Chest Hospital, Hebei Provincial Key Laboratory of Lung Disease, Shijiazhuang, People’s Republic of China; 2Department of Tuberculosis, Hebei Chest Hospital, Hebei Provincial Key Laboratory of Lung Disease, Shijiazhuang, People’s Republic of China; 3Department of Ophthalmology, Hebei Chest Hospital, Hebei Provincial Key Laboratory of Lung Disease, Shijiazhuang, People’s Republic of China; 4Clinical Laboratory, Hebei Chest Hospital, Hebei Provincial Key Laboratory of Lung Disease, Shijiazhuang, People’s Republic of China; 5Office of Clinical Pharmacological Center, Hebei Chest Hospital, Hebei Provincial Key Laboratory of Lung Disease, Shijiazhuang, People’s Republic of China; 6Department of Tuberculosis, Hebei Chest Hospital, Shijiazhuang, People’s Republic of China
Correspondence: Yanxin Shao, Office of Clinical Pharmacological Center, Hebei Chest Hospital, Hebei Provincial Key Laboratory of Lung Disease, No. 372, Sheng Li North Street, Shijiazhuang, Hebei, 050041, People’s Republic of China, Email [email protected]
Background: Tuberculosis (TB) is one of the most infectious diseases caused by Mycobacterium tuberculosis (M. tb), and the diagnosis of active tuberculosis (TB) and latent TB infection (LTBI) remains challenging.
Methods: Gene expression files were downloaded from the GEO database to identify the differentially expressed genes (DEGs). The ssGSEA algorithm was applied to assess the immunological characteristics of patients with LTBI and TB. Weighted gene co-expression network analysis, protein-protein interaction network, and the cytoHubba plug-in of Cytoscape were used to identify the real hub genes. Finally, a diagnostic model was constructed using real hub genes and validated using a validation set.
Results: Macrophages and natural killer cells were identified as important immune cells strongly associated with TB. In total, 726 mRNAs were identified as DEGs. MX1, STAT1, IFIH1, DDX58, and IRF7 were identified as real hub immune-related genes. The diagnostic model generated by the five real hub genes could distinguish active TB from healthy controls or patients with LTBI.
Conclusion: Our study may provide implications for the diagnosis and drug development of M. tb infections.
Keywords: tuberculosis, latent tuberculosis infection, mycobacterium tuberculosis, immune, diagnostic model
Introduction
Tuberculosis (TB), a chronic disease caused by Mycobacterium tuberculosis (M. tb), is the leading cause of death from a single infectious agent (ranking above HIV/AIDS).1 Globally, there were 6.4 million newly diagnosed TB cases and 1.4 million deaths caused by TB in 2021.2 The disease typically affects the lungs (pulmonary TB) but can also affect other sites (extrapulmonary TB). Indeed, approximately 90% of infected people do not display clinical symptoms and not contagious, and are in a state known as “latent TB infection” (LTBI).3 The fine line between TB and LTBI is the presence or absence of clinical symptoms, imaging changes, and bacteriological evidence of active TB. LTBI is the reservoir of the TB epidemic.4 Of those infected with TB, approximately 5–10% will develop TB during their lifetime.5 The World Health Organization (WHO) “End Tuberculosis Strategy” recommended that early diagnosis and treatment of LTBI patients at a higher risk of infection was essential to effectively control TB globally.6 The tuberculin skin test fails to distinguish patients with LTBI from those with TB and people who have received Bacillus Calmette-Guérin vaccination.7 The lack of biomarkers to distinguish active TB from LTBI limited the progress in TB control. The latest data indicated that lack of differential diagnosis of LTBI and TB may be a potential reason for the high morbidity and mortality in countries with a high TB burden.8 Therefore, the development of rapid, simple, and cost-effective diagnostic tests is imperative for TB control.9
Innate immunity plays an essential role in mediating the initial host response to M. tb infections. The course of infection and disease development largely depends on the early interactions between M. tb and the host innate immune system.10 Innate immune cells are the first to encounter M. tb, such as macrophages, dendritic cells, neutrophils, and natural killer cells.11 Macrophages are the first immune cells to encounter M. tb and are the dominant cellular niche for M. tb during both early and chronic infection.12 Dendritic cells are critical in bridging innate and adaptive immunity by presenting M. tb antigens to initiate adaptive immunity.13 Neutrophils are the first cells to infiltrate the lungs after M. tb infection and are the most abundant cell type found in the bronchoalveolar lavage and sputum of the active pulmonary TB patients.14 Natural killer cells act early during M. tb infection and are not major histocompatibility complex-restricted.15 CD153, derived from CD4 T cells, is a major immune mediator of host protection against pulmonary M. tb infection.16 TREM2 specifically binds to M. tb, disabling the macrophage antibacterial response and promoting mycobacterial immune evasion in macrophage.17 SP110b plays a crucial role in shaping the inflammatory milieu that supports host protection during M. tb infection.18
Here, gene expression files of healthy controls, LTBI, and active TB were downloaded from the GEO database to identify differentially expressed genes (DEGs) between patients with M. tb infection (LTBI + TB group) and healthy controls. We aimed to screen for potential immune-related biomarkers to construct a diagnostic model that can distinguish LTBI from active TB, thus providing implications for the diagnosis and drug development for M. tb infection.
Materials and Methods
Data Preparation
All gene expression data were from public databases, and data processing was carried out by R (version: 3.5.3) software (https://www.r-project.org/). Using “tuberculosis” as the keyword and limiting the sample type to whole blood, three datasets were gathered from the GEO database after excluding cell line/animal level studies and single sample studies (Table 1). The probe level data was converted into gene expression values. For probes corresponding to multiple genes, the average expression value is used as the gene expression value. The batch effect was removed using the combat function in R package “sva”. We further paired GSE42826 and GSE79362-264 as a training set, including 52 healthy controls, 168 patients with LTBI, and 109 patients with active TB, and paired GSE42825 and GSE79362-91 as a validation set, including 23 healthy controls, 79 patients with LTBI, and 20 patients with active TB. The characteristics of the patients involved in three datasets were displayed in Table S1.
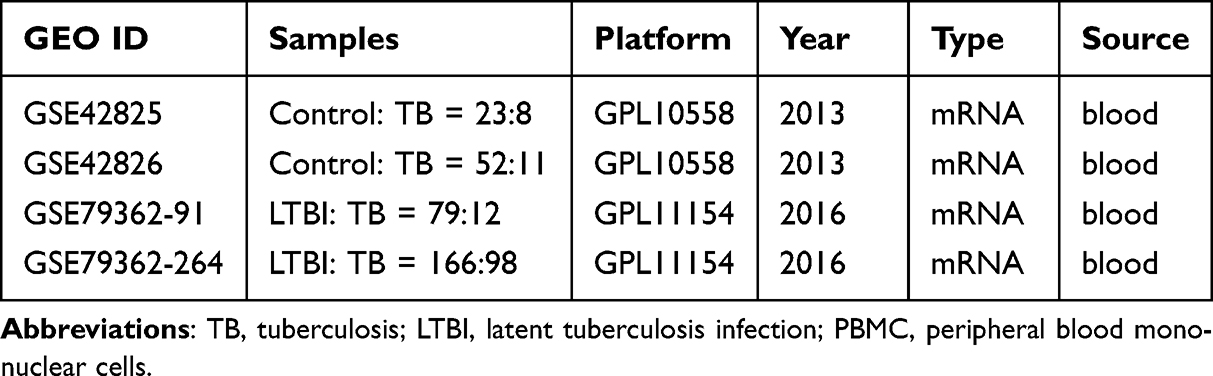 |
Table 1 Datasets Included in This Study |
Characteristic of Immune Infiltration
The ssGSEA algorithm was applied to comprehensively assess the immunological characteristics of all samples included in the study. The enrichment scores calculated by ssGSEA analysis were utilized to represent the relative abundance of each infiltrating cell in each sample. Differences in immune cell infiltration among different groups were compared. In addition, a machine learning algorithm, was used to screen important immune cell types. Using the LASSO algorithm, with glmnet (version 2.0–18) package in R, the candidate important immune cell types of the first group were obtained. Then the importance of each immune cell type was ranked according to the mean decrease in accuracy using the random forest algorithm, with randomForest (version 4.6–14) package in R, and the first 25% were selected as important immune cell types of the second group. Finally, the important immune cell types were obtained by intersecting the immune cells identified by LASSO regression analysis, the immune cells identified by the random forest algorithm, and different immune cells.
Differentially Expressed Analysis and Weighted Gene Co-Expression Network Analysis (WGCNA)
DEGs between patients with M. tb infection (LTBI+TB group) and healthy controls in the training set were identified using limma (version 3.36.5) in the R package with p-value <0.05. The first 25% of genes with large variations according to their variance were selected for WGCNA analysis. Hierarchical clustering analysis was performed using the Hclust function in R language to exclude outlier samples. Then, the “pickSoftThreshold” function is used to select an appropriate soft power β to build the scale-free topology. The height was set to 0.90 and the soft power β was set to 5. The adjacency matrix was then transformed into a topological overlap matrix (TOM) and the corresponding dissimilarity (1-TOM). Genes with similar expression patterns were grouped together, and modules were divided according to the “cutreeDynamic” function using the default parameters. The minimal gene module size was set to 50 to obtain the appropriate number of modules and the threshold to merge similar modules was set to 0.25. Intersections between DEGs and genes in the WGCNA modules were identified as hub genes.
Identification of Real Hub Genes
A protein-protein interaction (PPI) network was constructed using the STRING database (https://cn.string-db.org/). Then, the real hub genes were identified using the CytoHubba plug-in in Cytoscape (version 3.9.0). Six different calculation methods, namely, degree, Maximum Neighborhood Component (MNC), Maximal Clique Centrality (MCC), Edge Percolated Component (EPC), stress, and closeness, were used to evaluate the importance of each node, and the top 20 nodes were selected using “UpSet”(version 1.4.0) package in R. The real hub genes were the common nodes.
Construction and Validation of Diagnostic Model
A diagnostic model was constructed based on real hub gene expression and logistic regression in the training set. Receiver operating characteristic curve (ROC) analysis was performed using the R package “pROC” (version 1.15.0), then the area under the curve (AUC) was calculated to determine the accuracy of the diagnostic model. The diagnostic model was validated using a validation set.
Real Time qPCR (RT-qPCR) Validation of Real Hub Genes
Blood samples from nine patients with TB/LTBI and 12 controls were subjected to perform RT-qPCR. Total RNA from the blood samples was extracted using the MagZol LS Reagent according to the manufacturer’s protocol. The research protocol was in accordance with the tenets of the Declaration of Helsinki. All participating individuals provided written informed consent. The study was approved by the Ethics Committee of Hebei Chest Hospital (2,022,084). RT-qPCR was performed using an ABI 7300 Real-time PCR Detection System with SuperReal PreMix Plus (SYBR Green) (TIANGEN, Beijing, China). Relative gene expression was analyzed by 2−ΔΔCT method. GAPDH was used as an endogenous control. The characteristics of the individuals are presented in Table 2.
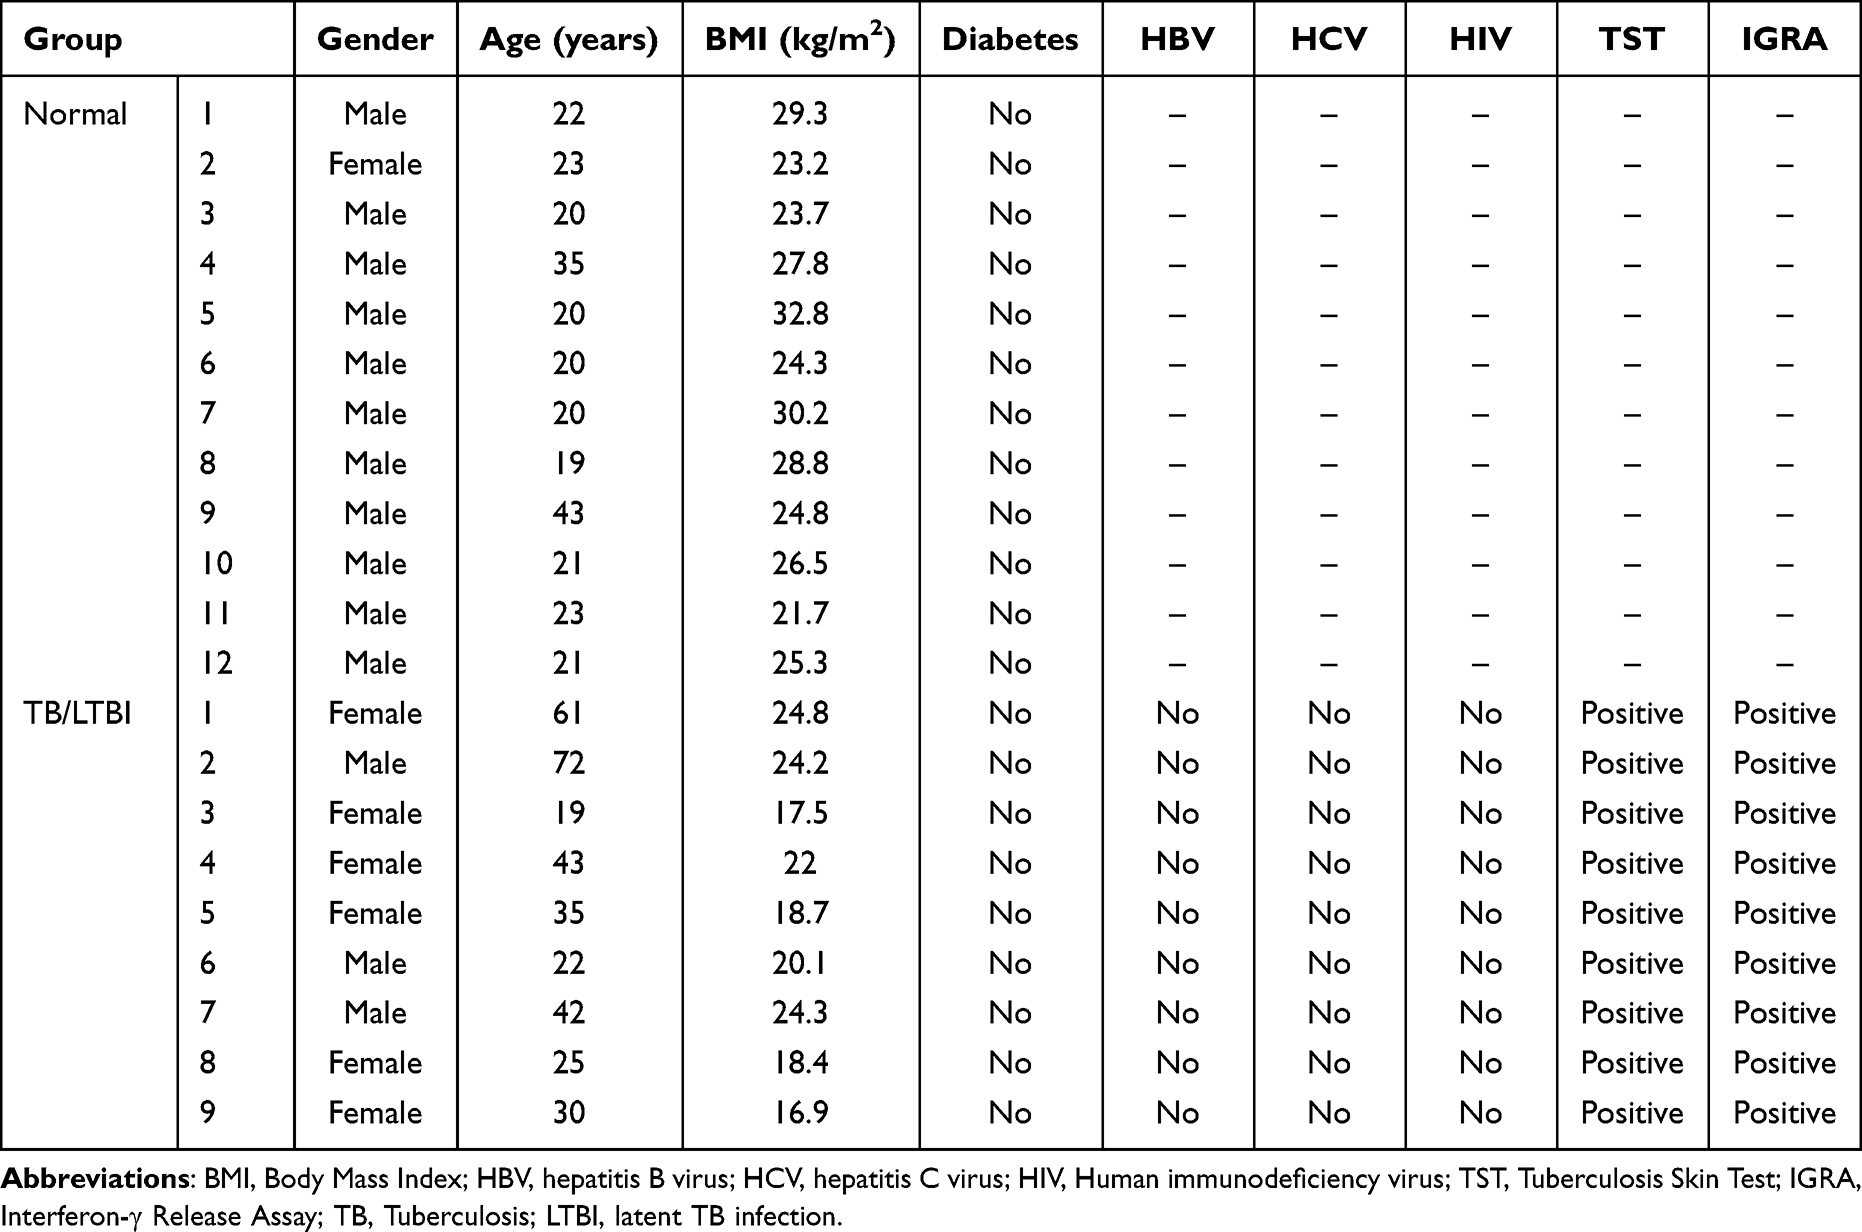 |
Table 2 Demographic Characteristics of Participants in This Study |
Results
Identification of Important Immune Cells
Immunological features were evaluated according to immune cell infiltration. Using the ssGSEA algorithm, eight significantly different immune cell types were identified between LTBI+TB group and control group: MDSC, neutrophil, regulatory T cell, activated dendritic cell, monocyte, natural killer cell, type 17 T helper cell, and macrophage (Figure 1A). LASSO regression analysis, based on 23 immune cell types, screened four immune cell types (macrophage, natural killer cell, regulatory T cell, and type 17 T helper cell) (Figure 1B and C). The importance value of each immune cell type was ranked according to the mean decrease in accuracy using the random forest algorithm, and the first 25% were selected: T follicular helper cell, MDSC, macrophage, plasmacytoid dendritic cell, monocyte, and natural killer cell (Figure 1D). By overlapping the immune cells identified by LASSO regression analysis, the immune cells identified by the random forest algorithm, and different immune cells identified between LTBI+TB group and control group, macrophages and natural killer cells were determined as important immune cells. Figure 1E shows that compared with the LTBI group, the TB group showed higher infiltration levels of macrophage and natural killer cell. Additionally, the correlation between macrophage and natural killer cell was evaluated in the control, LTBI, and TB groups. The results indicated no significant correlation between macrophage and natural killer cell in the control group and a significant positive correlation in the LTBI (0.49) and TB (0.6) groups (Figure 1F–H). Immune infiltration levels of macrophage and natural killer cell were also evaluated in the validation set. Compared to the control group, the LTBI+TB group showed higher infiltration levels of macrophage and natural killer cell (Figure 2A). Compared to the LTBI group, the TB group also showed higher infiltration levels of macrophage and natural killer cell (Figure 2B).
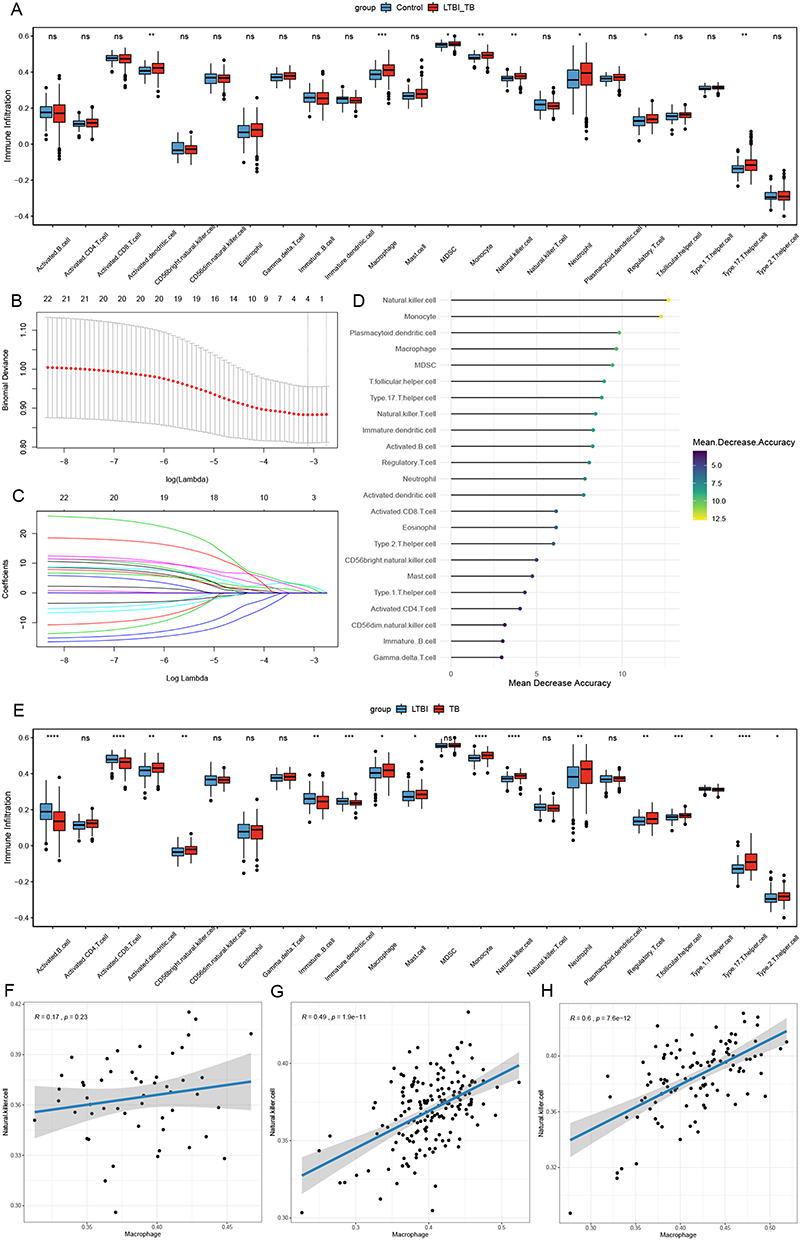 |
Figure 1 Identification of important immune cells. (A) The abundance of each immune infiltrating cell in LTBI+TB group and control group. (B and C) The LASSO regression analysis. (D) The importance value of each immune cell type ranked according to the mean decrease in accuracy. (E) The abundance of each immune infiltrating cell in LTBI group and TB group. (F–H) The correlation analysis of macrophage and natural killer cell in control group (F), LTBI group (G) and TB group (H). *Indicated p <0.05, **Indicated p <0.01, ***Indicated p <0.001, ****Indicated p <0.0001. Abbreviations: LTBI, latent TB infection; TB, tuberculosis. |
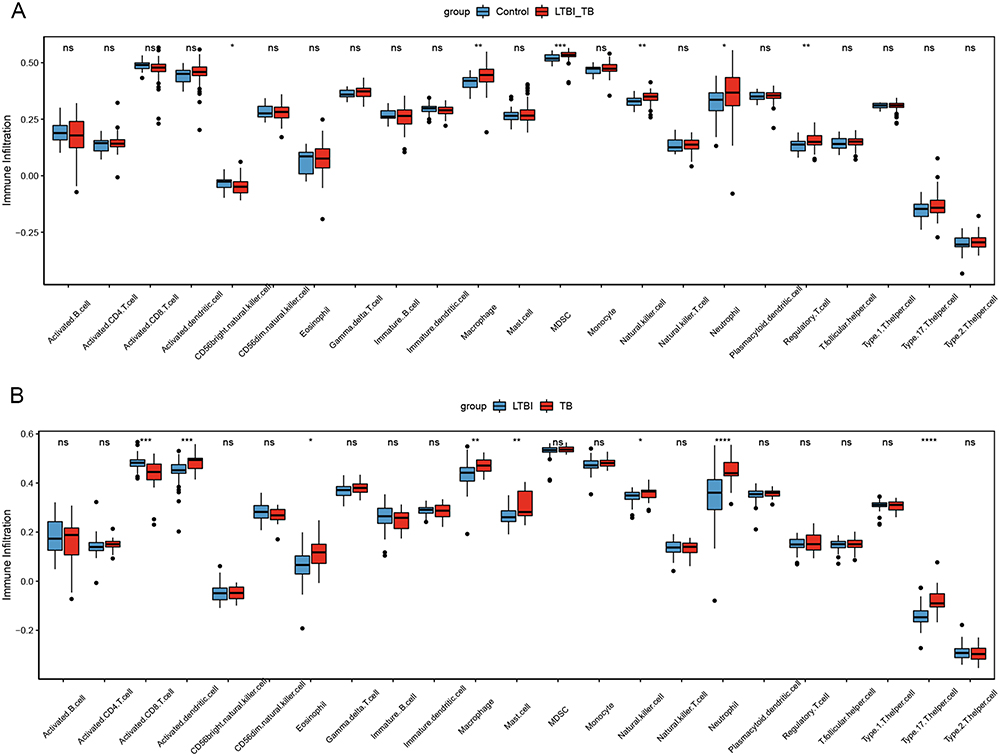 |
Figure 2 The immune infiltrate levels of macrophage and natural killer cell in validation set. (A) Control group versus LTBI+TB group. (B) LTBI group versus TB group. *Indicated p <0.05, **Indicated p <0.01, ***Indicated p <0.001, ****Indicated p <0.0001. Abbreviations: LTBI, latent TB infection; TB, tuberculosis. |
WGCNA and Identification of Hub Genes
A total of 726 mRNAs, including 389 up-regulated and 373 down-regulated mRNAs, were identified as DEGs (p-value <0.05) (Figure S1). The first 25% of 726 DEGs were subjected for WGCNA. Immune cell scores in each sample were calculated using ssGSEA based on gene expression data. The scores of macrophage and natural killer cell were extracted as phenotypic data, and their association with the WGCNA module was analyzed. Then, 9 models were obtained. Among the nine modules, the turquoise module was highly correlated with macrophages (r = 0.73, p = 5e-56), and the yellow module was highly correlated with natural killer cell (r = 0.59, p = 1e-32) (Figure 3A). Thus, the turquoise and yellow modules were selected for further analysis. With |GS| >0.2 and |MM| >0.4, 504 genes were identified as macrophage/natural killer cell-associated genes (Figure 3B and C). A total of 202 hub genes were identified by overlapping macrophage/natural killer cell-associated genes and DEGs.
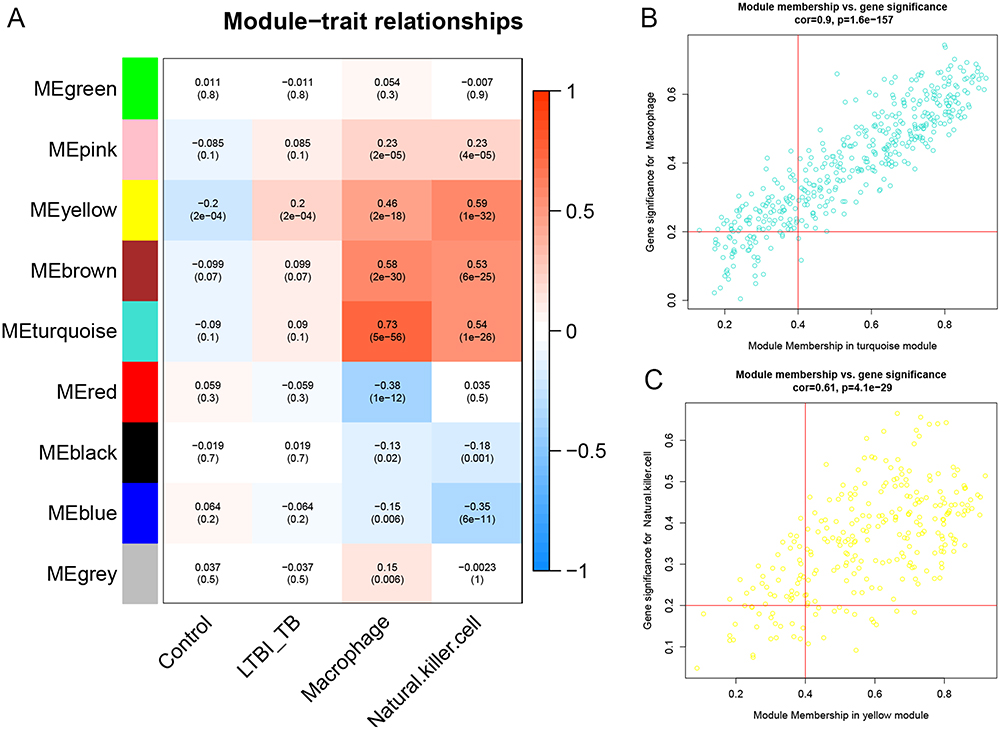 |
Figure 3 Weighted gene co-expression network analysis. (A) The module trait relationships. (B) A scatter plot of genes in the turquoise module. (C) A scatter plot of genes in the yellow module. LTBI, latent TB infection; TB, tuberculosis. |
Identification of Real Hub Genes
The PPI network of the hub genes was constructed using Cytoscape, which contained 150 nodes and 1105 interaction pairs (Figure 4A). Based on six topological analysis methods, MX1, STAT1, IFIH1, DDX58, and IRF7 were identified as real hub genes and were up-regulated (Figure 4B). Correlation analysis of these five genes suggested a strong positive correlation among them (Figure S2A). DDX58 showed the strongest correlation with IFIH1 (0.94), whereas STAT1 showed the smallest correlation with MX1 (0.65). Furthermore, correlation analysis of these five genes and two important immune cells (macrophage and natural killer cell) was performed (Figure S2B). These results indicated that all five genes had strong positive correlations with the two immune cells. Among these, STAT1 had the strongest positive correlation with natural killer cell.
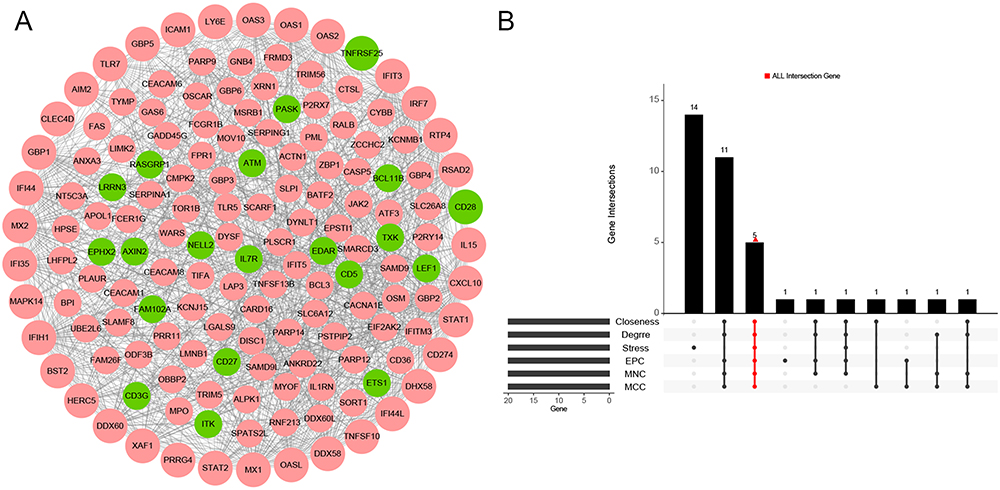 |
Figure 4 Identification of real hub genes(A) Protein-protein interaction (PPI) network. (B) The common genes in Degree, MNC, MCC, EPC, Stress and Closeness. Abbreviations: MNC, Maximum Neighborhood Component; MCC, Maximal Clique Centrality; EPC, Edge Percolated Component. |
Construction and Validation of Diagnostic Model
The diagnostic models were constructed based on different groups in the training set: control group vs LTBI group, control group vs TB group, and LTBI group vs TB group. In the control group vs the LTBI group, the diagnostic efficacy of the model constructed using a combination of five real hub genes was not ideal, and the AUC was only 0.591 (Figure 5A). The AUC was 0.834 in the control group vs the TB group (Figure 5B), and 0.784 in the LTBI group vs the TB group (Figure 5C). In addition, all five genes were highly expressed in the LTBI+TB group compared with the control group (Figure 5D). Similarly, all five genes were highly expressed in the TB group compared with those in the LTBI group (Figure 5E). The same analysis was performed for the validation set to validate of the diagnostic performance of the models. The AUC of the model was 0.742 for the control group vs the LTBI group (Figure 6A), 0.961 for the control group vs the TB group (Figure 6B), and 0.853 for the LTBI group vs the TB group (Figure 6C). Compared with the control group, DDX58, IFIH1, IRF7, and STAT1 were highly expressed in the LTBI+TB group (Figure 6D). Compared with the LTBI group, DDX58, IFIH1, IRF7, and STAT1 were highly expressed in the TB group (Figure 6E). In general, the diagnostic model performed well at distinguishing active TB from healthy controls or distinguishing active TB from LTBI.
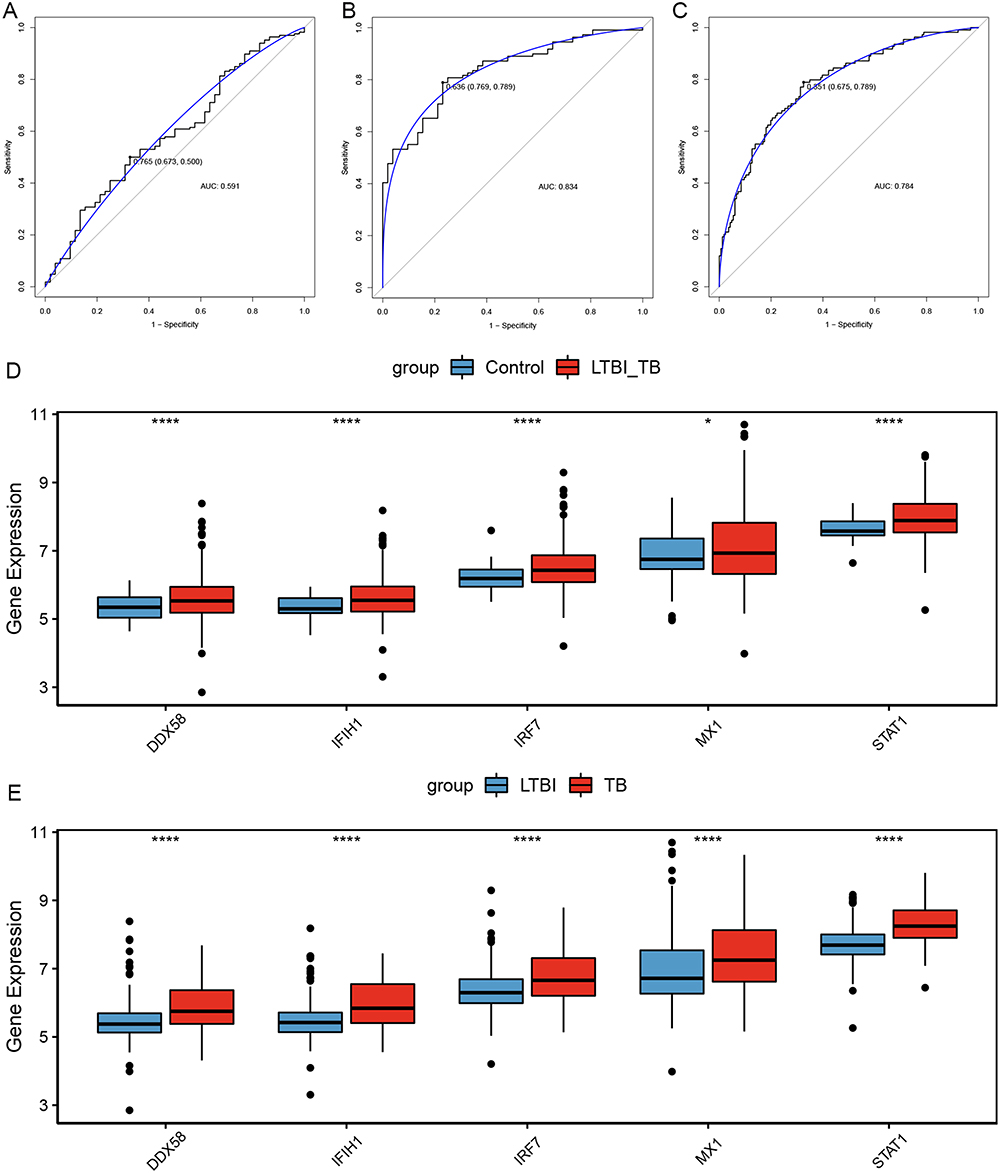 |
Figure 5 Construction of diagnostic model in training set. (A) ROC curves of diagnostic model in control group and LTBI group. (B) ROC curves of diagnostic model in control group and TB group. (C) ROC curves of diagnostic model in LTBI group and TB group. (D) The expression levels of five hub genes in control group versus LTBI+TB group. (E) The expression levels of five hub genes in LTBI group versus TB group. *Indicated p <0.05, ****Indicated p <0.0001. Abbreviations: ROC, receiver operating characteristic; AUC, area under the curve; LTBI, latent TB infection; TB, tuberculosis. |
 |
Figure 6 Validation of diagnostic model in validation set. (A) ROC curves of diagnostic model in control group and LTBI group. (B) ROC curves of diagnostic model in control group and TB group. (C) ROC curves of diagnostic model in LTBI group and TB group. (D) The expression levels of five hub genes in control group versus LTBI+TB group. (E) The expression levels of five hub genes in LTBI group versus TB group. *Indicated p <0.05, **Indicated p <0.01, ***Indicated p <0.001. Abbreviations: ROC, receiver operating characteristic; AUC, area under the curve; LTBI, latent TB infection; TB, tuberculosis. |
RT-qPCR Validation of Five Real Hub Genes
The expression levels of the five real hub genes were validated in human subjects by RT-qPCR. Compared with the control group, all five genes (MX1, STAT1, IFIH1, DDX58, and IRF7) were significantly up-regulated in the LTBI+TB group, which was in agreement with the integration analysis results (Figure 7).
 |
Figure 7 RT-qPCR validation of five real hub genes ***Indicated p <0.001, ****Indicated p <0.0001. Abbreviations: LTBI, latent TB infection; TB, tuberculosis. |
Discussion
TB remains a major global threat, and the use of existing immunological methods, such as the tuberculin skin test and interferon-gamma release assays, has some limitations in guiding the clinical prevention and treatment of TB.19 Therefore, it is crucial to develop potential biomarkers for effective diagnosis and treatment of TB.
In this study, after a series of analyses including ssGSEA, LASSO analysis, and random forest algorithms, macrophage and natural killer cell were determined as important immune cell types. Macrophages, as the cornerstone of the immune system, play crucial roles in maintaining tissue integrity, homeostasis, regulating inflammatory processes, and control of bacterial infections.20 Macrophages are initially divided into M1 and M2 types, with the former having pro-inflammatory properties and the latter having anti-inflammatory properties.21 Evidence indicates that early clearance of M. tb infection is associated with robust innate immune responses in resident macrophages.22 Paradoxically, macrophages are the primary host cells for M. tb in the host.23 M. tb subverts the macrophage’s mechanisms of intracellular killing and antigen presentation, ultimately leading to TB.24 Necrosis of infected macrophages constitutes a critical pathogenic event in TB by releasing M. tb into the growth-permissive extracellular environment.25 Type I interferon signaling mediates M. tb-induced macrophage death.26 Natural killer cells are lymphocytes of the innate immune system that participate in the initial defense against a wide variety of pathogens, including viruses and intracellular bacteria, by producing high levels of pro-inflammatory cytokines.27 Natural killer cells are involved in cavity formation in patients with pulmonary TB patients.28 Cai et al observed that natural killer cell subsets (CD3-CD7+GZMB+) gradually deplete from healthy controls to LTBI and TB, and three subsets of macrophage CD14+ cells (M1, M4, and M6) were specifically enriched in TB.29
Here, we constructed a diagnostic model generated using five real hub genes (MX1, STAT1, IFIH1, DDX58, and IRF7) to distinguish active TB from healthy controls or distinguish active TB from LTBI. MX1 encodes a guanosine triphosphate (GTP)-metabolizing protein that participates in the cellular anti-viral response and antagonizes the replication process of multiple different viruses. The rare variant in the MX1 alleles increase human susceptibility to the zoonotic H7N9 influenza virus.30 MX1 in hematopoietic cells contributes to protection against Thogoto virus infection.31 MX1 can enhance anti-viral resistance against mucosal influenza viral infection.32 In addition, overexpression of MX1 was identified in human peripheral blood mononuclear cells stimulated with M. tb PPE57.33 IFIH1 is a novel regulator for promoting M1 macrophage polarization.34 STAT1 is a member of the STAT protein family and a key component that mediates interferon signaling.35 This protein plays an important role in the immune response to viral, fungal, and mycobacterial pathogens. A case report identified a STAT1 mutation in a patient with cutaneous TB.36 STAT1 acts as a crucial part in the immune defense against TB infection and is associated with the interferon signaling pathway.37 Unphosphorylated STAT1 represses apoptosis in macrophages to promote immune evasion during M. tb infection.38 Liang et al indicated that STAT1 is involved in the M1-macrophage polarization and is correlated with the pathogenesis of extrapulmonary TB.39
DDX58, also known as RIG-I, is involved in viral double-stranded RNA recognition and the regulation of the anti-viral innate immune response. Common variants in DDX58 are related to susceptibility to severe influenza virus infection in children and adolescents.40 Wang et al indicated that DDX58 and IRF7 are associated with the response mechanism of the host to M. tb.41 Mycobacterial infection induces IFN-β production through the host RIG-I/MAVS/IRF7 RNA-sensing pathway.42 It has been demonstrated that extracellular vesicles released by M. tb-infected macrophages stimulate RIG-I/MAVS-dependent type I interferon production in macrophages to promote host immunity and bacterial killing.43 Zhang et al demonstrated that IRF7-mediated miRNA-31 is a protective immune component against M. tb infection.44 In a Brazilian cohort, polymorphisms in IRF7 rs11246213 were associated with altered susceptibility to M. tb infection.45 Similar to MX1, overexpressed IRF7 was also detected in human peripheral blood mononuclear cells stimulated by M. tb PPE57.33
Even though this study evidenced several promising results based on data mining and bioinformatics analysis, there are some limitations to the study that require consideration. The gene expression files were derived from the GEO database, and diagnostic model establishment and validation were performed based on the GEO database as well. The protein expression levels of the real hub genes were not detected. Due to the lack of in vivo and in vitro confirmatory experiments, molecular experiments as well as follow-up of larger clinical samples should be performed to investigate the molecular mechanisms of these real hub genes in the pathogenesis and progression of TB.
In conclusion, our study identified two important immune cells that were strongly associated with TB and DEGs between patients with M. tb infection (LTBI + TB group) and healthy controls. Five real hub genes were identified to construct the diagnostic model that could distinguish TB from LTBI or healthy controls. Further experiments are advocated to validate the diagnostic model and to study the biological functions of real hub genes in TB.
Data Sharing Statement
The dataset supporting the conclusions of this article is included within the article.
Ethics Approval and Consent to Participate
All participating individuals provided written informed consent. The study was approved by the Ethics Committee of Hebei Chest Hospital (2022084).
Author Contributions
All authors made a significant contribution to the work reported, whether that is in the conception, study design, execution, acquisition of data, analysis and interpretation, or in all these areas; took part in drafting, revising or critically reviewing the article; gave final approval of the version to be published; have agreed on the journal to which the article has been submitted; and agree to be accountable for all aspects of the work.
Funding
This work was supported by Clinical Medical Talent Training Program (361013).
Disclosure
The authors declare that they have no competing interests in this work.
References
1. Segueni N, Jacobs M, Ryffel B. Innate type 1 immune response, but not IL-17 cells control tuberculosis infection. Biomedical J. 2021;44(2):165–171.
2. Global tuberculosis report 2022. Geneva: World Health organization;2022.
3. Houben RM, Dodd PJ, Metcalfe JZ. The global burden of latent tuberculosis infection: A re-estimation using mathematical modelling. PLoS Med. 2016;13(10):e1002152. doi:10.1371/journal.pmed.1002152
4. Churchyard G, Kim P, Shah NS, et al. What we know about tuberculosis transmission: An overview. J Infect Dis. 2017;216(suppl_6):S629–S635. doi:10.1093/infdis/jix362
5. Chee CBE, Reves R, Zhang Y, Belknap R. Latent tuberculosis infection: opportunities and challenges. Respirology. 2018;23(10):893–900. doi:10.1111/resp.13346
6. Li Y, Deng Y, He J. Monocyte-related gene biomarkers for latent and active tuberculosis. Bioengineered. 2021;12(2):10799–10811. doi:10.1080/21655979.2021.2003931
7. Pourakbari B, Mamishi S, Benvari S, Mahmoudi S. Comparison of the quantiFERON-TB gold plus and quantiFERON-TB gold in-tube interferon-γ release assays: A systematic review and meta-analysis. Adv Med Sci. 2019;64(2):437–443. doi:10.1016/j.advms.2019.09.001
8. Gong W, Wu X. Differential diagnosis of latent tuberculosis infection and active tuberculosis: A key to a successful tuberculosis control strategy. Front Microbiol. 2021;12:745592. doi:10.3389/fmicb.2021.745592
9. Perumal P, Abdullatif MB, Garlant HN, et al. Validation of differentially expressed immune biomarkers in latent and active tuberculosis by real-time PCR. Front Immunol. 2020;11:612564. doi:10.3389/fimmu.2020.612564
10. Chai Q, Wang L, Liu CH, Ge B. New insights into the evasion of host innate immunity by mycobacterium tuberculosis. Cell Mol Immunol. 2020;17(9):901–913. doi:10.1038/s41423-020-0502-z
11. Ravesloot-Chávez MM, Van Dis E, Stanley SA. The innate immune response to mycobacterium tuberculosis infection. Ann Rev Immunol. 2021;39:611–637. doi:10.1146/annurev-immunol-093019-010426
12. McClean CM, Tobin DM. Macrophage form, function, and phenotype in mycobacterial infection: lessons from tuberculosis and other diseases. Pathog Dis. 2016;74(7):ftw068. doi:10.1093/femspd/ftw068
13. Sia JK, Rengarajan J. Immunology of mycobacterium tuberculosis infections. Microbiology Spectrum. 2019;7(4). doi:10.1128/microbiolspec.GPP3-0022-2018
14. Liu CH, Liu H, Ge B. Innate immunity in tuberculosis: host defense vs pathogen evasion. Cell Mol Immunol. 2017;14(12):963–975. doi:10.1038/cmi.2017.88
15. Sia JK, Georgieva M, Rengarajan J. innate immune defenses in human tuberculosis: An overview of the interactions between mycobacterium tuberculosis and innate immune cells. J Immunol Res. 2015;2015:747543. doi:10.1155/2015/747543
16. Sallin MA, Kauffman KD, Riou C, et al. Host resistance to pulmonary mycobacterium tuberculosis infection requires CD153 expression. Nature Microbiology. 2018;3(11):1198–1205. doi:10.1038/s41564-018-0231-6
17. Dabla A, Liang YC, Rajabalee N, et al. TREM2 promotes immune evasion by mycobacterium tuberculosis in human macrophages. mBio. 2022;13(4):e0145622. doi:10.1128/mbio.01456-22
18. Leu JS, Chen ML, Chang SY, et al. SP110b controls host immunity and susceptibility to tuberculosis. Am J Respir Crit Care Med. 2017;195(3):369–382. doi:10.1164/rccm.201601-0103OC
19. Pai M, Denkinger CM, Kik SV, et al. Gamma interferon release assays for detection of mycobacterium tuberculosis infection. Clin Microbiol Rev. 2014;27(1):3–20. doi:10.1128/CMR.00034-13
20. Wynn TA, Chawla A, Pollard JW. Macrophage biology in development, homeostasis and disease. Nature. 2013;496(7446):445–455. doi:10.1038/nature12034
21. Fraternale A, Brundu S, Magnani M. Polarization and repolarization of macrophages. J Clin Cell Immunol. 2015;6:2.
22. Ahmad F, Rani A, Alam A, et al. Macrophage: a cell with many faces and functions in tuberculosis. Front Immunol. 2022;13:747799. doi:10.3389/fimmu.2022.747799
23. Khan A, Singh VK, Hunter RL, Jagannath C. Macrophage heterogeneity and plasticity in tuberculosis. J Leukocyte Bio. 2019;106(2):275–282. doi:10.1002/JLB.MR0318-095RR
24. Hmama Z, Peña-Díaz S, Joseph S, Av-Gay Y. Immunoevasion and immunosuppression of the macrophage by mycobacterium tuberculosis. Immunol Rev. 2015;264(1):220–232. doi:10.1111/imr.12268
25. Roca FJ, Whitworth LJ, Redmond S, Jones AA, Ramakrishnan L. TNF induces pathogenic programmed macrophage necrosis in tuberculosis through a mitochondrial-lysosomal-endoplasmic reticulum circuit. Cell. 2019;178(6):1344–1361.e1311. doi:10.1016/j.cell.2019.08.004
26. Zhang L, Jiang X, Pfau D, Ling Y, Nathan CF. Type I interferon signaling mediates mycobacterium tuberculosis-induced macrophage death. J Exp Med. 2021;1(2):218.
27. Erick TK, Brossay L. Phenotype and functions of conventional and non-conventional NK cells. Current Opinion Immuno. 2016;38:67–74. doi:10.1016/j.coi.2015.11.007
28. Li S, Wang D, Wei P, et al. Elevated natural killer cell-mediated cytotoxicity is associated with cavity formation in pulmonary tuberculosis patients. J Immunol Res. 2021;2021:7925903. doi:10.1155/2021/7925903
29. Cai Y, Dai Y, Wang Y, et al. Single-cell transcriptomics of blood reveals a natural killer cell subset depletion in tuberculosis. EBioMedicine. 2020;53:102686. doi:10.1016/j.ebiom.2020.102686
30. Chen Y, Graf L, Chen T, et al. Rare variant MX1 alleles increase human susceptibility to zoonotic H7N9 influenza virus. Science. 2021;373(6557):918–922. doi:10.1126/science.abg5953
31. Spitaels J, Van Hoecke L, Roose K, Kochs G, Saelens X, Dermody TS. Mx1 in hematopoietic cells protects against thogoto virus infection. J Virol. 2019;93(15). doi:10.1128/JVI.00193-19
32. Jung HE, Oh JE, Lee HK. Cell-penetrating mx1 enhances anti-viral resistance against mucosal influenza viral infection. Viruses. 2019;11(2):109. doi:10.3390/v11020109
33. Yi F, Hu J, Zhu X, et al. Transcriptional profiling of human peripheral blood mononuclear cells stimulated by mycobacterium tuberculosis PPE57 identifies characteristic genes associated with type I interferon signaling. Front Cell Infect Microbiol. 2021;11:716809. doi:10.3389/fcimb.2021.716809
34. Zhang S, Chu C, Wu Z, et al. IFIH1 contributes to M1 macrophage polarization in ARDS. Front Immunol. 2021;11:580838. doi:10.3389/fimmu.2020.580838
35. Casanova JL, Holland SM, Notarangelo LD. Inborn errors of human JAKs and STATs. Immunity. 2012;36(4):515–528. doi:10.1016/j.immuni.2012.03.016
36. Ma Y, Zhang Y, Li R, Wang X, Wang A. Cutaneous tuberculosis in a patient with a STAT1 mutation. J Der Deutsch Dermatol Gesellsch. 2021;19(11):1647–1649.
37. Yi XH, Zhang B, Fu YR, Yi ZJ. STAT1 and its related molecules as potential biomarkers in Mycobacterium tuberculosis infection. J Cell & Mol Med. 2020;24(5):2866–2878. doi:10.1111/jcmm.14856
38. Yao K, Chen Q, Wu Y, Liu F, Chen X, Zhang Y. Unphosphorylated STAT1 represses apoptosis in macrophages during mycobacteriumtuberculosis infection. J Cell Sci. 2017;130(10):1740–1751. doi:10.1242/jcs.200659
39. Liang T, Chen J, Xu G, et al. STAT1 and CXCL10 involve in M1 macrophage polarization that may affect osteolysis and bone remodeling in extrapulmonary tuberculosis. Gene. 2022;809:146040. doi:10.1016/j.gene.2021.146040
40. Lee S, Zhang Y, Newhams M, et al. DDX58 is associated with susceptibility to severe influenza virus infection in children and adolescents. J Infect Dis. 2022;226(11):2030–2036.
41. Zhang YW, Lin Y, Yu HY, Tian RN, Li F. Characteristic genes in THP‑1 derived macrophages infected with mycobacterium tuberculosis H37Rv strain identified by integrating bioinformatics methods. IntJ Mol Med. 2019;44(4):1243–1254. doi:10.3892/ijmm.2019.4293
42. Cheng Y, Schorey JS. Mycobacterium tuberculosis-induced IFN-β production requires cytosolic DNA and RNA sensing pathways. J Exp Med. 2018;215(11):2919–2935. doi:10.1084/jem.20180508
43. Cheng Y, Schorey JS. Extracellular vesicles deliver mycobacterium RNA to promote host immunity and bacterial killing. EMBO Reports Mar. 2019;20(3):e46613.
44. Zhang Z, Mai Q, Yang L, et al. MicroRNA-31 mediated by interferon regulatory factor 7 signaling facilitates control of mycobacterium tuberculosis infection. Intl j med microbio. 2022;312(7):151569. doi:10.1016/j.ijmm.2022.151569
45. Cubillos-Angulo JM, Arriaga MB, Melo MGM, et al. Polymorphisms in interferon pathway genes and risk of mycobacterium tuberculosis infection in contacts of tuberculosis cases in Brazil. Int j Infect Dis. 2020;92:21–28. doi:10.1016/j.ijid.2019.12.013
 © 2024 The Author(s). This work is published and licensed by Dove Medical Press Limited. The full terms of this license are available at https://www.dovepress.com/terms.php and incorporate the Creative Commons Attribution - Non Commercial (unported, v3.0) License.
By accessing the work you hereby accept the Terms. Non-commercial uses of the work are permitted without any further permission from Dove Medical Press Limited, provided the work is properly attributed. For permission for commercial use of this work, please see paragraphs 4.2 and 5 of our Terms.
© 2024 The Author(s). This work is published and licensed by Dove Medical Press Limited. The full terms of this license are available at https://www.dovepress.com/terms.php and incorporate the Creative Commons Attribution - Non Commercial (unported, v3.0) License.
By accessing the work you hereby accept the Terms. Non-commercial uses of the work are permitted without any further permission from Dove Medical Press Limited, provided the work is properly attributed. For permission for commercial use of this work, please see paragraphs 4.2 and 5 of our Terms.