")
Back to Journals » Nature and Science of Sleep » Volume 16
Comparison of OPPO Watch Sleep Analyzer and Polysomnography for Obstructive Sleep Apnea Screening
Authors Zhou G, Zhao W, Zhang Y, Zhou W, Yan H, Wei Y, Tang Y, Zeng Z, Cheng H
Received 31 August 2023
Accepted for publication 24 January 2024
Published 8 February 2024 Volume 2024:16 Pages 125—141
DOI https://doi.org/10.2147/NSS.S438065
Checked for plagiarism Yes
Review by Single anonymous peer review
Peer reviewer comments 2
Editor who approved publication: Prof. Dr. Ahmed BaHammam
Guangxin Zhou,1,2 Wei Zhao,2 Yi Zhang,2 Wenli Zhou,2 Haizhou Yan,2 Yongli Wei,1 Yuming Tang,1 Zijing Zeng,2 Hanrong Cheng1
1Department of Sleep Medicine, Institute of Respiratory Diseases, Shenzhen People’s Hospital, The Second Clinical Medical College of Jinan University, The First Affiliated Hospital of Southern University of Science and Technology, Shenzhen, Guangdong, People’s Republic of China; 2OPPO Health, Guangdong OPPO Mobile Telecommunications Co. Ltd., Shenzhen, Guangdong, People’s Republic of China
Correspondence: Hanrong Cheng, Department of Sleep Medicine, Shenzhen People’s Hospital, The Second Clinical Medical College of Jinan University, The First Affiliated Hospital of Southern University of Science and Technology, Shenzhen, Guangdong, People’s Republic of China, Email [email protected]
Objective: To evaluate the clinical performance of the OPPO Watch (OW) Sleep Analyzer (OWSA) on OSA screening with polysomnography reference.
Methods: We recruited 350 participants using OWSA and PSG simultaneously in a sleep laboratory. The respiratory event index (REI) derived from OWSA and the apnea-hypopnea index (AHI) provided by PSG were compared. SHapley Additive exPlanation (SHAP) values were calculated to explain the model of OWSA.
Results: The OWSA-REI (26.5± 18.5 events/h) correlated well with PSG-AHI (33.2± 25.7 events/h; r = 0.91, p < 0.001), with an intraclass correlation coefficient (ICC) of 0.83. Using a threshold of AHI ≥ 15 events/h, the sensitivity, specificity, accuracy, and area under the curve (AUC) were 86.1%, 86.7%, 86.3%, and 0.94, respectively. Bland-Altman analysis showed that OWSA-REI and PSG-AHI were in good agreement (Mean Difference: − 6.7, 95% CI:16.0 to − 29.3 events/h). In addition, the effectiveness of the models in OWSA were also explained by visualizing SHAP values.
Conclusion: The OWSA demonstrated a reasonable performance for OSA screening in the clinical setting. In light of this, it is possible for smartwatches to become a complementary tool to PSG, which is particularly useful for larger-scale preliminary screenings.
Plain Language Summary: OPPO Watch Sleep Analyzer (OWSA), an emerging sleep-tracking method based on a wearable device, uses a machine learning model to analyze physiological signals including snoring recordings, and other basic anthropometric information to estimate REI. The study evaluated the OSA screening performance of OWSA with PSG-AHI and interpreted the results of the pre-trained machine learning model.
OWSA demonstrated consistent clinical diagnostic performance for OSA. The interpretive machine learning models used in OWSA highlighted the impact of multi-modal data on estimation results. Therefore, these types of models are likely to be more widely accepted and promoted in clinical practice.
Keywords: obstructive sleep apnea, photoplethysmography, polysomnography, smartwatch
Introduction
Sleep is a critical part of daily life and plays an essential role in our immune, cardiovascular, and neurocognitive systems.1 Sleep quality can be affected by lifestyles, mental health conditions, and many pathophysiological conditions, such as restless legs syndrome, sleep apnea-hypopnea syndrome (SAHS), and Cheyne-Stokes breathing. Among these, SAHS is a risk factor for other chronic conditions, such as hypertension, diabetes, and stroke, and it is also associated with sudden death and road traffic accidents.2 Obstructive Sleep Apnea (OSA) is the most common type of SAHS, accounting for more than 80% of cases. There are currently 936 million adults aged 30 to 69 years worldwide with mild to severe OSA and 425 million adults aged 30 to 69 years with moderate to severe OSA.3 China has 176 million people affected by OSA, which is the highest number compared to the world’s average.3
OSA severely affects sleep, as the main symptoms of OSA are loud snoring, mouth breathing, easy waking up, etc. The gold standard for the diagnosis of OSA is overnight in-lab polysomnography (PSG), which monitors electroencephalogram (EEG), electrooculography (EOG), electromyography (EMG), electrocardiogram (ECG), nasal pressure, airflow (AF), the respiratory effort of chest and abdomen, snoring, etc. Moreover, there are many issues with the widely-adopted PSG. For example, wearing complicated PSG makes participants difficult to fall asleep, and the cost of PSG is relatively high for families with low to ordinary income. Furthermore, the data collected during a whole night PSG test needs to be scored by trained technicians according to the American Academy of Sleep Medicine (AASM) standards. The consistency of PSG event annotations by two different scorers was only 71% on average.4 Thus, these economic and operator-dependent factors affect the PSG usage and evaluation of results. On the other hand, a single test of PSG in the sleep laboratory could be impacted by many factors, and the severity of OSA may vary daily.5 Therefore, continuous monitoring for multiple days, such as using wearable devices, is desirable in evaluating the severity of OSA. In short, PSG is the gold standard, but it is not suitable for large-scale population screening.
In recent years, the rise of wearable devices, such as the smartwatch, provides a new way of monitoring physiological signals continuously and ubiquitously. Many smartwatches clarify they can evaluate the risk of OSA, in order to find out the performance and value of these wearable devices, we conduct this study on one of these. We choose OPPO watch (OW, Guangdong OPPO Mobile Telecommunications Co. Ltd., Dongguan, China),6 a smartwatch with PPG and accelerometer, which is the first device to calculate REI using physiological signals, snoring recording, and personal information simultaneously.
In this study, we compared the REI estimated by OWSA with AHI derived from PSG to assess the diagnostic performance of OWSA for OSA.
Methods
Study Participants
The study was conducted at Shenzhen People’s Hospital, Shenzhen, China. The Ethics Committee of the Shenzhen People’s Hospital approved this study as LL-KY-2022140-01. 357 participants were initially recruited with suspected sleep apnea from June 1, 2022, to November 15, 2022. This study was conducted in accordance with the Declaration of Helsinki. Adults who had been referred for a PSG test and provided a written informed consent form were offered the opportunity to participate (Figure 1). Individuals were excluded from the study for the following reasons: 1) Under continuous positive airway pressure (CPAP); 2) Respiratory diagnosis of obesity hypoventilation syndrome or chronic obstructive pulmonary disease; 3) Cardiovascular diseases or complexities, such as atrial fibrillation or pacemaker insertion; 4) Diagnosis of other sleep disorders, such as narcolepsy, insomnia (Patients with insomnia cannot calculate AHI by PSG if they do not have adequate sleep duration). All remaining participants signed informed consent forms.
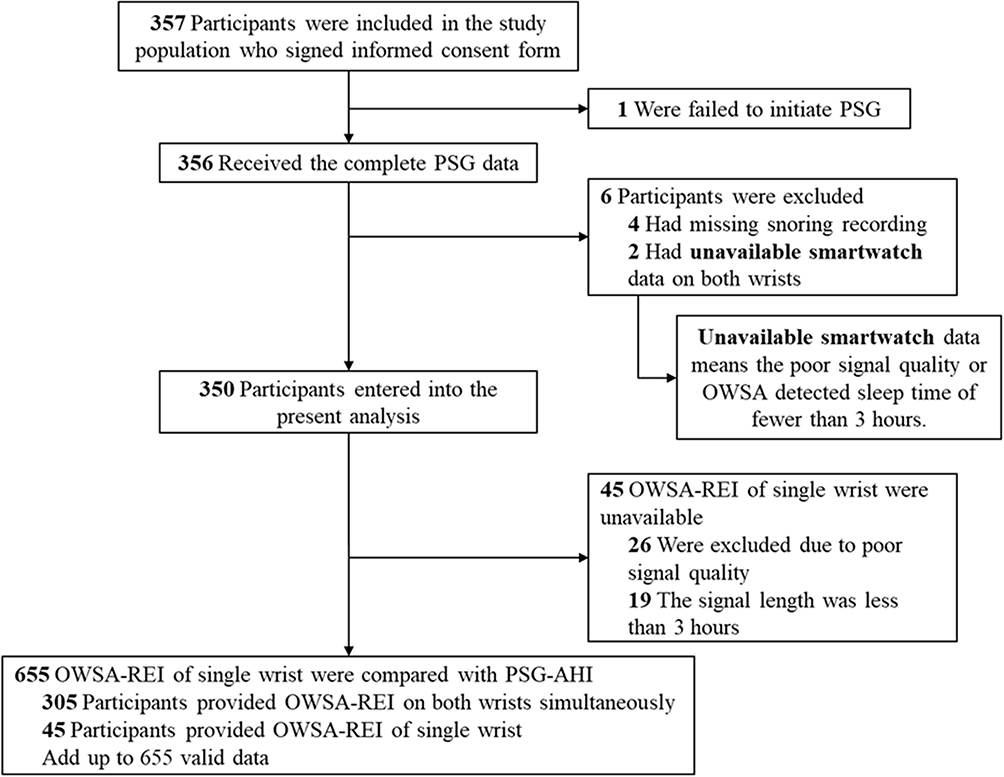 |
Figure 1 Flowchart of participant selection. Abbreviations: REI, respiratory event index; OWSA, OPPO Watch Sleep Analyzer. |
Owsa
OWSA contains a wearable smartwatch and a software part in HeyTap Health App (OPPO Inc.), which can be installed on a smartphone.7 The smartwatch and App communicate via Bluetooth to fuse multi-modal data and estimate REI. Once users fall asleep while wearing the watch, it automatically starts sleep monitoring and calculates sleep stages, pulse rate variability (PRV), respiratory (RESP), and peripheral oxygen saturation (SpO2). And if the phone mic is enabled by the user, snoring could also be monitored and evaluated together with other parameters. Upon waking, the HeyTap Health app’s embedded algorithm calculates the risk of obstructive sleep apnea (OSA) based on the collected data. This approach offers users a comfortable and convenient method for sleep monitoring and OSA risk evaluation within a home environment, potentially serving as a supplementary tool to PSG and related in-hospital devices. A diagram of the OWSA-based OSA diagnosis process is displayed in Figures 2 and 3 shows several signal trends of OWSA during two apnea episodes.
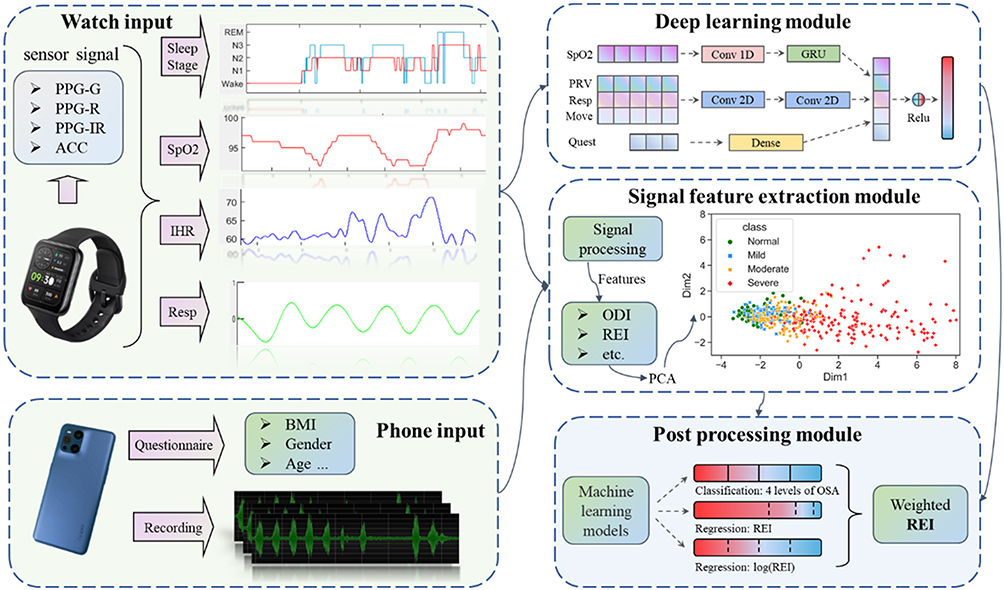 |
Figure 2 Diagram of the OWSA-based OSA diagnosis process. Abbreviations: REI, respiratory event index; ODI, oxygen desaturation index; BMI, body mass index; SpO2, peripheral oxygen saturation; PRV, pulse rate variability; Resp, respiratory; Quest, questionnaire; Conv, convolution; GRU, gate recurrent unit; IHR, instantaneous heart rate; ACC, acceleration; PPG, photoplethysmography; G, green; R, red; IR, infrared; PCA, principal component analysis. |
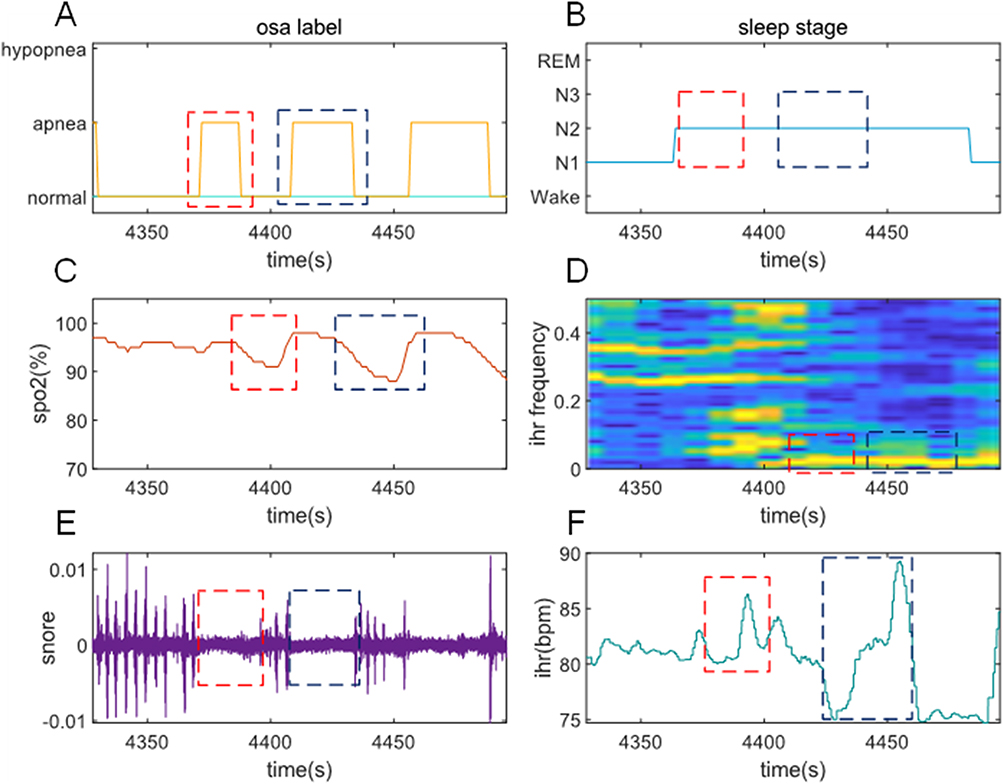 |
Figure 3 An example of signal trends of OWSA during two apnea episodes. The blue box indicates the first apnea, the red box indicates the second apnea. (A) and (B) show the respiratory events and sleep stages derived from PSG. The oxygen saturation curve is derived from OWSA, as shown in (C). The spectrum diagram of instantaneous heart rate is presented in (D) (apneas are characterized at ultra-low frequency). The audio energy diagram is shown in (E). Snoring was interrupted during apnea and resumed after the event. (F) shows the instantaneous heart rate derived from OWSA. The heart rate descends first and then rises during the episode of an apnea event. Abbreviations: IHR, instantaneous heart rate; SpO2, peripheral oxygen saturation; OWSA, OPPO Watch Sleep Analyzer. |
Smartwatch Module
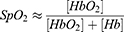
OWSA calculates sleep stages, oxygen saturation, heart rate, and respiratory rate based on PPG and accelerometer signals. Sleep stages and PRV features are calculated by combining accelerometer and green PPG signals, which is more robust for motion artifacts rejection. OWSA uses the aforementioned features to calculate the stage of awake, deep sleep (Corresponding to N3), light sleep (Corresponding to N1 and N2), and rapid eye movement (REM).8 Pulse oxygen saturation is the ratio of oxygenated hemoglobin to total hemoglobin (Equation 1). The OPPO Watch (OW) emits both red light (660nm) and infrared light (940nm), and estimates SpO2 based on the varied absorption rates of oxygenated hemoglobin (HbO2) and deoxygenated hemoglobin (Hb). By using the PPG sensor, it derives the DC component (baseline value) and AC component (amplitude of pulsation) from the signal. According to the Lambert-Beer law, the “r” value is calculated using Equation 2. Subsequently, the corresponding SpO2 value is derived from the “r”-curve, which is calibrated against a specifically accumulated private dataset and does not rely on the dataset used in the manuscript.

And OWSA uses estimated SpO2 to detect oxygen desaturation events.9
OWSA derives respiration components from green light PPG and accelerometer. Respiration-related events are usually accompanied by fluctuations in instantaneous heart rate and low-frequency energy of the spectrum of the RR intervals. These events are usually accompanied by disruption of respiratory signals or decreased respiratory intensity. Pulse rate variability (PRV) could reflect the physiological property of respiration-related events. OWSA uses the aforementioned features to detect apnea-hypopnea events.
Smartphone Module
The HeyTap Health App uses the smartphone microphone to record 8KHz recordings. The App automatically detects snoring events from the original recording and extracts features such as Mel-frequency cepstral coefficients. Snoring is a clinical symptom of OSA, but snoring does not necessarily mean OSA. OWSA calculates the regularity of snoring events and detects snores of post-apnea to estimate the risk of OSA with a machine learning model. OWSA adopts some userinfo (gender, age, and BMI) through App to optimize algorithm performance.
Deep Learning Module
OWSA uses multi-input deep learning architectures with convolutional and recurrent neural networks (CNN and RNN). The model uses the extracted feature sequences to estimate the density of apnea and hypopnea events in a 15-minute window. The longer time window is beneficial to the time series model to make better use of the longer time signal and obtain more accurate results. The window length selection of OPPO Watch (OW) was determined through multiple experiments conducted on training data. From a model design perspective, longer segments are more susceptible to sleep fragmentation, making the results more volatile. Shorter segments result in a smaller receptive field of the model, which is unable to obtain more global features. The model was “locked” and trained in a previously collected dataset and is independent of the dataset used in this study.
Signal Feature Extraction Module
The smartwatch and smartphone modules extract continuous feature sequences during sleep. Continuous feature sequences derive statistical features, such as total sleep time (TST), mean SpO2, heart rate, and snoring frequency. Respiration-related events are detected by oxygen desaturation, decreased respiratory waveform, PRV features consistent with OSA, and irregular snoring intervals. The module estimates REI by summarizing the respiration-related events of a single feature sequence, meanwhile, a more accurate REI can be estimated by cross-validation of different feature sequences. The signal feature extraction module, as represented in Figure 2 displays a scatter plot following feature dimensionality reduction via PCA. Notably, sample points from normal subjects predominantly occupy the left side, whereas severe subjects’ points are primarily on the right. The distinct boundary between various patient categories suggests that the features extracted by the OW have the capability to distinguishOSA patients across various risk levels.
Post-Processing Module
The post-processing module outputs the consolidated results using the extracted features, such as statistical parameters, participant information, preliminary estimated REI, and signal quality. OWSA uses a classification model to categorize participants into normal, mild, moderate, and severe levels. The AHI range of patients with severe OSA is notably wider than that of normal, mild, and moderate patients. Deviation in the predictions generally impacts severe patients less significantly than other subjects. To diminish the influence of severe OSA patients’ deviation which may disproportionately affect the machine learning model, we apply a logarithmic transformation to compress the AHI range of severe OSA. This method permits the model to prioritize predictive performance in lower AHI ranges, thereby reducing the likelihood of false positive OSA diagnoses. OWSA also uses two regression models to estimate REI and log-transformed REI. At the end of processing, the results of the three models are fused according to confidence scores.
Study Procedure
All participants wore OWs on different wrists before PSG testing in order to analyze the performance differences between different wrists. Participants were asked to wear the smartwatch properly and keep the watch band tight. The smartphone paired with the OW is placed 20cm away from the corresponding side pillow for audio recording. Participants were asked not to block the microphone of the smartphone.
PSG testing was conducted according to the AASM standards10 in the Sleep Medicine Center of Shenzhen People’s Hospital. PSG and OWSA data were recorded simultaneously during sleep sessions. Signals recorded by PSG include six electroencephalograms, two electrooculograms, one chin electromyogram, bilateral anterior tibial electromyograms, one electrocardiogram, pulse oximetry, nasal pressure and airflow, the respiratory effort of the chest and abdomen, as well as snoring and body position sensor. Certified polysomnographic technologists scored the signal following the AASM 2018 guidelines. The study used Philips Alice 6 LDE (Philips Healthcare, Inc.) as the PSG device, with Sleepware G3 software platform. Apneas were identified when there was a reduction in airflow at least 90% from baseline for at least 10 seconds on the oronasal thermistor signal. Hypopneas were defined as a reduction in a respiratory signal at least 30% for at least 10 seconds, accompanied by a reduction in oxygen saturation at least 3% or an arousal. Instead of utilizing an automated system for scoring, trained sleep technicians manually evaluated the PSG data.
In addition, data sets with PSG’s total sleep time of fewer than 3 hours or OWSA estimated SpO2 available proportion less than 30% (poor signal quality) were excluded from the study. Different studies have different definitions of the minimum effective time.11 Patients with severe OSA cannot obtain adequate sleep duration throughout the night due to sleep fragmentation caused by frequent respiratory events. Short sleep duration also makes the results unreliable. We chose 3 hours as a compromise threshold. PSG scoring technicians were blind to OWSA data.
Model Interpretability
Machine learning models are used with caution in the medical field due to some models’ “black-box” nature. To provide more interpretability to the machine learning models in our study, the Shapley Additive exPlanations (SHAP) method12 (based upon the Shapley value concept from game theory to interpret the machine learning model) is introduced. SHAP calculates each variable’s contribution to the model and summarizes them into a visual interpretation.
Statistical Analysis
The statistical analysis was performed using Python version 3.7.4 (Python Software Foundation, Delaware, United States). Values of P < 0.05 was considered significant in all statistical tests. The paired Student’s t-test was performed for normally distributed data to test differences. The correlation coefficient was used to validate the correlation between the OWSA-REI and PSG-AHI. The Bland-Altman plot was drawn to validate the agreement between the OWSA-REI and PSG-AHI. Sensitivity, specificity, accuracy, positive predictive value, and negative predictive value were calculated at the AHI thresholds of 5, 15, and 30 events/h, respectively. We also plotted receiver operator characteristics (ROC) curves to indicate the diagnostic performance of OWSA at different thresholds. Cohen’s kappa coefficient and intraclass correlation coefficient were calculated to assess the agreement between the OWSA-REI and PSG-AHI.
We performed several subgroup analyses to assess the influence of different factors on OWSA-REI. A subgroup was used to compare the differences of OWSA-REI on different wrists. Another subgroup was used to assess the diagnostic performance of the OWSA in the apnea-dominated group and the hypopnea-dominated group.
Results
Demographic and Clinical Data
There are 357 participants enrolled in the study and provided signed informed consent forms, among which, 350 participants completed the study and collected valid data (the complete PSG data and the OWSA data from at least one side of the wrists were obtained). Of the participants, 276 (78.9%) were male, with a mean age of 38.4±9.2 years, a mean BMI of 26.2±5.1 kg/m2, a mean total sleep time (TST) of 415.2±61.0 min, and a mean AHI of 33.2±25.7 events/h. The ambient noise for sleep monitoring is 35 to 38 decibels. There were 25 (7.1%) participants with AHI<5 events/h (normal), 72 (20.6%) participants with 5≤AHI<15 events/h (mild), 94 (26.9%) participants with 15≤AHI<30 events/h (moderate), and 159 (45.4%) participants with AHI≥30 events/h (severe). Table 1 shows the baseline characteristics of participants. The OWs on different wrists were able to estimate OWSA-REI independently. 655 independent single-wrist OWSA-REIs were compared with PSG-AHIs to evaluate the performance of OWSA to screen OSA. 305 participants who provided complete OW data from different wrists to analyze the difference between the left and right wrists, as shown in Figure 1.
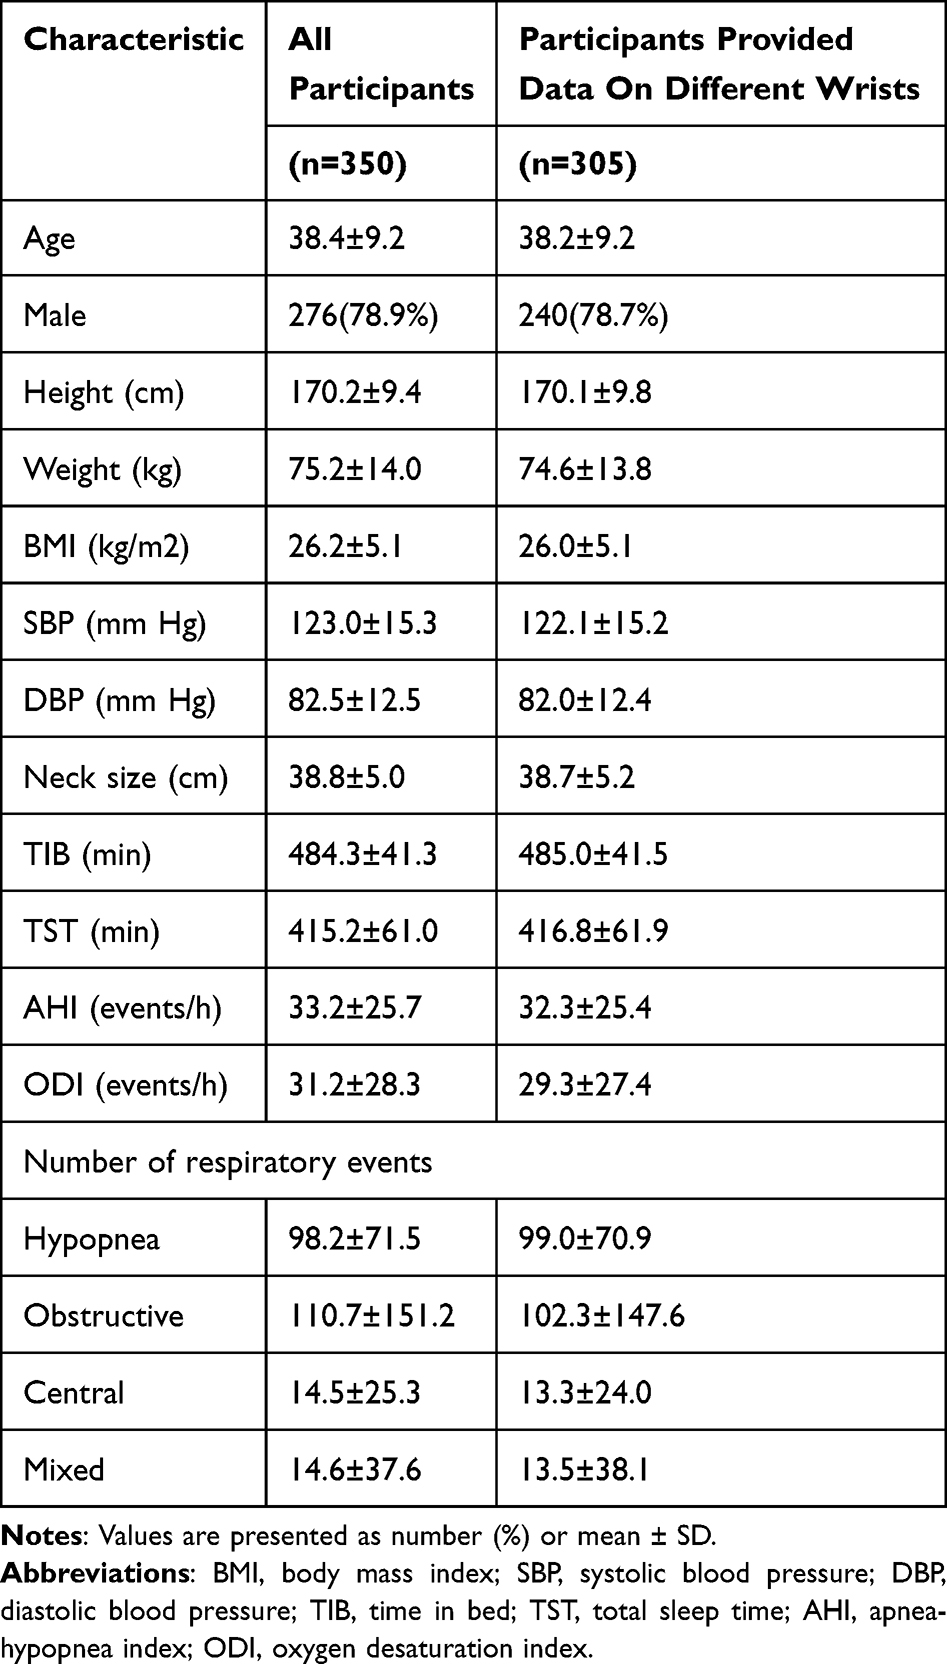 |
Table 1 Baseline Characteristics of Participants |
Correlation and Agreement Between OWSA and PSG
The OWSA-REI correlated well with the PSG-AHI (r = 0.91, P < 0.001), as shown in Figure 4A. The Bland-Altman plot indicating the difference between OWSA-REI and PSG-AHI is shown in Figure 4B. The mean difference between OWSA-REI and PSG-AHI of −6.7, and the limits of agreement range from −29.3 to 16.0 events/h.
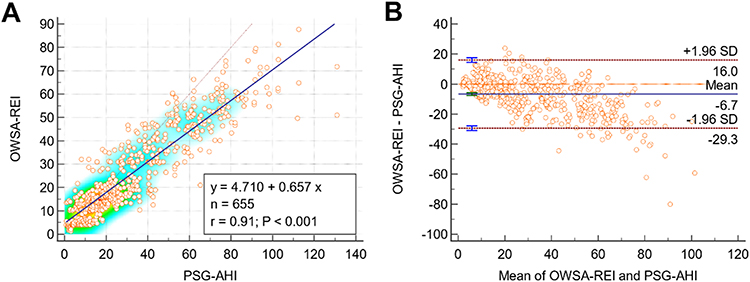 |
Figure 4 (A) Comparison of OWSA-REI and PSG-AHI. Scatterplot and linear regression of OWSA-REI and PSG-AHI. There was a significant correlation between both meas-urements; (B) Bland-Altman Plot of OWSA-REI and PSG-AHI. The horizontal coordinate of the Bland-Altman Plot is the mean of the OWSA-REI and PSG-AHI, and the vertical coordinate is the differ- ence between them. Each dot represents a participant, the solid blue line represents the mean difference of OWSA-REI minus the mean difference of PSG-AHI, and the upper and lower red dashed lines represent the 95% confidence interval for the mean difference, which indicates very good agreement between the two detection methods when the difference lies within the 95% confidence interval. Abbreviations: REI, respiratory event index; SD, standard deviation; OWSA, OPPO Watch Sleep Analyzer. |
Diagnostic Efficiency of OWSA
Figure 5 shows the receiver operator curve at three different AHI thresholds of 5, 15, and 30 events/h. Moreover, sensitivity, specificity, accuracy, positive predictive value, negative predictive value, positive likelihood ratio, negative likelihood ratio, the area under the receiver operator curve, Cohen’s kappa coefficient, and intraclass correlation coefficient for different AHI thresholds are listed in Table 2. Using a threshold of OWSA-REI ≥5 events/h, OWSA had a 95.4% sensitivity and a 75.5% specificity, which provides a strong potential of screening positive patients of OSA. The results showed high consistency between OWSA-REI and PSG-AHI, with an ICC of 0.83 (95% confidence interval, 0.80 to 0.85). Table 3 shows the confusion matrix of the OSA severity classes. Most misclassifications were off by one class (96.4%), and 7(3.6%) were off by two classes. No misclassification was off by three classes.
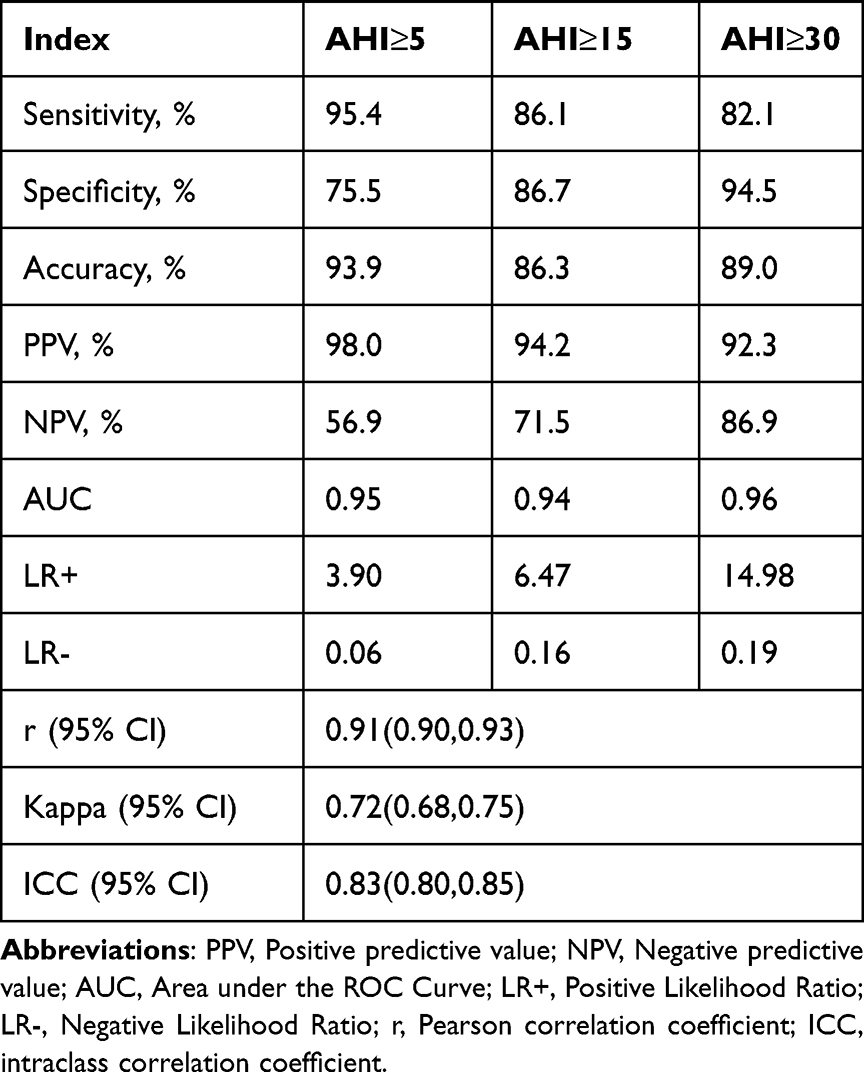 |
Table 2 Diagnostic Performance of the OWSA Compared to PSG |
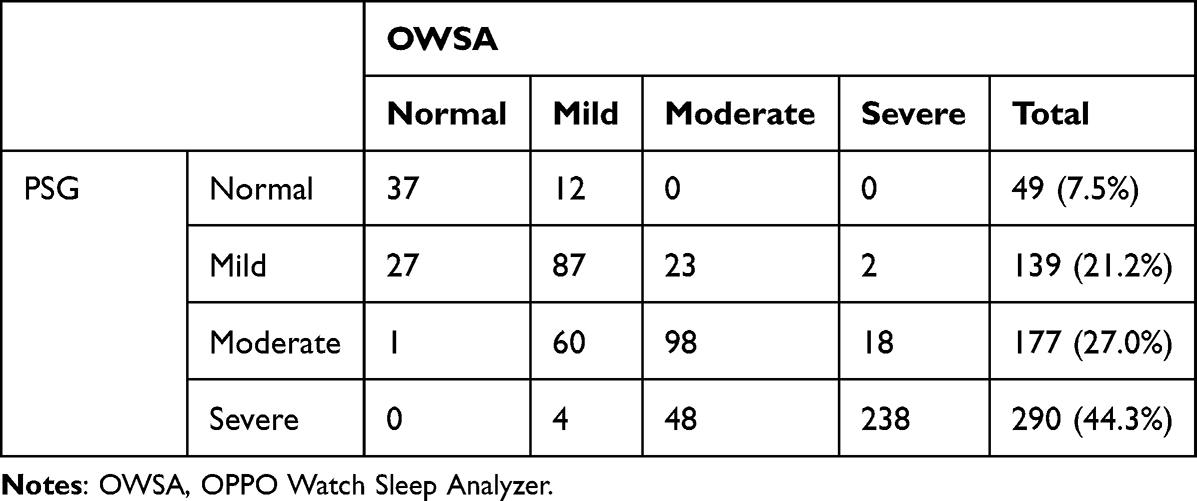 |
Table 3 Confusion Matrix for 4 Classes |
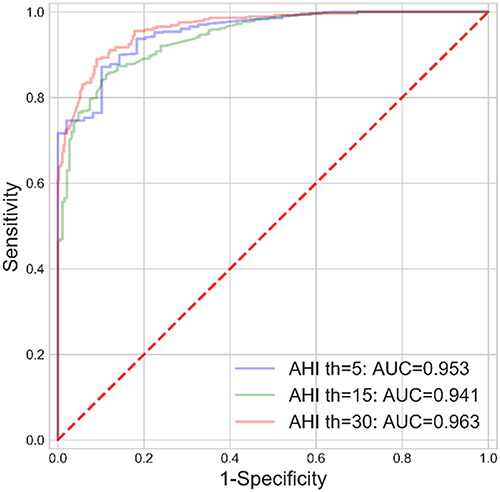 |
Figure 5 ROC curves of the OWSA. Abbreviations: AUC, Area under the ROC Curve; OWSA, OPPO Watch Sleep Analyzer. |
Using a threshold of OWSA-REI ≥15 events/h, OWSA had a sensitivity of 86.6% and specificity of 86.6% in the male group, much higher than 82.5% and 86.0% in the female group. The correlation between OWSA-REI and PSG-AHI was 0.91 in the male group, which was better than 0.88 in the female group. Using 50 years as the threshold to divide the subsets to younger and older, the diagnostic performance of the two subsets was equivalent, and the correlation between the OWSA-REI and the PSG-AHI was 0.91 for both subsets.
Comparison Agreement Between Different Wrists
The Bland-Altman plot indicating the difference between L-REI and R-REI is shown in Figure 6A. The violin plot shows that the distribution of the REI on different wrists is consistent, as shown in Figure 6B. With ICC of 0.941 (95% CI: 0.927 to 0.953), the REI calculated by OWSA on different wrists shows close agreement.
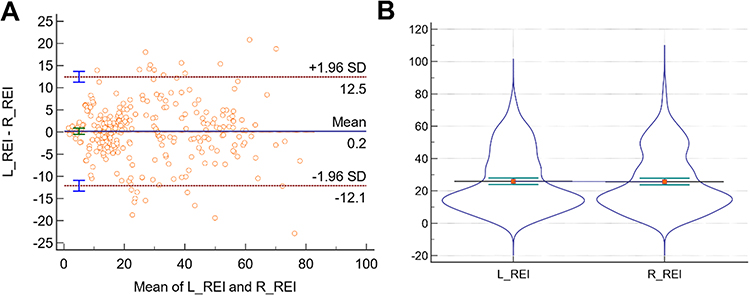 |
Figure 6 Comparison agreement between different wrists.(A) Bland-Altman Plot of L-REI and R-REI. The horizontal coordinate of the Bland-Altman Plot is the mean of the L-REI and R-REI, and the vertical coordinate is the differ- ence between them. Each dot represents a participant, the solid blue line represents the mean difference of L-REI minus the mean difference of R-REI, and the upper and lower red dashed lines represent the 95% confidence interval for the mean difference, which indicates very good agreement between the two detection methods when the difference lies within the 95% confidence interval; (B) Violin Plot of L-REI vs R-REI. Abbreviations: REI, respiratory event index; SD, standard deviation; OWSA, OPPO Watch Sleep Analyzer; L-REI, REI calculated by OWSA on the left wrist; R-REI, REI calculated by OWSA on the right wrist. |
Comparison Correlation Between Apnea and Hypopnea Group
The diagnostic performance of the OWSA between the apnea-dominated group and the hypopnea-dominated group is relatively different. The sensitivity, specificity, accuracy, positive predictive value, negative predictive value, and the area under the receiver operator curve for different AHI thresholds are shown in Table 4. Using a threshold of OWSA-REI ≥15 events/h, OWSA had a sensitivity of 97.3% in the apnea-dominated group, much higher than 75.2% in the hypopnea-dominated group. Similar conclusions can be drawn at other thresholds. Overall, the diagnostic performance of OWSA was better in the apnea-dominated group than in the hypopnea-dominated group, as shown in Table 4.
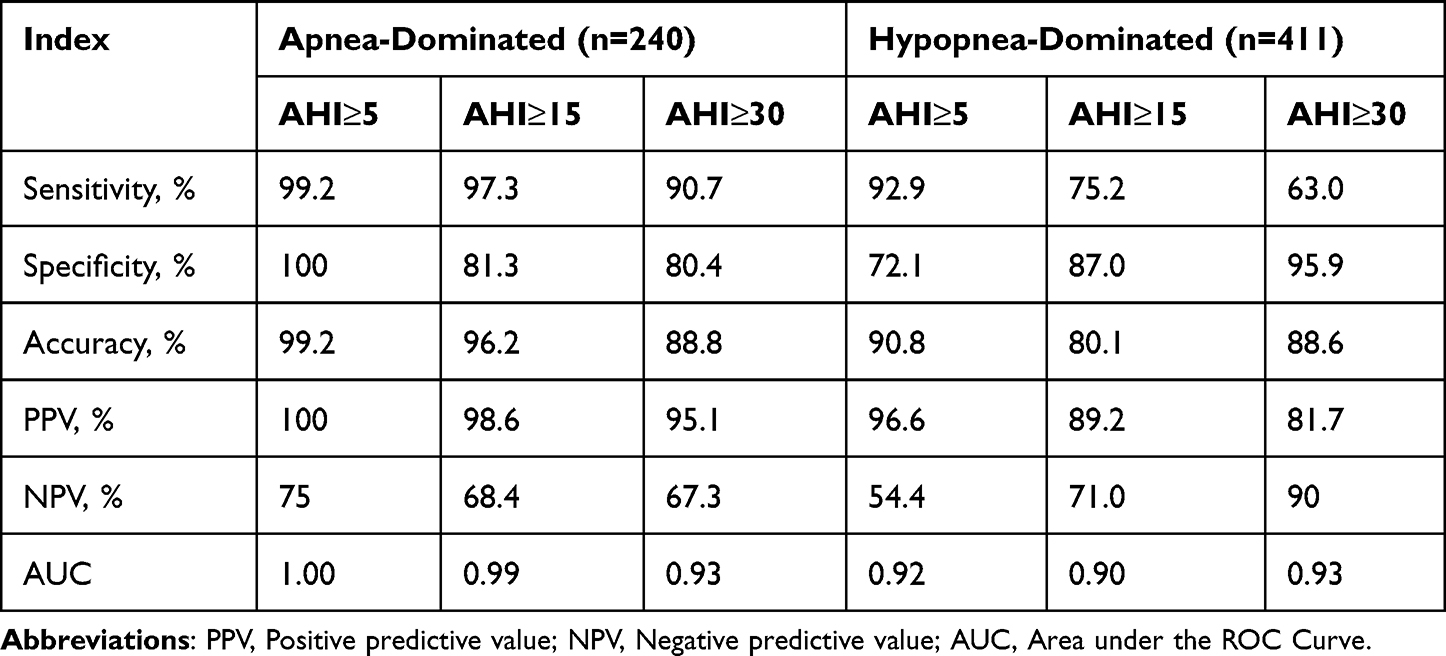 |
Table 4 Diagnostic Performance of the OWSA Between the Apnea-Dominated and Hypopnea-Dominated Groups |
Use SHAP to Interpret the Machine Learning
The contribution of OSA-related features and the correlation between features and AHI were estimated using the SHAP values. The summary scatter plot is shown in Figure 7. Each scatter point represents the SHAP value of a specific feature from a participant. High positive SHAP values drive the model to predict higher REI, and low negative SHAP values drive the model to predict lower REI. SHAP values close to zero indicate that the feature has little effect on the model’s prediction. The color of the scatter point represents the range of feature values. Blue corresponds to a low feature value, and red corresponds to a high one. For example, higher BMI values lead to positive SHAP values and drive model’s predictions for higher REI. The feature importance is ranked according to the average absolute value of SHAP values. The most important feature is the REI calculated by cross-validation of respiration and SpO2. Figure 8 shows dependence plots for the top six features ranking by mean absolute SHAP value. The relationship between feature values and SHAP values indicates how the features impact the model’s predictions. The six features show a positive correlation trend throughout their range of values. Figures 8A and B have the largest range of SHAP values and have the greatest influence on the results. Although all six features were positively correlated with SHAP values, their trends were quite different. Such as BMI in Figure 8E, the variation was close to linear in the range of 20 to 30. Meanwhile, the effect of BMI on SHAP values became slow when the values were above 30 and below 20.
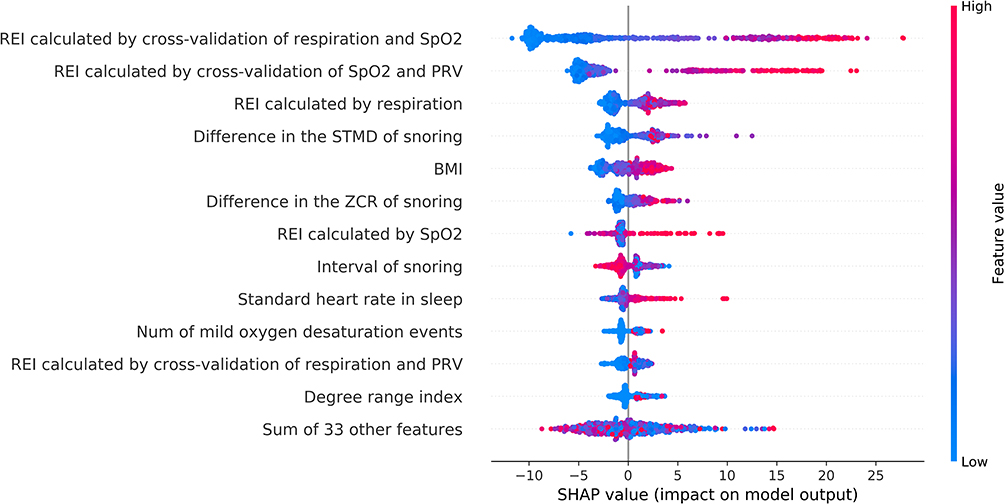 |
Figure 7 SHAP summary plot, ranked by mean absolute SHAP value Among the top 12 critical features, the interval of snoring was the only feature negatively correlated with SHAP values. It means that lower intervals of snoring lead to positive SHAP values and drive the model’s predictions for higher REI. The REI calculated by cross-validation of respiration and SpO2 contributed the most to the REI predicted by the model. The relationship between features and the model’s predictions is consistent with clinical experience. Abbreviations: SHAP, SHapley Additive exPlanation; REI, respiratory event index; SpO2, peripheral oxygen saturation; PRV, pulse rate variability; STMD, short time mean difference; BMI, body mass index; ZCR, zero-crossing rate. |
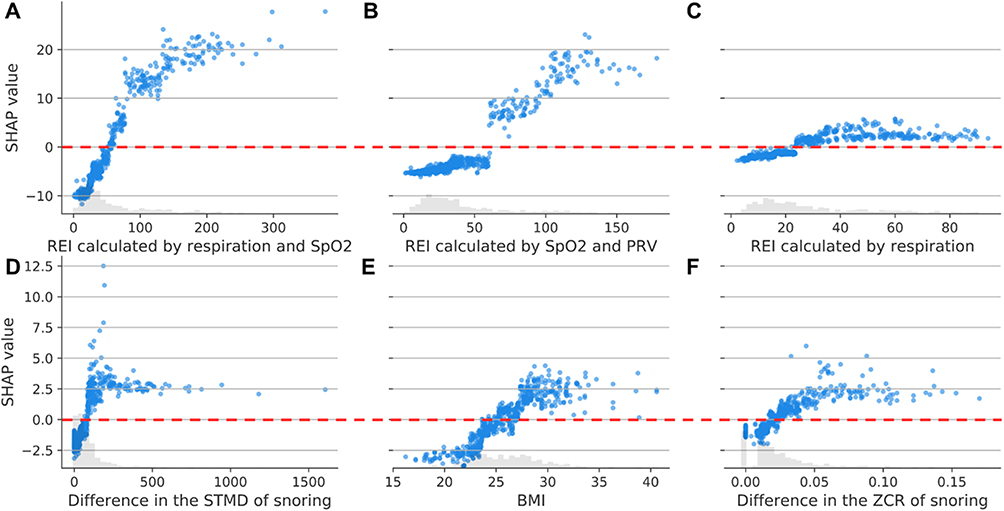 |
Figure 8 Dependence plots for the top six most important features, determined by mean absolute SHAP value (A) Dependence plots for REI calculated by respiration and SpO2; (B) Dependence plots for REI calculated by SpO2 and PRV; (C) Dependence plots for REI calculated by respiration; (D) Dependence plots for difference in the STMD of snoring; (E) Dependence plots for BMI; (F) Dependence plots for Difference in the ZCR of snoring. The figure illustrates the positive correlation between the six features and the SHAP value. The relation between feature values and SHAP values provides insight into how the features influence the model’s predictions. (A) depicts a more continuous and stable SHAP influence curve compared to (B). In (A), the SHAP range is narrower than in (B), suggesting that the REI calculated via respiration and SpO2 has a more significant impact on the results than the REI reckoned solely by respiration. The influence of (D–F) on the results is similar and weaker than that of A and B. Abbreviations: REI, respiratory event index; SpO2, peripheral oxygen saturation; PRV, pulse rate variability; STMD, short time mean difference; BMI, body mass index; ZCR, zero-crossing rate. |
Discussion
This pilot study evaluated the OSA screening performance of a smartwatch, the OPPO Watch, by comparing it with the clinical grade PSG system. The main findings were that the OWSA provided well performance for OSA screening in clinical samples. OWSA-REI and PSG-AHI showed a good correlation and statistical agreement. Moreover, high correlations between OWSA-REI calculated by the OWs on different wrists imply that the user can wear OW on either wrist without affecting the OWSA performance. Using a threshold of OWSA-REI ≥15 events/h, the OWSA reached 86.1% sensitivity, 86.7% specificity, and 0.94 AUC. The SHAP values explain the relationship between features and model predictions. The explainable machine learning model demonstrates that OWSA effectively utilizes multi-modal physiological signals to estimate REI.
Effect of Snore
Snoring is a risk factor for OSA, but snoring is not synonymous with OSA. The interval and decibel level of a normal participant’s snoring is usually steady. The snoring is interrupted or decreased in volume during OSA-related event, and is accompanied by awakening or louder snoring after event. The irregular snoring can be used to assess the severity of OSA. OWSA calculated the num of irregular snoring and estimated the REI. Moreover, OWSA extracts various features of snoring for the ML model. According to SHAP trends in Figure 8D and F. snore-related features significantly contributed to REI estimated by OWSA.
The challenges of using snoring in OWSA are as follows: 1) To distinguish snoring from ambient noise (such as vehicles, air conditioners, animals, etc.); 2) Recall ratio and accuracy of snoring identification, which determines the accuracy of the snoring interval; 3) The difference between shortness of breath and snoring; 4) To distinguish snores from sleep partners or roommates; 5) To ensure the microphone of the smartphone is not covered. The fourth and fifth problems can be avoided in the sleep lab. Further research is needed to address other challenges.
Effect of Anthropometric Information
OWSA selected objective anthropometric information characteristics, such as gender, age, and BMI, to optimize algorithm performance. Many of these characteristics affect OSA diagnosis. Fat is more likely to be concentrated in the upper respiratory tract of men than in women.13 Moreover, men have a longer respiratory tract than women, which leads to a higher risk of OSA.14 Another important factor is obesity, which affects the structure of the respiratory airway and is more likely to cause OSA.15 The elderly may experience shortness of breath due to worsening lung function. The loss of respiratory collagen in the elderly will also cause the collapse of the respiratory tract, which poses an increased risk of OSA.16
Anthropometric information is often used in other studies for simple screening before sleep tests, which limits its use. OWSA uses ML to merge anthropometric information with physiological signals to reach more accurate conclusions. It can be seen from Figure 8E that it significantly contributes to REI estimated by OWSA.
Effect of Model Interpretability
The SHAP values reveal not just the importance of OSA-related features in the model but also how the features impact the model’s predictions. Most features have impact on the model’s predictions, such as REI calculated by signal (respiration, PRV, and SpO2), snoring-related features, and BMI. The level of influence is consistent with clinical knowledge and physiology. For example, higher BMI or standard heart rate in sleep drives the model to output higher REI. The REIs calculated separately for different signals were also positively correlated with the REI output from the model. Therefore, interpretable models avoid the “black-box” problem and are more likely to be accepted in the medical field for potential clinical application.
Effect of Different Wrist
OWSA-REI correlation between different wrists showed a close agreement. The OSA screening results are similar for different wrists if they have the same normal skin condition (no tattoos or scars). The high correlation may be due to respiratory events do not differ significantly in the signals transmitted to different wrists. It implies that the user can wear OW on either left or right wrist without affecting performance.
The results showed that OWSA was slightly less effective at distinguishing mild and normal participants. Poor signal quality greatly affects the REI estimated by OWSA of these participants. On the other hand, moderate and severe participants can be easily distinguished even with slight motion artifacts. The interference factors of the signal are as follows: 1) A tight watch band may impact blood perfusion of the wrist; 2) A loose watch band causes the light leakage of reflective PPG; 3) The venous blood in the wrist may affect the SpO2 estimation when PPG sensor is on top of a vein; 4) The skin conditions may affect the signal quality of reflective PPG, such as skin hair, skin color, scars, tattoos. OWSA assessed signal quality through signal-to-noise ratio (SNR) and calculated the available proportion of the signal. A signal availability proportion below 30% is considered too poor to perform an evaluation.
Effect of the Mechanism of Events
The sensitivity of OWSA in the apnea-dominated group (97.3%) was better than that in the hypopnea-dominated group (75.2%) at the AHI threshold of 15. This is due to the weaker feature changes in hypopnea compared to apnea. From the physiological point of view, the decrease of airflow in hypopnea events is smaller than in apnea, and the decrease in blood oxygen is more gradual than in apnea. This scenario makes hypopnea events more likely to be ignored by OWSA. Eventually, participants dominated by hypopnea events have higher chance to get a lower REI.
Comparison to Other OSA Screening Devices
There are many studies using wearable sensors to screen for OSA. Some studies directly use a subset of signals collected by PSG to estimate REI with a specific algorithm and compare it with PSG-AHI. Lakhan et al17 and Gutierrez -Tobal et al18 used PSG airflow (AF) signals to evaluate OSA risk, and the performance in three different cutoff values was similar to our results showing above. OW employs an indirect method to obtain respiratory signals from the wrist, resulting in signal quality that is inferior to direct collection by PSG. Nevertheless, the comparable screening performance implies that OW holds promise as a potential OSA screening tool. Gutierrez-Tobal et al19 estimated REI using SpO2 from PSG’s finger clip pulse oximeter with transmissive PPG technology. However, screening for OSA using only SpO2 may limit the performance of the study. OW is capable of not only acquiring SpO2 but also additional signals, such as respiratory signals, which contribute to a more effective OSA screening process.
Various studies also estimated REI using ECG patches,20 fingertip oximeters,21 mattresses,22 and contact-free devices.23 Most of them achieved OSA screening performance similar to this study. The watch is usually more convenient and insensitive to continuous monitoring for multiple days without complex environment configuration. Devices such as ECG patches, mattresses, and contact-free devices cannot procure SpO2, which makes the detection of hypopnea events challenging. Fingertip oximeters typically necessitate wearing a wrist watch, an operation that is more complex than using OW. Considering wearing experience and consumer adoption, the watch in this study is more suitable as an OSA screening device.
Among wearable devices, rings are similar to smartwatches and typically use reflective PPG technology. The ring is easier to get a high-quality PPG signal due to less interference from veins and carpal bones. On the other hand, it usually does not have tightness adjustability like a watch, which may affect its screening efficiency. Several papers have studied the OSA screening performance of rings and smartwatches.11,24–26 Gu et al24 utilized the Ring to screen for OSA, but their study only validated 50 patients with a mean age of 54.9 years. In contrast, our study evaluated 350 participants with an average age of 38.4 years, representing a larger and younger cohort than Gu’s. Moreover, Chen et al11 examined the effectiveness of a smartwatch in OSA screening. However, only 20 cases were compared with PSG while the remaining 82 cases were compared with HSAT. This discrepancy may lead to an inaccurate performance assessment. Nevertheless, our study compared all subjects with PSG. Although OWSA has limitations such as using reflective PPG and more motion artifacts, it still achieves high screening performance at different thresholds, as shown in Table 5.
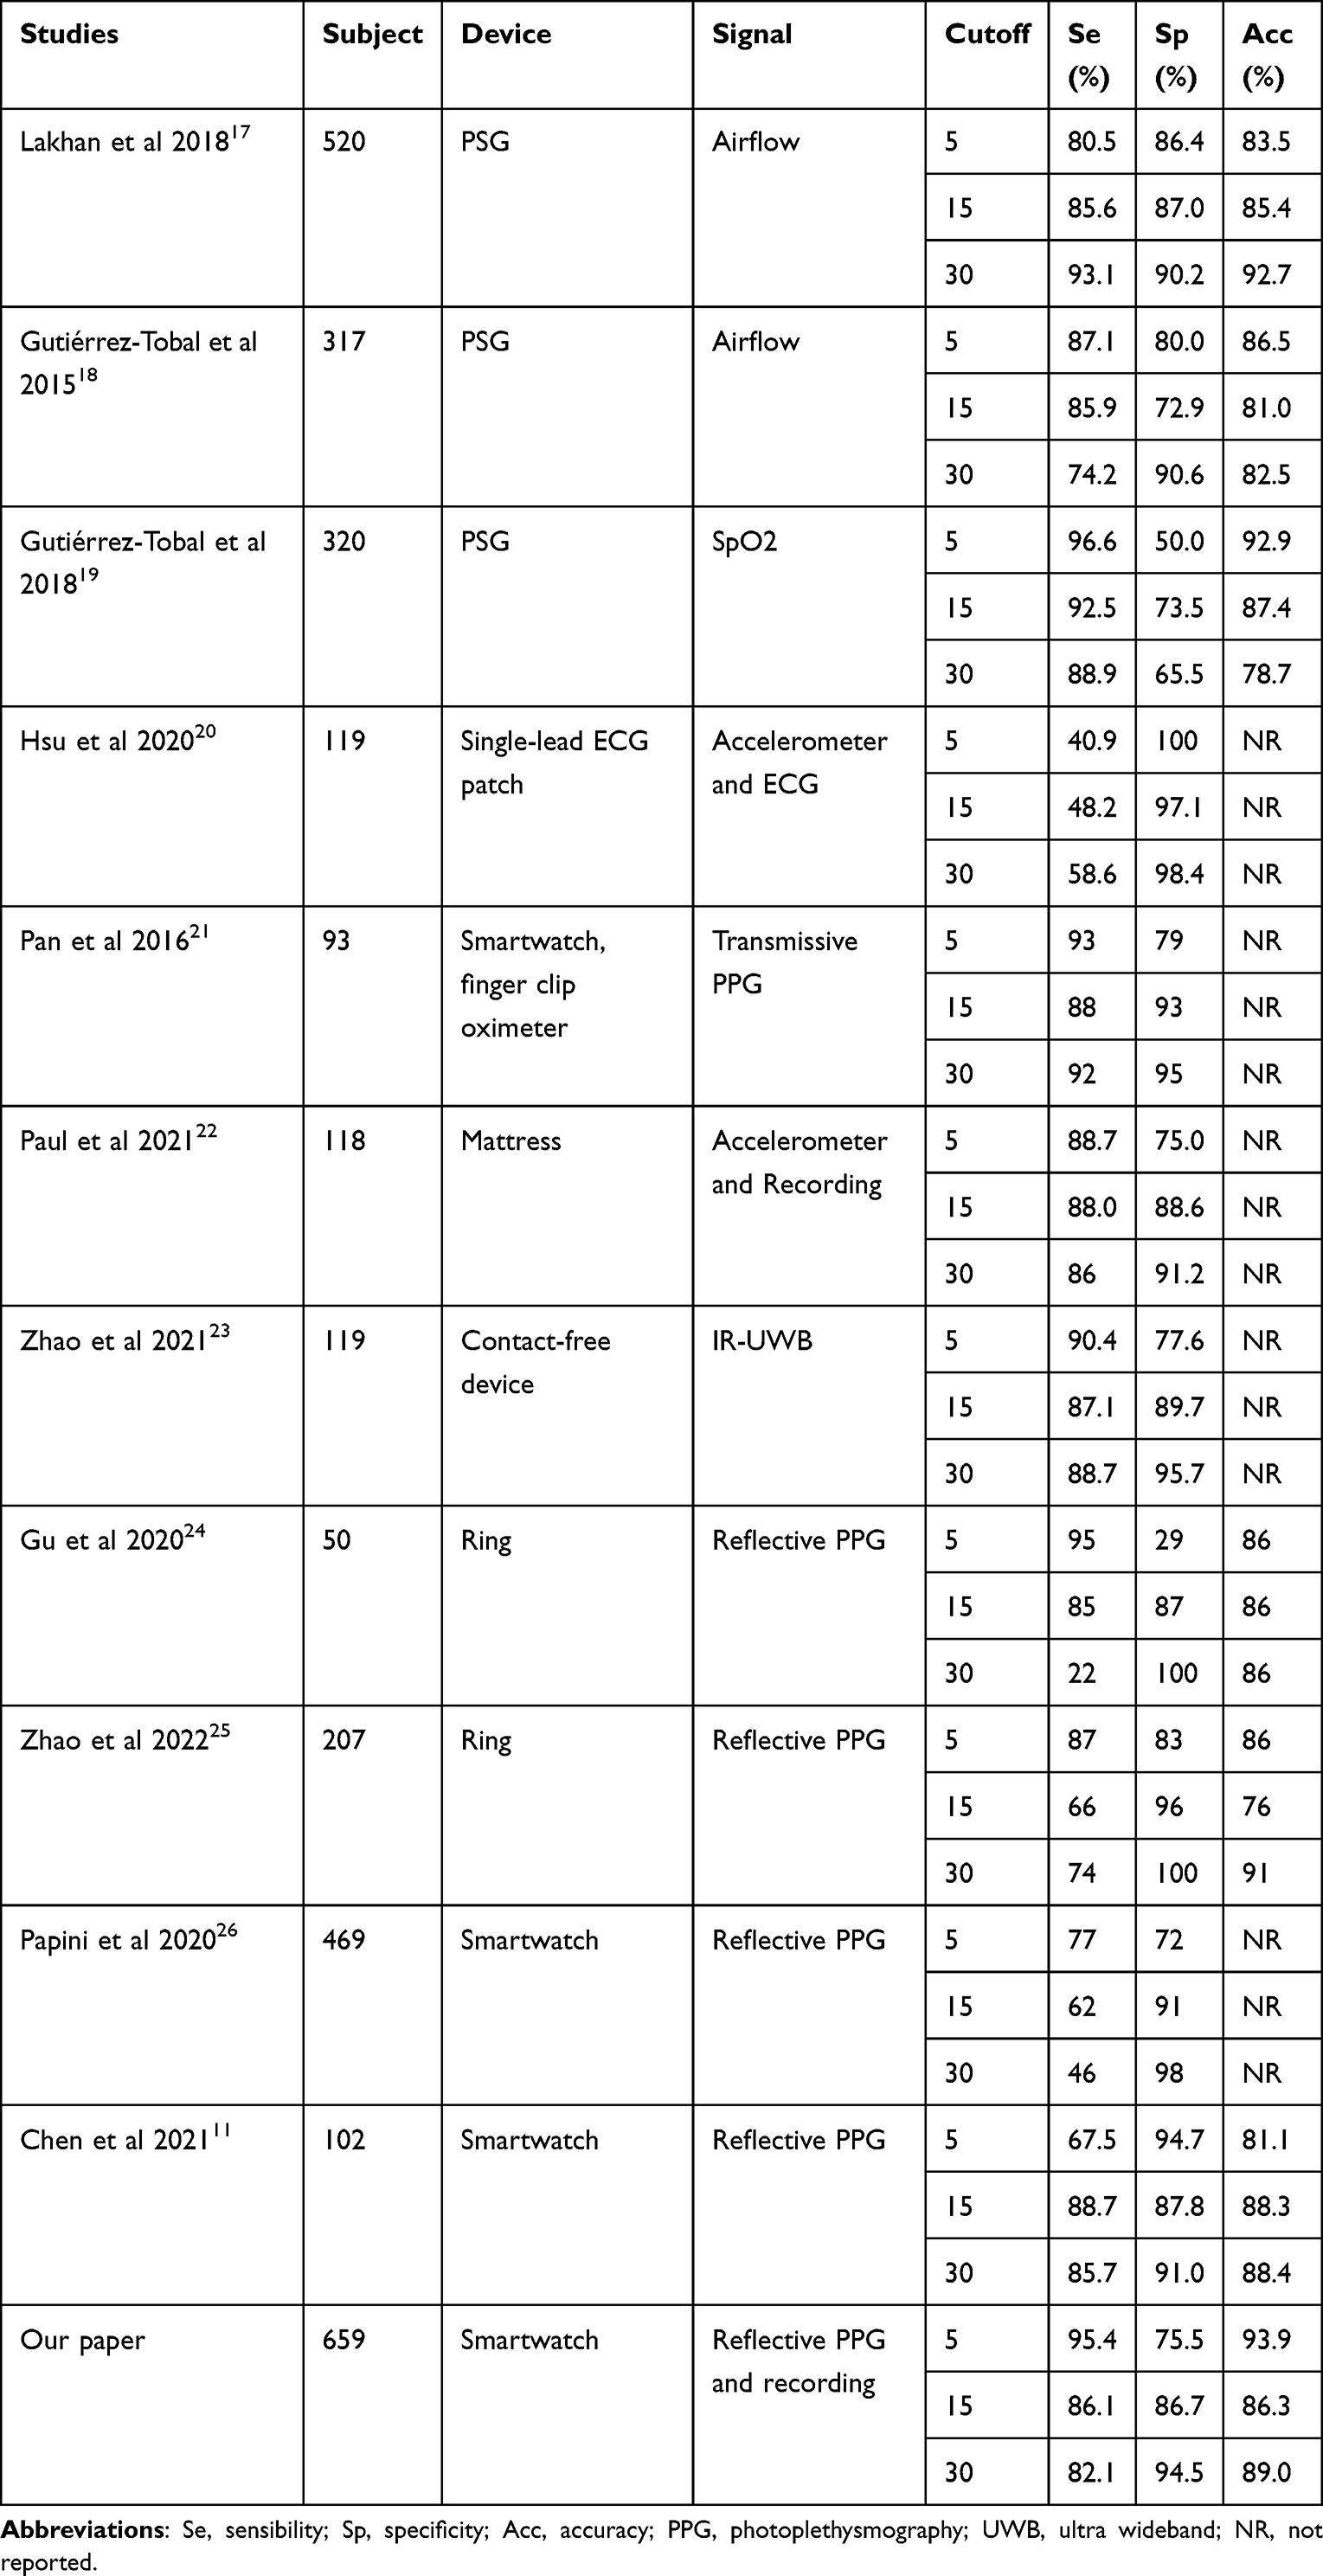 |
Table 5 Comparison of Diagnostic Performance of OSA with the Reference |
Evaluation of Correlation and Bland-Altman Plot
The Bland-Altman plot demonstrates wide Limits of Agreement (LoA), which is comparable to the performance of other wearable devices.22,23,25 This occurs because wearable devices do not directly measure respiratory waveforms and other physiological signals during sleep, like PSG or HSAT, but extract the corresponding signals indirectly through sensors. Such indirectly acquired physiological signals are more prone to interference, leading to a larger fluctuation in the assessed AHI compared to direct methods. OW suggests users wear the device for an extended period, as averaging measurements across multiple nights can reduce the impact of single-measurement fluctuations, thereby mitigating the wide LoA’s effect in the Bland-Altman plot. OW’s accompanying app provides a one-week assessment of risk level, and verifying the clinical performance of this functionality remains a focal point for our future research endeavors.
From both the correlation and the Bland-Altman plot, there appears to be a systematic bias in underestimating AHI as the true AHI increases. With higher AHI, the estimated REI deviates more from the actual AHI, leading to a wider LoA. This bias relates to the device’s minimum window length required to identify respiratory events from signals such as heart rate variability and snoring. Patients with a high AHI often have frequent respiratory events, resulting in fewer identified events compared to the actual count. However, this condition typically affects patients with severe OSA and has a minimal influence on OSA severity screening.
Advantages and Limitations of the Study and OWSA
Smartwatches have significant advantages in screening for OSA due to lower cost, less complexity and more comfortable user experience. Wearing a smartwatch is less likely to disturb sleep. Participants may wear watches in a home environment to avoid the first-night effects of PSG.27 The night-to-night variability of OSA may cause single night PSG testing to be inaccurate. Zhou et al found shifts in the OSA severity category in 77.9% of patients, and the probability of missing moderate OSA was up to 60% in the two-week experiment.28 Maurice et al found that multiple-night tests could increase accuracy in diagnosing moderate OSA.29 The night-to-night variability of OSA may be related to sleeping position and duration of the REM period.30 Smartwatches are comfortable and convenient to wear and suitable for multiple night testing or extended observation period.
OWSA has several limitations. Firstly, being a wrist-worn device, it employs reflective PPG technology, which poses greater challenges in comparison to the finger clip pulse oximeters that utilize transmissive PPG technology.31 Secondly, the signals acquired by OWSA cannot be manually annotated, and there is no possibility of modifying the results manually. Lastly, OWSA does not collect EEG signals, which are essential for achieving accurate sleep stages. It estimates sleep states based on movement and heart rate. Therefore, OWSA may only serve as a complementary tool for PSG in the screening of large populations for OSA.
This study also has several limitations. First, the population of this study was patients with suspected OSA recruited by a sleep clinic, within which the prevalence of OSA was as high as 92.9%. Therefore, the screening performance of OWSA in a community-based population needs to be further evaluated. Second, the study was conducted in a clinical sleep laboratory. Technicians in the sleep lab helped the subjects wear their watches, and no noise around the sleep lab affected snoring monitoring. Thus, the performance of OWSA in an unattended home environment needs to be evaluated. In addition, this study population was mainly Chinese “Han” subjects with low BMI, further evaluation is needed if it is utilized to other populations.
The population of this study may have associated diseases, such as upper airway resistance syndrome (UARS) and periodic leg movements (PLMs). The relaxed inclusion and exclusion criteria help analyze the diagnostic performance of OWSA in real application scenarios. Using a threshold of 5, 66.7% of false alarms by OWSA had UARS. The characteristics of respiratory events in patients with UARS and OSA are similar. Frequent episodes of leg movement also interfere with physiological signals and cause false positives. However, the false alarms by OWSA in patients with other diseases guided them to the hospital for diagnosis, which is helpful to these patients.
Conclusions
This study validated OWSA’s OSA screening performance on a group of subjects with suspected OSA. Upon evaluating the screening performance of all subjects, we discovered that OW exhibits potential for OSA screening. OW demonstrates notably superior performance for the apnea-dominated group compared to the hypopnea-dominated group. Despite the diminished screening performance of OW for subjects in the hypopnea-dominated group, it still remains effective even for moderate to severe patients. OWSA offers an automatic and convenient screening method through wearable user scenarios. OWSA effectively utilizes multi-modal data such as physiological signals, snoring records, and anthropometric information through ML models. The study also uses SHAP values to explain the ML model of OWSA and identifies trends between different features and predicted REI. Using interpretable ML models ensures that OWSA’s predicted results are more consistent with clinical cognition and have greater potential for acceptance in the clinical field. Future studies may focus on evaluating OWSA’s performance in real consumer populations and home sleep environments.
Acknowledgments
This study was a clinical research project of Shenzhen People’s Hospital (Approval No. LL-KY-2022140-01). The study was supported by grants from the Shenzhen Science and Technology Program (No. JCYJ20210324113612032, JCYJ20220530152414032) and Guangdong OPPO Mobile Telecommunications Co. Ltd., Dongguan, China. The sleep analyzers used in this study were provided by OPPO.
Disclosure
Guangxin Zhou, Wei Zhao, Yi Zhang, Wenli Zhou, Haizhou Yan, and Zijing Zeng are employees of OPPO. The remaining authors report no conflicts of interest in this work.
References
1. Kryger MH, Roth T, Dement WC. Principles and Practice of Sleep Medicine E-Book. USA: Elsevier Health Sciences; 2010.
2. Caples SM, Garcia-Touchard A, Somers VK. Sleep-disordered breathing and cardiovascular risk. Sleep. 2007;30(3):291–303. doi:10.1093/sleep/30.3.291
3. Benjafield AV, Ayas NT, Eastwood PR, et al. Estimation of the global prevalence and burden of obstructive sleep apnoea: a literature-based analysis. Lancet Respir Med. 2019;7(8):687–698. doi:10.1016/S2213-2600(19)30198-5
4. Norman RG, Pal I, Stewart C, Walsleben JA, Rapoport DM. Interobserver agreement among sleep scorers from different centers in a large dataset. Sleep. 2000;23(7):901–908. doi:10.1093/sleep/23.7.1e
5. Fietze I, Glos M, Zimmermann S, Penzel T. Long-term variability of the apnea-hypopnea index in a patient with mild to moderate obstructive sleep apnea. J Clin Sleep Med. 2020;16(2):319–323. doi:10.5664/jcsm.8192
6. OPPO. OPPO WATCH 3PRO; 2022. Available from: https://www.oppo.com/cn/accessories/oppo-watch-3-pro/.
7. OPPO. HeyTap Health; 2022. Available from:: https://play.google.com/store/apps/details?id=com.heytap.health.international&hl=en&gl=US&pli=1.
8. Fedorin I, Slyusarenko K, Lee W, Sakhnenko N Sleep stages classification in a healthy people based on optical plethysmography and accelerometer signals via wearable devices.
9. Kirszenblat R, Edouard P. Validation of the Withings ScanWatch as a wrist-worn reflective pulse oximeter: prospective interventional clinical study. J Med Intern Res. 2021;23(4):1.
10. Berry RB, Albertario CL, Harding SM, et al. The AASM Manual for the Scoring of Sleep and Associated Events: Rules, Terminology and Technical Specifications. American Academy of Sleep Medicine; 2018.
11. Chen Y, Wang W, Guo Y, Zhang H, Chen Y, Xie L. A single-center validation of the accuracy of a photoplethysmography-based smartwatch for screening obstructive sleep apnea. Nat Sci Sleep. 2021;13:1533. doi:10.2147/NSS.S323286
12. Lundberg SM, Lee SI A Unified Approach To Interpreting Model Predictions.
13. Whittle AT, Marshall I, Mortimore IL, Wraith PK, Sellar RJ, Douglas NJ. Neck soft tissue and fat distribution: comparison between normal men and women by magnetic resonance imaging. Thorax. 1999;54(4):323–328. doi:10.1136/thx.54.4.323
14. Malhotra A, Huang Y, Fogel RB, et al. The male predisposition to pharyngeal collapse: importance of airway length. Am J Respir Crit Care Med. 2002;166(10):1388–1395. doi:10.1164/rccm.2112072
15. Patil S, Schneider H, Gladmon E, et al. Obesity and upper airway mechanical control during sleep. Am J Respir Crit Care Med. 2004;169:A435.
16. Malhotra A, Huang Y, Fogel R, et al. Aging influences on pharyngeal anatomy and physiology: the predisposition to pharyngeal collapse. Am J Med. 2006;119(1):72. e79–72. e14. doi:10.1016/j.amjmed.2005.01.077
17. Lakhan P, Ditthapron A, Banluesombatkul N, Wilaiprasitporn T Deep neural networks with weighted averaged overnight airflow features for sleep apnea-hypopnea severity classification.
18. Gutiérrez-Tobal GC, Alvarez D, Del Campo F, Hornero R. Utility of adaboost to detect sleep apnea-hypopnea syndrome from single-channel airflow. Trans Biomed Eng. 2015;63(3):636–646. doi:10.1109/TBME.2015.2467188
19. Gutiérrez-Tobal GC, Álvarez D, Crespo A, Del Campo F, Hornero R. Evaluation of machine-learning approaches to estimate sleep apnea severity from at-home oximetry recordings. J Biomed Health Inform. 2018;23(2):882–892. doi:10.1109/JBHI.2018.2823384
20. Hsu YS, Chen TY, Wu D, Lin CM, Juang JN, Liu WT. Screening of obstructive sleep apnea in patients who snore using a patch-type device with electrocardiogram and 3-axis accelerometer. J Clin Sleep Med. 2020;16(7):1149–1160. doi:10.5664/jcsm.8462
21. Pan H, Huang G, Ren R, Lei F, Tang X. Diagnosis of obstructive sleep apnea syndrome using pulse oximeter derived photoplethysmographic signals. Zhonghua Yi Xue Za Zhi. 2016;96(19):1527–1529. doi:10.3760/cma.j.issn.0376-2491.2016.19.014
22. Edouard P, Campo D, Bartet P, et al. Validation of the Withings sleep analyzer, an under-the-mattress device for the detection of moderate-severe sleep apnea syndrome. J Clin Sleep Med. 2021;17(6):1217–1227. doi:10.5664/jcsm.9168
23. Zhao R, Xue J, Dong XS, et al. Screening for obstructive sleep apnea using a contact-free system compared with polysomnography. J Clin Sleep Med. 2021;17(5):1075–1082. doi:10.5664/jcsm.9138
24. Gu W, Leung L, Kwok KC, Wu I-C, Folz RJ, Chiang AA. Belun ring platform: a novel home sleep apnea testing system for assessment of obstructive sleep apnea. J Clin Sleep Med. 2020;16(9):1611–1617. doi:10.5664/jcsm.8592
25. Zhao R, Xue J, Zhang X, et al. Comparison of ring pulse oximetry using reflective photoplethysmography and psg in the detection of osa in Chinese adults: a pilot study. Nat Sci Sleep. 2022;Volume 14:1427–1436. doi:10.2147/NSS.S367400
26. Papini GB, Fonseca P, van Gilst MM, Bergmans JW, Vullings R, Overeem S. Wearable monitoring of sleep-disordered breathing: estimation of the apnea–hypopnea index using wrist-worn reflective photoplethysmography. Sci Rep. 2020;10(1):1–15. doi:10.1038/s41598-020-69935-7
27. Gouveris H, Selivanova O, Bausmer U, Goepel B, Mann W. First-night-effect on polysomnographic respiratory sleep parameters in patients with sleep-disordered breathing and upper airway pathology. Eur Arch Oto-Rhino-Laryngol. 2010;267(9):1449–1453. doi:10.1007/s00405-010-1205-3
28. Stöberl AS, Schwarz EI, Haile SR, et al. Night‐to‐night variability of obstructive sleep apnea. J Sleep Res. 2017;26(6):782–788. doi:10.1111/jsr.12558
29. Roeder M, Sievi NA, Bradicich M, et al. The accuracy of repeated sleep studies in OSA: a longitudinal observational study with 14 nights of oxygen saturation monitoring. Chest. 2021;159(3):1222–1231. doi:10.1016/j.chest.2020.09.098
30. Oksenberg A, Arons E, Nasser K, Vander T, Radwan H. REM-related obstructive sleep apnea: the effect of body position. J Clin Sleep Med. 2010;6(4):343–348. doi:10.5664/jcsm.27875
31. Zhang Z, Qi M, Hügli G, Khatami R. The challenges and pitfalls of detecting sleep hypopnea using a wearable optical sensor: comparative study. J Med Intern Res. 2021;23(7):1.
 © 2024 The Author(s). This work is published and licensed by Dove Medical Press Limited. The full terms of this license are available at https://www.dovepress.com/terms.php and incorporate the Creative Commons Attribution - Non Commercial (unported, v3.0) License.
By accessing the work you hereby accept the Terms. Non-commercial uses of the work are permitted without any further permission from Dove Medical Press Limited, provided the work is properly attributed. For permission for commercial use of this work, please see paragraphs 4.2 and 5 of our Terms.
© 2024 The Author(s). This work is published and licensed by Dove Medical Press Limited. The full terms of this license are available at https://www.dovepress.com/terms.php and incorporate the Creative Commons Attribution - Non Commercial (unported, v3.0) License.
By accessing the work you hereby accept the Terms. Non-commercial uses of the work are permitted without any further permission from Dove Medical Press Limited, provided the work is properly attributed. For permission for commercial use of this work, please see paragraphs 4.2 and 5 of our Terms.