")
Back to Journals » Neuropsychiatric Disease and Treatment » Volume 10
A new method for analyzing auditory brain-stem response waveforms using a moving-minimum subtraction procedure of digitized analog recordings
Authors Källstrand J, Lewander T, Baghdassarian E, Nielzén S
Received 14 December 2013
Accepted for publication 10 February 2014
Published 6 June 2014 Volume 2014:10 Pages 1011—1016
DOI https://doi.org/10.2147/NDT.S59178
Checked for plagiarism Yes
Review by Single anonymous peer review
Peer reviewer comments 3
Johan Källstrand,1 Tommy Lewander,2 Eva Baghdassarian,2,3 Sören Nielzén4
1SensoDetect AB, Lund, 2Department of Neuroscience, Medical Faculty, Uppsala University, 3Department of Psychiatry, Uppsala University Hospital, Uppsala, 4Department of Psychiatry, Medical Faculty, University of Lund, Lund, Sweden
Abstract: The auditory brain-stem response (ABR) waveform comprises a set of waves (labeled I–VII) recorded with scalp electrodes over 10 ms after an auditory stimulation with a brief click sound. Quite often, the waves are fused (confluent) and baseline-irregular and sloped, making wave latencies and wave amplitudes difficult to establish. In the present paper, we describe a method, labeled moving-minimum subtraction, based on digitization of the analog ABR waveform (154 data points/ms) in order to achieve alignment of the ABR response to a straight baseline, often with clear baseline separation of waves and resolution of fused waves. Application of the new method to groups of patients showed marked differences in ABR waveforms between patients with schizophrenia versus patients with adult attention deficit/hyperactivity disorder versus healthy controls. The findings show promise regarding the possibility to identify ABR markers to be used as biomarkers as support for clinical diagnoses of these and other neuropsychiatric disorders.
Keywords: auditory brain-stem response, digitization, moving-minimum subtraction method, baseline alignment, schizophrenia, ADHD
Introduction
The auditory brain-stem response (ABR) is a sound stimulus-evoked change in electrical potential measured in microvolts and recorded over 10 ms using scalp electrodes that record synchronous electrical activity of populations of brain-stem neurons. The technique was first described by Jewett and Williston in 1971, and reflects subcortical potential shifts evoked by auditory stimuli, typically square pulse trains.1 The ABR consists of seven positive waves (labeled I–VII) that occur within 10 ms after stimulus onset. Waves I and II emanate from the auditory nerve, whereas the subsequent positive waves are thought to reflect combined electrical activity of nuclei at higher levels of the ascending auditory pathway.2,3 Waves III and IV are believed to be generated in the cochlear nucleus and the superior olivary complex, respectively. Wave V is believed to represent activity at the levels of the lateral lemniscus and inferior colliculus.4 Generators of waves VI and VII have been suggested to have thalamic (medial geniculate body) origin. Various audiological and neurological abnormalities can be detected by examining the waveform, ie, the latencies and amplitudes of individual waves.3,5 The amplitudes of the ABR waves are sometimes difficult to measure, due to complex waveforms and high inter- and intraindividual variability, and have therefore been found to be of limited clinical value.6 Latencies and latency ratios are of broader clinical use.3,6 The aims of the present study were to explore means to improve interpretation of ABR recordings by aligning the troughs between waves to a common baseline set to zero, ie, baseline alignment, and to apply the method to groups of patients with schizophrenia and attention deficit/hyperactivity disorder (ADHD) versus healthy controls. ABR abnormalities have previously been reported in both patient groups,7–19 as elaborated upon in the “Discussion” section.
Materials and methods
A square click sound was used as the stimulus for the ABR recordings. The duration of each click was 0.000136 seconds, with a rise and fall of 0.000023 seconds; the interstimulus interval was 0.192 seconds from onset to onset of the clicks. A total of 1,024 accepted evoked responses were collected, and an averaged ABR curve was obtained for each subject. Aberrant activity, eg, from coughing was rejected using the standard setup of the Chartr software (GN Otometrics, Taastrup, Denmark). The click sounds had an intensity level of 80 dB. The sound-pressure levels were calibrated using a Bruel and Kjær 2203 sound-level meter and a type 4152 artificial ear (Bruel and Kjær S&V Measurement, Nærum, Denmark). The auditory stimulus was constructed using the MatLab signal-processing toolbox (The MathWorks, Inc., Natick, MA, USA) and presented using a Denon DCD-685 CD player (Denon Electronics, Mahwah, NJ, USA). The output of the CD player was connected to TDH-50P headphones with model 51 cushions (Telephonics, Farmingdale, NY, USA). Presentations were made binaurally with the stimuli in phase over the headphones. The evoked potentials were recorded using the Chartr EP ABR recording equipment (GN Otometrics). Transistor–transistor logic trigger pulses coordinated the sweeps with the auditory stimuli. The resulting analog ABR waveforms were digitized using the ByteScout (Vancouver, BC, Canada) software and imported to Microsoft Excel (Microsoft Corporation, Redmond, WA, USA) for further processing.
Moving-minimum subtraction method
In order to improve interpretation of ABR recordings and to allow more sophisticated analyses of ABR waveforms, we developed a process we labeled the moving-minimum subtraction method, which is somewhat similar to the moving-average method used for smoothing of “spiky” or irregular data in time-series analyses.20,21 A prerequisite is that the analog ABR waveforms are digitized, ie, represented by a series of x/y-values or data points, where the x-axis = time in milliseconds, and the y-axis = microvolts. The 10 ms authentic analog ABR is represented by 1,540 data points with the digitization method used, ie, 154 data points/ms. In the moving-average method, the first data points within a fixed time window are averaged to form a new data point, then the time window is moved forward and the next set of data points are averaged, etc. In the moving-minimum subtraction method, the first data point in a time series is subtracted by the minimum value within a subsequent set time or data-point window. (The size of the data-point window may be varied between analyses depending on the objectives of the analysis.) The obtained value may be positive or negative. The time window is then moved to the second data point and its subsequent window of data points, etc. Therefore, a series of new data points over the time series is obtained. By setting the minimum value in the new series of data points to zero, the whole time series can be adjusted to a new baseline, ie, baseline aligned, and the waves are mostly separated from each other, making measurements of latencies and amplitudes easier. In addition, digitization of the unprocessed and baseline-aligned ABRs allows detailed numerical analyses (distance differences, correlations) of segments and wave configurations of the ABR waveforms versus normative or versus reference data. The principles of the moving-minimum subtraction method are further described in Figure 1. The new method has been applied to authentic analog ABR waveforms (Figures 2 and 3) showing the unprocessed digitized ABR waveforms and the processed waveforms using three different data-point windows (W=136, W=68, W=34). The selection of data-point windows was done with respect to the wave durations. Therefore, the W=136 data-point window should include the broader fused waves II–III and IV–V, respectively, whereas the W=68 data point window should include the single waves II, III, IV, and V. The W=34 data points has been shown to have potential to indicate latencies more exactly.
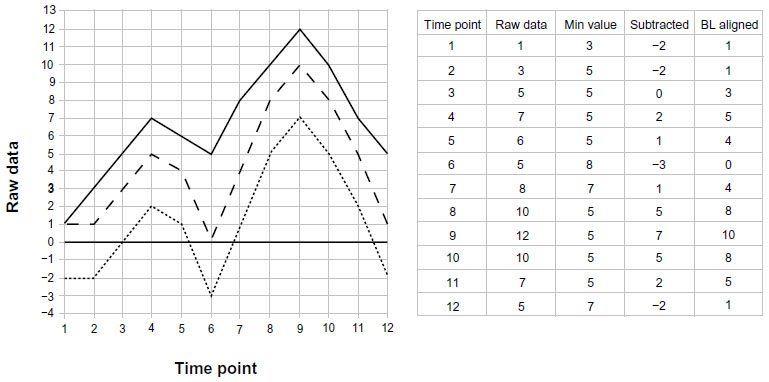 | Figure 1 Principles of the moving-minimum subtraction method. |
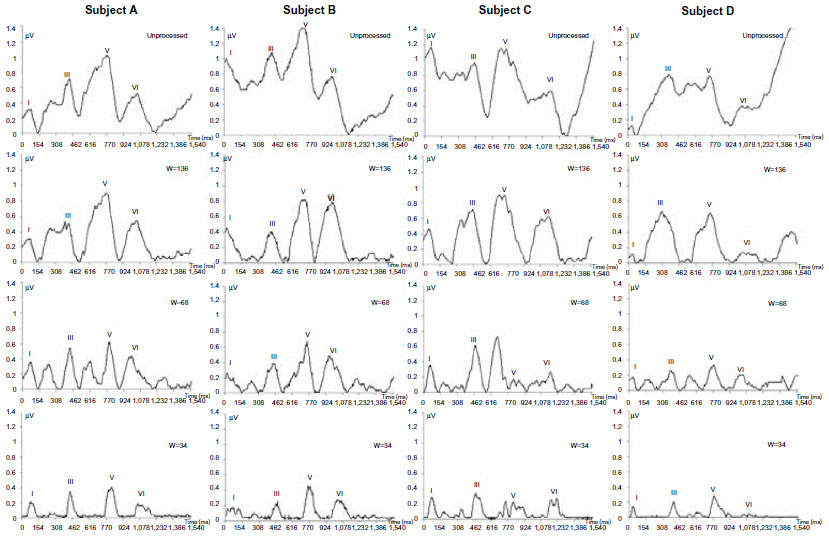 | Figure 2 Application of the moving-minimum subtraction method on authentic auditory brain-stem responses (ABRs) from four subjects (subjects A–D) with highly variable waveforms. |
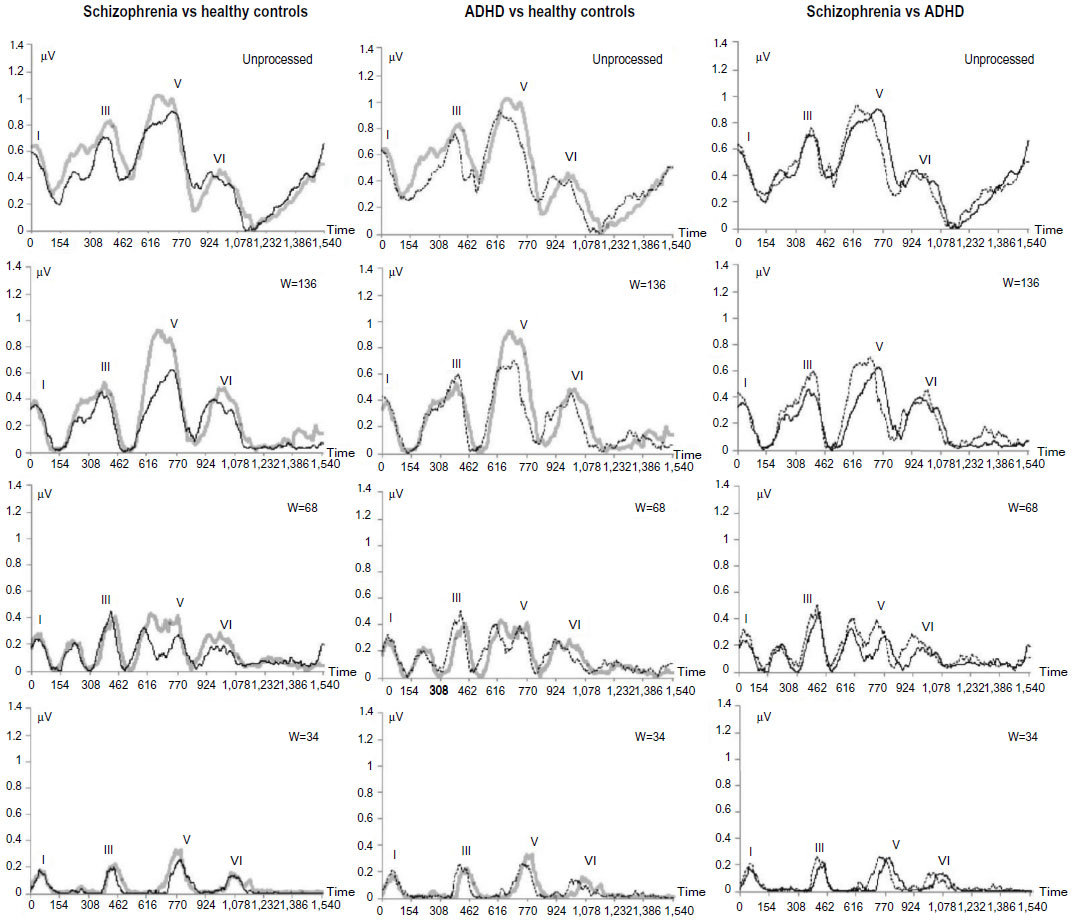 | Figure 3 Median auditory brain-stem response (ABR) waveforms of ten healthy volunteers (gray curve) compared with ten patients with schizophrenia (black curve, left panels) and with ten patients with adult attention deficit/hyperactivity disorder (ADHD) (dotted curve, middle panels), respectively. The schizophrenia and ADHD groups are directly compared in the right panels. The authentic analog waveforms were digitized to allow baseline alignments according to the moving-minimum subtraction method using three windows (W=136, W=68, W=34 data points), and to allow descriptive statistics of groups and statistical analyses of group differences. |
Definitions
The processed signal Y consists of data points y1, y2, … yn, where n is the total number of data points. The moving-minimum subtraction for a data point yk is defined as yk = xk – minimum (xk+1, xk+2, … xk+w), where k=1, 2, … n, thus rolling or moving over the data set. The constant W determines the number of data points from which the minimum is taken. Y is then adjusted to a new baseline by subtracting the minimum of Y from each data point. When the number of data points at the end of the curve becomes less than the window size, the window size will be decreased to the number of data points left in the data set.
Study participants
ABR recordings were obtained from the left side of four single subjects (subjects A–D), ten medicated patients with chronic schizophrenia (six males, four females, age range 27–42 years), and ten unmedicated patients with adult ADHD, with a duration of illness >1 year (three males, seven females, age range 23–50 years), diagnosed according to the Diagnostic and Statistical Manual of Mental Disorders, fourth edition, by senior psychiatrists. Exclusion criteria were psychiatric comorbidity, alcohol- and substance-related and other central nervous system (including neurological) disorders. Ten healthy volunteers (six males, four females, age range 25–40 years) with no psychiatric or neurological disorders served as controls. Written informed consent was obtained from the study participants in accordance with the conditions for approval of the study by the Ethical Committee, University of Lund, Sweden (353/2006).
Results
In the present paper, the moving-minimum subtraction method was applied to four different unprocessed ABR waveforms with increasing complexity (Figure 2, subjects A–D) and to two neuropsychiatric patient groups compared with a group of healthy controls (Figure 3).
As shown in Figure 2, application of the new method provides clear zero-baseline separation between waves I, III, V, and VI for the three data-point windows (W=136, W=68, and W=34, corresponding to 0.88, 0.44, and 0.22 ms, respectively). Wave latencies were approximately the same for the processed and the unprocessed ABR recordings. In some instances (subjects A and D, W=68), fused (confluent) waves (II–III, IV–V) appeared to be resolved into the two components (II and III; IV and V) with baseline separation. In subject B, wave IV appeared less distinct, and in subject C (W=68), wave IV appeared more prominent than a split wave V. The wave amplitudes were similar in size for the unprocessed ABRs and W=136, and the amplitudes decreased with the narrower data-point windows (W=68, W=34).
The advantage of digitization of the ABR waveforms was further utilized in combining individual unprocessed and baseline-aligned (processed) ABRs into grouped data. The median waveforms of ten healthy volunteers (gray waveforms in two panels), ten patients with schizophrenia (black curve, left and right panels), ten patients with adult ADHD (dotted curve, middle and right panels; schizophrenia versus ADHD, right panel) are shown in Figure 3. Inspection of the unprocessed waveforms indicates group differences between the healthy volunteers and the two patient groups, both with regard to wave forms, latencies, and amplitudes. Differences between the schizophrenia and the ADHD groups are also apparent. A large number of statistically significant differences (P<0.05) between the healthy volunteer group versus the schizophrenia group, as well as versus the ADHD group, and between the schizophrenia and ADHD groups were found using the Mann–Whitney U-test (data not shown). After baseline alignment using the moving-minimum subtraction method with W=136, the group differences were even more conspicuous. Using W=68, the confluent waves II–III and IV–V were fully or partly resolved, similarly to subjects A–D in Figure 2. Also, the wave amplitudes decreased with decreasing size of the two narrower windows (W=68, W=34), similar to the results in Figure 2.
Discussion
The first aim of the present study was to find a way of zero-baseline alignment of ABR waveforms, even those with abnormal waveforms, in order to be able to determine latencies, amplitudes, and configurations of separate waves (I–VII) of the ABRs more accurately. By digitizing analog ABRs and applying the moving-minimum subtraction method and testing three different data-point (time) windows, it was possible to achieve baseline alignment with clear baseline separations of single and fused waves (W=136), with preservation of the authentic latencies and amplitudes. By using a smaller time window (W=68) it was possible to resolve fused waves (waves II and III, and IV and V). The smallest time window (W=34) provided peaks of waves I, III, V, and VI, useful for confirmation of these wave latencies. It remains to be explored if additional time windows will provide even better information on the unprocessed ABR waveforms.
In Figures 2 and 3, the recordings from the left side with a standard click sound have been used for demonstration of the potentials of the new method. Analysis of ABR waveforms from both sides will provide information on lateralization (asymmetry). By including click sounds with inter alia other frequencies (Hz), sound-pressure levels (dB), and forward and backward masking, more information may be gained on the afferent and efferent auditory pathways. Based on the findings, we suggest the application of digitization and the moving-minimum subtraction method to other auditory-evoked potentials, ie, the auditory middle-latency response (15–50 ms, including P50), the auditory late response (75–200 ms), the auditory P300 (300 ms postclick), and the mismatch-negativity response may provide new avenues for interpretation of the underlying physiology and anatomy of these responses, as well as the clinical utility of such measures.
The second aim of the study was to apply the new method of analyzing ABR recordings to groups of adult neuropsychiatric patients, ie, schizophrenia and ADHD versus healthy volunteers, in order to explore the potential clinical utility of the method for pathophysiological investigations and for diagnostic purposes. As shown in Figure 3, the median ABR recordings showed clear differences in amplitudes and waveforms, rather than latencies, for both patient groups versus controls and between the schizophrenia and ADHD groups. The unprocessed and the three data-point windows provided results on a group level similar to those found for individuals. Group differences varied in size and prominence, depending on the data-point window being used. Our present preliminary results seem to support previous findings of changes of ABR waveforms in schizophrenia with or without medication and other neuropsychiatric disorders.7–19 The low number of study participants per group and allowing medication in patients with schizophrenia are limitations of the clinical part of the present study. According to Hall,3 common ABR is not affected by anesthetics or sedative drugs, including antipsychotics. Previously reported changes of ABR in schizophrenia have been observed in both medicated and unmedicated patients.14,15,17 However, it cannot be ruled out that the medication effects can be observed with our new method. Therefore, larger numbers of patients with and without medication need to be investigated.
Our findings with the moving-minimum subtraction method open up the possibility of obtaining new knowledge on physiological and in turn anatomical deviances in brain-stem functions in mental and other central nervous system disorders. Our results also open up the possibility of utilizing the ABRs in combination with the moving-minimum subtraction method to identify markers in ABR waveforms to be used as biomarkers in support of clinical diagnoses of schizophrenia and ADHD in individual patients.
Conclusion
Application of the newly developed moving-minimum subtraction method to digitized analog ABRs shows that the waveforms can be aligned to a straight baseline with clear baseline separation between waves and even resolution of fused waves, depending on the setting of a constant of the method. Marked differences in wave amplitudes and wave conformations were observed when comparing median ABRs of groups of patients with schizophrenia and ADHD versus healthy controls. The new method shows promise in identifying biomarkers, ie, sets of numerical diagnostic markers, from ABRs of individual patients to support the clinical diagnoses of neuropsychiatric disorders, including schizophrenia.
Acknowledgment
Christopher Jonson, MSc, is gratefully acknowledged for advice on the mathematical equation.
Disclosure
JK, MSc, is employed by and holds stock in SensoDetect AB, Lund, Sweden. TL, MD PhD, Assistant Professor of Experimental Psychiatry, Medical Faculty, University of Uppsala, Sweden, is not employed by and does not hold stock in SensoDetect AB. EB, MD, Senior Consultant, Department of Psychiatry, Uppsala University Hospital, Uppsala, Sweden, is not employed by and does not hold stock in SensoDetect AB. SN, MD PhD, Assistant Professor of Psychiatry, University of Lund, Sweden, holds stock in but is not employed by SensoDetect AB.
References
Jewett DL, Williston JS. Auditory-evoked far fields averaged from the scalp of humans. Brain. 1971;94(4):681–696. | |
Burkard RF, Don M, Eggermont JJ. Auditory Evoked Potentials: Basic Principles and Clinical Applications. Baltimore: Williams and Wilkins; 2007. | |
Hall JW 3rd. New Handbook of Auditory Evoked Responses. Upper Saddle River (NJ): Pearson; 2007. | |
Wilkinson AR, Jiang ZD. Brainstem auditory response in neonatal neurology. Semin Fetal Neonatal Med. 2006;11(6):444–451. | |
Hosford-Dunn H. Auditory brainstem response audiometry. Applications in central disorders. Otolaryngol Clin North Am. 1985;18(2):257–284. | |
Beattie RC. Interaction of click polarity, stimulus level, and repetition rate on the auditory brainstem response. Scand Audiol. 1988;17(2):99–109. | |
Hayashida Y, Mitani Y, Hosomi H, Amemiya M, Mifune K, Tomita S. Auditory brain stem responses in relation to the clinical symptoms of schizophrenia. Biol. Psychiatry. 1986;21(2):177–188. | |
Igata M, Ohta M, Hayashida Y, Abe K. Missing peaks in auditory brainstem responses and negative symptoms of schizophrenia. Jpn J Psychiatry Neurol. 1994;48(3):571–578. | |
Igata M, Ohta M, Hayashida Y, Abe K. Normalization of auditory brainstem responses resulting from improved clinical symptoms in schizophrenia. Schizophr Res. 1995;16(1):81–82. | |
Kimhi R, Englender M, Zohar M, Harell M. Brainstem auditory evoked responses in hospitalized unmedicated schizophrenic patients. Isr J Psychiatr Relat Sci. 1987;24(4):289–294. | |
Källstrand J, Montnémery P, Nielzén S, Olsson O. Auditory masking experiments in schizophrenia. Psychiatry Res. 2002;113(1–2):115–125. | |
Källstrand J, Olsson O, Nehlstedt SF, Sköld ML, Nielzén S. Abnormal auditory forward masking pattern in the brainstem response of individuals with Asperger syndrome. Neuropsychiatr Dis Treat. 2010;6:289–296. | |
Källstrand J, Nehlstedt SF, Sköld ML, Nielzén S. Lateral asymmetry and reduced forward masking effect in early brainstem auditory evoked response in schizophrenia. Psychiatr Res. 2012;196(2–3):188–193. | |
Lindström LH, Klockhoff I, Svedberg A, Bergström K. Abnormal auditory brain-stem responses in hallucinating schizophrenic patients. Br J Psychiatry. 1987;151(1):9–14. | |
Lindström LH, Wieselgren IM, Klockhoff I, Svedberg A. Relationship between abnormal brainstem auditory-evoked potentials and subnormal CSF levels of HVA and 5-HIAA in first-episode schizophrenic patients. Biol Psychiatry. 1990;28(5):435–442. | |
Pfefferbaum A, Horvath TB, Roth WT, Tinlenberg JR, Kopell BS. Auditory brain stem and cortical evoked potentials in schizophrenia. Biol Psychiatry. 1980;15(2):209–223. | |
Leavitt VM, Molholm S, Ritter W, Shpaner M, Foxe JJ. Auditory processing in schizophrenia during the middle latency period (10–50 ms): high-density electrical mapping and source analysis reveal subcortical antecedents to early cortical deficits. J Psychiatry Neurosci. 2007;32(5):339–353. | |
Lahat E, Avital E, Ban J, Berkovitch M, Arlazoroff A, Aladjem M. BAEP studies in children with attention deficit disorder. Dev Med Child Neurol. 1995;37(2):119–123. | |
Puente A, Ysunza A, Pamplona M, Silva-Rojas A, Lara C. Short latency and long latency auditory evoked responses in children with attention deficit disorder. Int J Pediatr Otorhinolaryngol. 2002;62(1):45–51. | |
Sun L, Hinrichs H. Simultaneously recorded EEG-fMRI: removal of gradient artifacts by subtraction of head movement related average artifact waveforms. Hum Brain Mapp. 2009;30(10):3361–3377. | |
Jansen BH. Analysis of biomedical signals by means of linear modeling. Crit Biomed Eng. 1985;12(4):343–392. |
 © 2014 The Author(s). This work is published and licensed by Dove Medical Press Limited. The full terms of this license are available at https://www.dovepress.com/terms.php and incorporate the Creative Commons Attribution - Non Commercial (unported, v3.0) License.
By accessing the work you hereby accept the Terms. Non-commercial uses of the work are permitted without any further permission from Dove Medical Press Limited, provided the work is properly attributed. For permission for commercial use of this work, please see paragraphs 4.2 and 5 of our Terms.
© 2014 The Author(s). This work is published and licensed by Dove Medical Press Limited. The full terms of this license are available at https://www.dovepress.com/terms.php and incorporate the Creative Commons Attribution - Non Commercial (unported, v3.0) License.
By accessing the work you hereby accept the Terms. Non-commercial uses of the work are permitted without any further permission from Dove Medical Press Limited, provided the work is properly attributed. For permission for commercial use of this work, please see paragraphs 4.2 and 5 of our Terms.