")
Back to Journals » Journal of Inflammation Research » Volume 14
Whole Blood Expression Pattern of Inflammation and Redox Genes in Mild Alzheimer’s Disease
Authors Milanesi E, Dobre M, Cucos CA, Rojo AI, Jiménez-Villegas J, Capetillo-Zarate E, Matute C, Piñol-Ripoll G, Manda G , Cuadrado A
Received 14 August 2021
Accepted for publication 29 September 2021
Published 20 November 2021 Volume 2021:14 Pages 6085—6102
DOI https://doi.org/10.2147/JIR.S334337
Checked for plagiarism Yes
Review by Single anonymous peer review
Peer reviewer comments 3
Editor who approved publication: Professor Ning Quan
Elena Milanesi,1,* Maria Dobre,1,* Cătălina Anca Cucos,1 Ana I Rojo,2– 5 José Jiménez-Villegas,2,3 Estibaliz Capetillo-Zarate,5– 7 Carlos Matute,6,7 Gerard Piñol-Ripoll,8 Gina Manda,1 Antonio Cuadrado1– 5
1“Victor Babes” National Institute of Pathology, Bucharest, 050096, Romania; 2Department of Endocrine Physiology and Nervous System, Instituto de Investigaciones Biomédicas “Alberto Sols” UAM-CSIC, Madrid, 28029, Spain; 3Department of Biochemistry, Faculty of Medicine, Autonomous University of Madrid, Madrid, 28049, Spain; 4Neuroscience Section, Instituto de Investigación Sanitaria La Paz (IDIPAZ), Madrid, 28046, Spain; 5Centro de Investigación Biomédica en Red Sobre Enfermedades Neurodegenerativas (CIBERNED), ISCIII, Madrid, 28031, Spain; 6IKERBASQUE, Basque Foundation for Science, Bilbao, 48009, Spain; 7Department of Neuroscience, University of the Basque Country UPV/EHU, Achucarro Basque Center for Neuroscience, Leioa, Spain; 8Unitat Trastons Cognitius, Hospital Universitari Santa Maria-IRB Leida, Lleida, 25198, Spain
*These authors contributed equally to this work
Correspondence: Antonio Cuadrado
Instituto de Investigaciones Biomédicas “Alberto Sols” UAM-CSIC, C/ Arturo Duperier 4, Madrid, 28029, Spain
Email [email protected]
Gina Manda
“Victor Babes” National Institute of Pathology, 99-101 Splaiul Independentei, Bucharest, 050096, Romania
Email [email protected]
Background: Although Alzheimer’s disease (AD) is associated with alterations of the central nervous system, this disease has an echo in blood that might represent a valuable source of biomarkers for improved diagnosis, prognosis and for monitoring drug response.
Methods: We performed a targeted transcriptomics study on 38 mild Alzheimer’s disease (AD) patients and 38 matched controls for evaluating the expression levels of 136 inflammation and 84 redox genes in whole blood. Patients were diagnosed as mild AD based on altered levels of total TAU, phospho-TAU and Abeta(1– 42) in cerebrospinal fluid, and Abeta(1– 40), Abeta(1– 42) and total TAU levels in plasma. Whenever possible, blood and brain comparisons were made using public datasets.
Results: We found 48 inflammation and 34 redox genes differentially expressed in the blood of AD patients vs controls (FC > 1.5, p < 0.01), out of which 22 pro-inflammatory and 12 redox genes exhibited FC > 2 and p < 0.001. Receiver operating characteristic (ROC) analysis identified nine inflammation and seven redox genes that discriminated between AD patients and controls (area under the curve > 0.9). Correlations of the dysregulated inflammation and redox transcripts indicated that RELA may regulate several redox genes including DUOX1 and GSR. Based on the gene expression profile, we have found that the master regulators of inflammation and redox homeostasis, NFκB and NRF2, were significantly disturbed in the blood of AD patients, as well as several zinc finger and helix-loop-helix transcription factors.
Conclusion: The selected inflammation and redox genes might be useful biomarkers for monitoring anti-inflammatory therapy in mild AD.
Keywords: oxidative stress, neuroinflammation, gene expression, dementia, NRF2, NFkappaB
Introduction
The two most important unmet needs in the management of Alzheimer’s disease (AD) are to find a disease modifying therapy and to develop novel biomarkers for early disease, which could be used to improve diagnosis, prognosis and monitoring, as well as to predict patient’s response to therapy. Moreover, if these biomarkers would be mechanistically connected with the onset or progression of AD, then early pharmacological interventions aimed at regulating their function may provide a tremendous therapeutic benefit.
Measurement of amyloid (A)β(1–42), total TAU (TAU) and phosphorylated TAU (p-TAUT181) in cerebrospinal fluid (CSF), complemented by radioactive tracing of fibrillary Aβ protein loads in the brain1 and volumetric analysis of the hippocampus and entorhinal cortex, has proven to be useful in the early diagnosis of AD.2,3 However, these biomarkers are not convenient for disease prognosis and monitoring, or for predicting the response to therapy because the clinical correlations are lost while disease is progressing.4,5 Other molecules are now being explored as AD-monitoring biomarkers in the CSF, including neurofilament light polypeptide (NFL), neurogranin and visinin-like protein 1,6 that appear to be promising candidate markers for monitoring AD, albeit not being highly specific for this disease.7
Compelling evidence exists that AD, along with other neurodegenerative diseases and non-communicable diseases, is underlined by low-grade chronic inflammation, both at local and peripheral level.8,9 The critical role of neuroinflammation in the pathogenesis of AD is well documented by clinical and preclinical studies.10 In response to local brain damages, a persistent immune response is elicited locally by various brain cells (resident macrophages – microglia, astrocytes, newly recruited myeloid cells, etc), and further sustains neurodegeneration.11 For instance, transcriptomic data from 1633 post-mortem brain samples have identified a cluster of AD patients with a strong neuroinflammatory signature linked to microglia function and the TREM2/TYROBP signaling pathway, an important mediator of neuroinflammation.12 Moreover, neuroinflammation correlates with cognitive deficits in AD. Thus, a multimodal and multivariate neuroimaging approach demonstrated a spatially distributed neuroinflammation in connection with changes in large-scale functional connectivity and cognitive deficits.13 Albeit not being specific to AD, neuroinflammation represents not only a promising therapeutic target,14 but also a source of potential markers in CSF. For instance, a meta-analysis performed on 2629 patients and 2049 controls showed that the levels of TGF-β (transforming growth factor-β), MCP-1 (monocyte chemoattractant protein-1) and YKL-40 were significantly elevated in the CSF of AD patients as compared to controls.15 Additionally, a study on AD cohorts from the DIAN and ADNI multicentric studies (1246 participants)16 found that higher levels the immunomodulatory progranulin in CSF in late-onset AD were associated with more advanced disease stages and cognitive impairment. Meanwhile, progranulin correlated with high levels of soluble TREM2 (triggering receptor expressed on myeloid cells 2) only when there was underlying pathology. These new inflammatory CSF candidate markers might complement conventional AD biomarkers for better stratification of patients. However, they must be further validated in large and well-characterized cohorts, in connection with the disease stage for future translation into the clinical practice.
In addition to neuroinflammation, redox alterations comprising both increased oxidative activity and deficient antioxidant protection have been also conclusively reported in AD brains,17,18 correlating with the brain regions where AD-specific injuries occur.19 Various oxidative markers related to DNA oxidation/damage and lipid peroxidation, as well as antioxidant molecules such as glutathione, thioredoxin and superoxide dismutase, have been identified in AD patients, part of them being detected both in brain and CSF.20
Altogether, the interplay between inflammation and redox changes21 sustains the hypothesis that correlated low-grade inflammation and oxidative disturbances underlie pathological mechanisms in AD.22
Blood, collected by a minimally invasive procedure, is an alternative to CSF. Investigations in blood would allow the screening of large populations at risk, with reduced time intervals between evaluations, hence supporting personalized therapeutic strategies and their timely update.23 Due to the recent development of ultrasensitive immunoassays,24 some of the most relevant molecules in AD, such as Aβ, TAU and NFL, can now be measured in the plasma of AD patients, albeit the much lower concentrations than in CSF. However, little has been done in the search for blood inflammatory biomarkers. This is probably due to the fact that such biomarkers are not likely specific for AD, and the results might be confounding due to other inflammatory processes deriving from co-morbidities, infections or ageing.25
Blood is a window for investigating the inter-related systemic and local immune responses, inflammation and redox signaling alterations in chronic pathologies.18,26 The data reported by the few transcriptomic studies performed up to now in the blood of AD patients have revealed that peripheral blood mononuclear cells exhibit molecular changes that occur also in the AD brain,27 indicating new immunologic facets of the blood–brain crosstalk.28 Moreover, the meta-analysis of three public datasets (ADNI, AddNeuroMed 1 and 2) emphasized that AD-related genes in blood were indeed enriched with inflammation, mitochondria and Wnt signaling pathways,29 hence emphasizing the link between peripheral immune disturbances and AD pathogenesis.
Despite this evidence, blood-based cellular inflammation and oxidative biomarkers have not been validated so far in AD. For the moment, most results obtained in the blood of AD patients vs matched controls have not yet been broadly reproduced across research laboratories, possibly due to diagnostic misclassification, low number of investigated patients at different disease stages, variable health status, the type of the investigated biological samples (whole blood or peripheral blood mononuclear cells) or different methods used for assessing and normalizing gene expression levels.30
In this work, we carried out a case–control study for investigating through qRT-PCR the expression profile of critical inflammation and redox genes in the whole blood of mild AD patients and controls. Our results indicated highly distinctive expression levels of several inflammation and redox genes. Novel therapies aimed at mitigating chronic low-grade inflammation and oxidative stress in mild AD patients could take advantage of these new markers for drug target engagement and disease monitoring.
Materials and Methods
Patients and Controls
The case–control study was performed on 38 mild AD patients and 38 controls that were recruited and diagnosed at the Hospital Universitari Santa Maria-IRB Lleida, Lleida, Spain, based on the values of the CSF markers described in Table 1. The patient, the responsible caregiver and the legal representative (when different from the responsible caregiver) signed an informed consent form. The inclusion criteria comprised acetylcholinesterase inhibitor-naïve individuals aged over 60 years who were diagnosed with AD according to the NIA-AA criteria.2 Additionally, only patients with mild cognitive impairment (mini-mental state examination [MMSE]≥20) were included. The exclusion criteria comprised 1) the presence of visual and/or communication problems that could render compliance with the study procedures difficult; 2) comorbidities such as cancer, severe renal or hepatic insufficiency, severe cardiac or respiratory failure; 3) no acute episodes of inflammation within 1 month prior to investigation; 4) excessive alcohol intake (>280 g/week); 5) MRI evidence of hydrocephalus, stroke, a space-occupying lesion, or any clinically relevant central nervous system disease other than AD; 6) the presence of mental disorders according to DSM-V-TR™ criteria; 7) the presence of untreated (or treated for less than 3 months prior to the screening visit) vitamin B12 or folate deficiency; and 7) the presence of untreated thyroid disease. Cognition was assessed using a broad neuropsychological battery. The MMSE score was used to include only patients with mild cognitive impairment. All tests were run by the same neurologist. The MMSE questionnaire includes questions to evaluate different domains, such as attention, time and place orientation, and word recall. The scores of this test ranged from 0 to 30, and a higher score indicates better cognitive function.31 The demographic, clinical and biochemical characteristics of the investigated mild AD patients and controls are presented in Table 1.
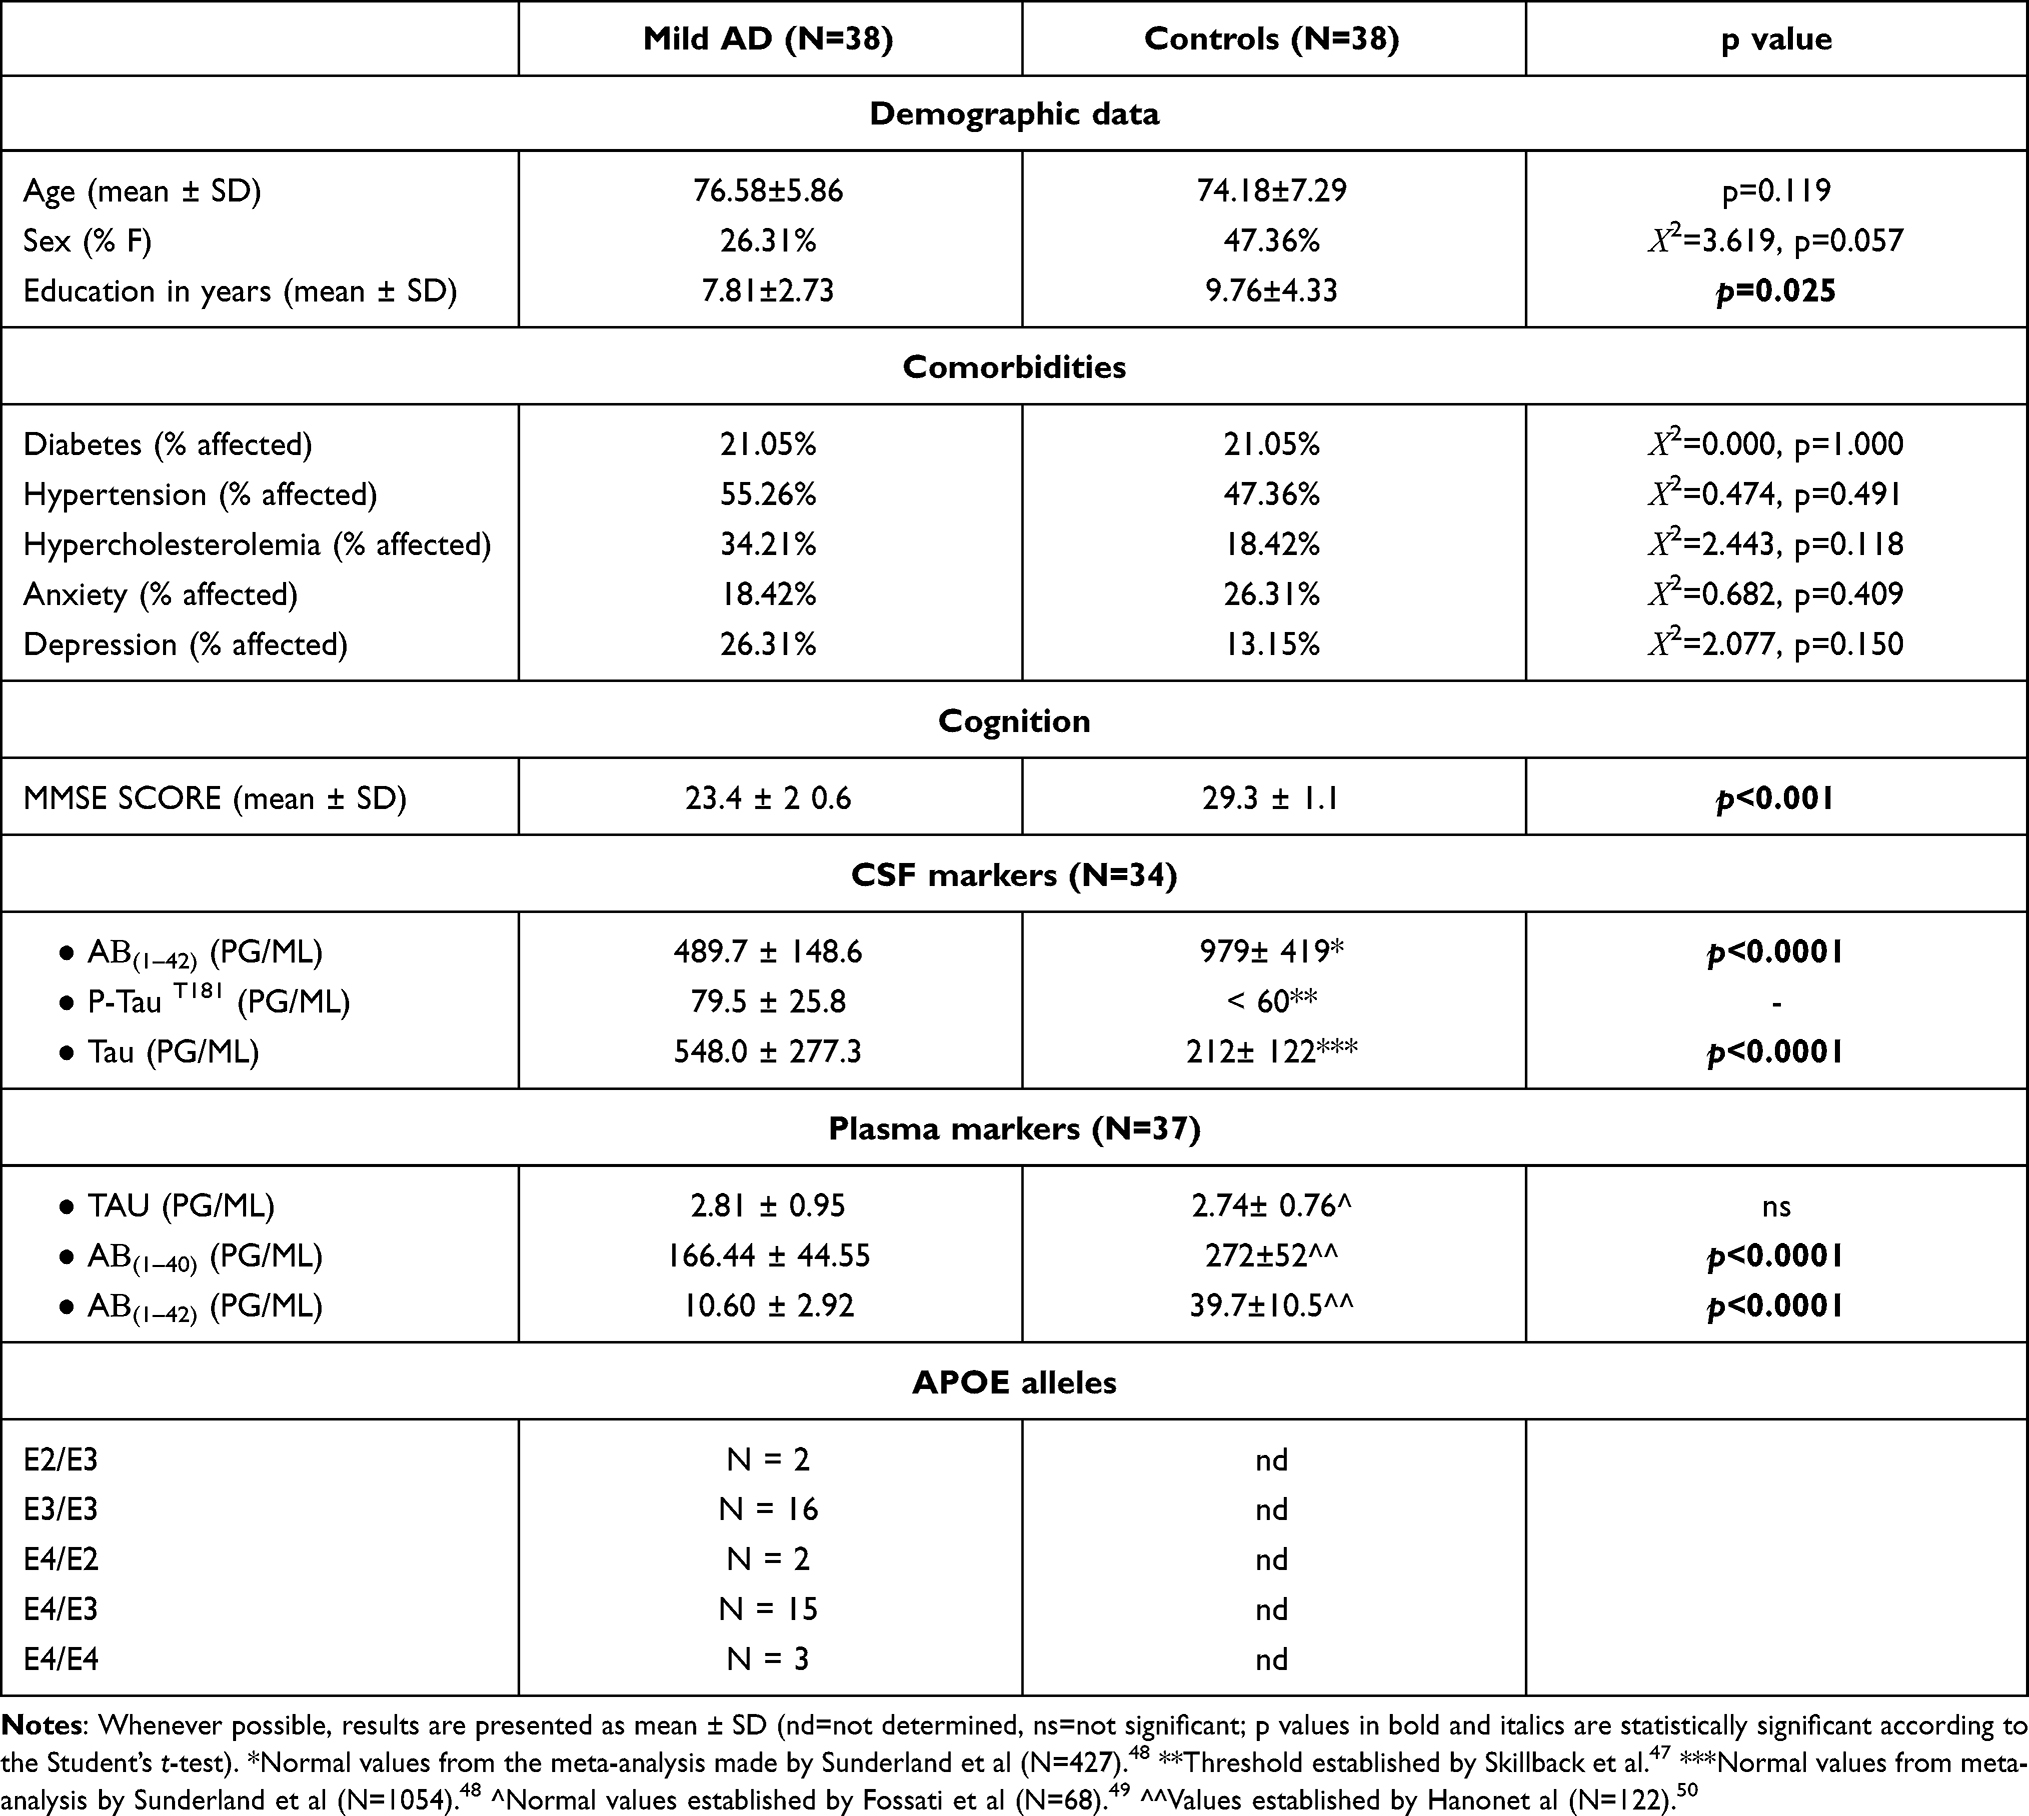 |
Table 1 Demographic, Clinical and Biochemical Characteristics of the Investigated Patients and Controls |
AD-Specific Biomarkers in CSF and Plasma
CSF samples were collected between 8:00 and 10:00 a.m. to avoid variations related to the circadian rhythm. The samples were collected in polypropylene tubes, centrifuged at 2000 × g for 10 min at 4°C, immediately frozen and stored within 4 hours in a −80°C freezer. The disease-specific biomarkers amyloid beta (Aβ(1–42)), total TAU and Thr181-phosphorylated TAU protein (p-TAUT181) in cerebrospinal fluid (CSF) were quantified using dedicated ELISA kits (Innogenetics), according to the manufacturer’s instructions. The cutoff values for these biomarkers were determined in an independent cohort of AD patients and controls in our laboratory. The cutoff values for Aβ42, total TAU, and phospho-TAU were <600 pg/mL, >425 pg/ mL, and >65 pg/mL, respectively. Total TAU, Aβ(1–40), and Aβ(1–42) levels were quantified in the plasma of AD patients using the Human Neurology 3-Plex A assay (N3PA) on the ultrasensitive Simoa HD-1 analyzer (Quanterix, Billerica, MA, USA).
APOE genotyping: DNA (20 µL) was extracted from buffy coat cells using a Maxwell® RCS blood DNA kit (Promega, USA), and APOE genotyping was performed by qRT-PCR.
Gene Expression
From each subject, 2.5 mL of venous blood were collected in PAXgene Blood RNA Tubes (Qiagen) for total RNA isolation with the PAXgene Blood miRNA Kit (Qiagen). Reverse transcription using 400 ng of RNA was performed with the RT2 First Strand Kit (Qiagen) according to the manufacturer’s protocol. The expression of 168 inflammatory genes was evaluated with the RT2 Profiler™ PCR Array Human NF-κB Signaling Pathway (PAHS-025Z, Qiagen) that addresses mainly genes involved in NFκB signaling (Supplementary Table 1), and with the RT2 Profiler™ PCR Array Human NFκB Signaling Targets (PAHS-225Z, Qiagen) that contains NFκB target genes (Supplementary Table 2). The arrays shared 22 overlapping genes that yielded essentially similar results. Eighty-four key genes involved in oxidative stress/antioxidant response (Supplementary Table 3) were analyzed with the RT2 Profiler™ PCR Array Human Oxidative Stress Plus (PAHS-065Y, Qiagen). The SYBR Green chemistry on the ABI-7500 fast instrument (Applied Biosystems) was used. The expression level of each gene was normalized with the geometric mean of HPRT1 and RPLP0, and 2−ΔCT mean values as well as and the fold change (FC) were calculated as previously described.32
Statistical Analysis
Results are presented as mean ± standard deviation (SD) or standard error of the mean (SEM). Statistical analysis was performed using SPSS 20 and GraphPad Prism 8. Since data were not normally distributed (Kolmogorov–Smirnov, p<0.05), the differences in gene expression between patients and controls were evaluated using the nonparametric Mann–Whitney U-test. The difference in gene expression was considered significant with an FC >1.5 and p < 0.05. Correlations between gene expression levels were calculated using the Pearson coefficient (r), and were considered significant with r > 0.6 and p ≤ 0.01. Receiver operating characteristic (ROC) curve was created and area under the curve (AUC) was calculated to assess the potential value of the selected transcripts in discriminating patients from controls. Principal component analysis (PCA) was performed using the web tool ClustVis33 for visualizing clustering of multivariate data. The power of our study was calculated using the G*Power 3.1.9.7 tool.34
GEO Data Mining
Gene expression data were retrieved from the Gene Expression Omnibus database (GEO) from two datasets provided from the AddNeuroMed consortium. Patient selection, design, and clinical data have been reported in previous studies.35,36 Employing the GEO2R online tool, we identified the dysregulated genes (DEGs) comparing 239 blood samples from healthy subjects (104 and 135 from GSE63060 and GSE63061, respectively) with 245 from early diagnosed patients (110 and 135 from GSE63060 and GSE63061, respectively). The intersected 5.289 DEGs with FC > 2 and Adj (p-value) <0.05 were grouped with the functional clustering tool DAVID (Database for Annotation, Visualization and Integrated Discovery) v6.7.37 Functional enrichment was considered for pathways with FC> 2 and Adj (p-value (FDR/BH) <0.05). Pathway analysis was performed with the Gene Ontology Biological Process (GOTERM_BP_DIRECT). The GSE122063 gene expression dataset reporting data on frontal and temporal cortex in human post-mortem AD and control brains was analyzed using GEO2R (http://www.ncbi.nlm.nih.gov/geo/geo2r/). Genes were considered differentially expressed with FC >1.5 and adjusted p < 0.05. The adjusted p value was calculated using the Benjamini and Hochberg procedure (the false discovery rate method) to identify the important few from the trivial many effects tested.38
Transcription Factors Analysis
Dysregulated genes (FC>1.5-fold and Adj (p-value<0.05) from inflammatory and redox panels were analyzed with the oPOSSUM (v.3.0) human single-site analysis online tool39 to determine enrichment scores and genomic positions of binding motifs for known transcription factors. The selected JASPAR core and PBM profile specificity was 8 bits. The selected parameters to perform the search were as follows: 0.4 conservation cut-off, 0.85 matrix score threshold, 5000 bp upstream and downstream of the consensus site.
Identification of NFκB Binding Sites in Redox Genes
A script for the search for transcription factor binding sites was developed in Python 3.6 and is reported in Supplementary file 1. The script uses as input a BED file containing the ChIP-seq peaks for the transcription factors of analysis, a text file containing a list of RefSeq transcripts accession numbers, and a position frequency matrix (PFM) file from the JASPAR database containing the consensus transcription factor bindingsites to be computed. Additionally, it makes use of the BED file at the UCSC Genome Browser, Table Browser resource (https://genome.ucsc.edu/cgi-bin/hgTables) containing the locations of every transcript and its RefSeq accession number in the genome. For the overlapping with active regions, a combined segmentation BED file was generated by concatenating Combined Segmentations at the UCSC Genome Browser, using BEDTools.40 This track combines segmentations of ChromHMM and Segway methods, using CTCF binding sites, histone marks (H3K27ac, H3K27me3, H3K36me3, H3K4me1, H3K4me3, H4K20me1 and H3K9ac) DNAse-seq and FAIRE-seq data from six core human cell lines in ENCODE (GM12878, H1-hESC, HeLA-S3, HepG2, HUVEC, K562). The script retrieves the genomic coordinates for the desired transcripts, extends them 5000 bp upstream of the transcription start site and intersects them with the genomic regions downloaded from ChIP-Atlas41 using the wrapper of BEDTools for Python, pybedtools.42 In this analysis, all the available sites for binding to RELA, RELB and NFKB1 were downloaded and intersected with the extended transcripts of NFKBIA, GSTP1, DUOX1, SQSTM1, GSR, and NCF1. Then, the sequences of the peaks were extracted using pybedtools from the FASTA file of the hg19 Human Genome. The profiles for human RELA, RELB and NFKB1 were downloaded from the JASPAR database43 in PFM format from the entries MA0107.1, MA1117.1, MA0105.2. Absolute frequencies are turned into a PSSM (position specific-scoring matrix), containing scores through the log2 (odds-ratio) (odds ratio: observed frequency/expected frequency). One unit was added as a pseudo-count to each absolute frequency to avoid log(0). Scoring of each site followed a similar procedure as we have previously described.44 Briefly, a sliding window of a width dependent of the profile to be used was passed over the extracted sequences. Each nucleotide in the sliding window received a score according to the PSSM and then, the score from each nucleotide was added up in order to provide an absolute score for the site. The relative score, the maximal and minimal scores were obtained with a given PSSM and computed as (absolute score + |minScore|)/(|maxScore|+|minScore|). Sites with a relative score below 0.9 were discarded, and the remaining ones were provided as a BED file. In order to detect active regions, the script makes use of pybedtools to intersect the segmentation file with the regions described as transcription start sites (TSS), weak enhancers (WE), enhancers (E) and promoter flanking (PF) regions, and returns only the sites that are active according to these criteria.
Results
We firstly analyzed whether brain damage in mild AD patients could correlate with consistent gene expression changes in peripheral blood. By pooling data from GSE63060 and GSE63061 microarray datasets,45,46 we obtained a list of dysregulated genes in the blood of 245 patients vs 239 controls. These dysregulated genes, with FC >2 and adjusted p-value (FDR/BH) <0.05, were further classified by GOTERM_BP_FAT category in functional clusters of biological processes. The analysis highlighted that genes involved in immune responses and in redox metabolism might be amongst the most dysregulated genes in the blood of AD patients (Figure 1). Therefore, we further investigated by qRT-PCR if alterations in the expression of inflammation and redox genes might occur in mild AD.
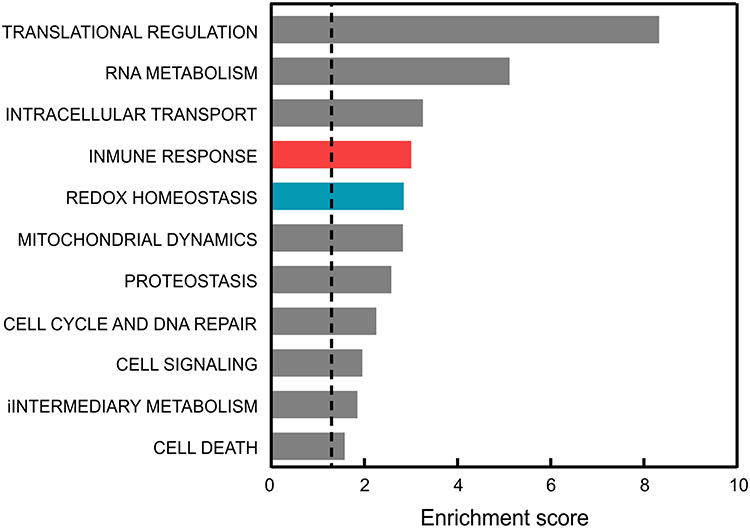 |
Figure 1 Comparison of the functional pathways altered in the blood of AD patients vs controls. Dysregulated genes were averaged from those reported in GSE63060 and GSE63061 microarray data after GEOR2 analysis. The functional annotation corresponding to biological processes (GOTERM_BP_DIRECT) was analyzed using the DAVID database.37 Significant associations (adjusted p-value (FDR/BH) <0.05) are plotted against the enrichment score. |
Altered Expression Pattern of Inflammation and Redox Genes in the Blood of Mild AD Patients
We conducted a case–control study on 38 mild AD patients and 38 controls that were highly characterized and matched in terms of age and comorbidities (Table 1). Patients were recruited during the first visit to the neurologist, before starting specific AD medication. The MMSE score, used to evaluate cognitive capabilities, exhibited lower values in AD patients as compared to controls, tended to decline progressively in these patients along consecutive years (Figure 2A). Patients exhibited in CSF abnormally high levels of TAU and phospho-TAU (p-TAUT181), along with low levels of Aβ(1–42) (Figure 2B and Table 1) as compared to normal values reported in the literature.47,48 Additionaly, plasmatic levels of the amyloid peptides Aβ(1–42) and Aβ(1–40), determined with an ultra-sensitive Quanterix-Simoa immunoassay, further demonstrated abnormally low levels of these markers in the plasma of patients (Figure 2C and Table 1).49,50
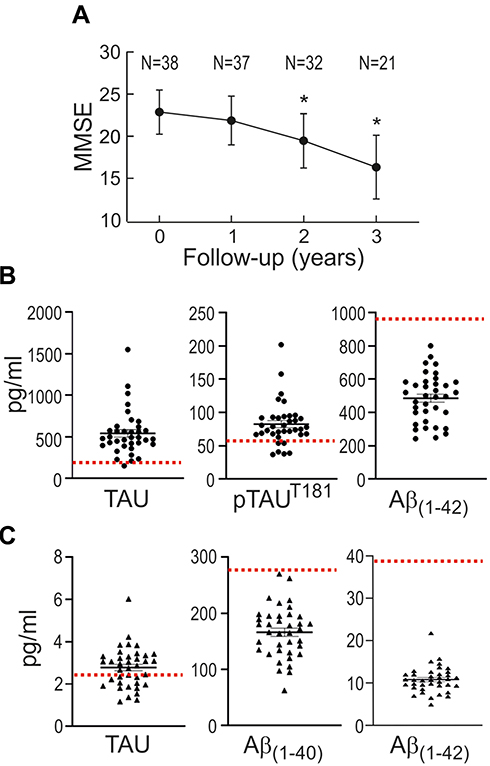 |
Figure 2 Disease-specific markers in the group of mild AD patients. (A) Evolution of the MMSE score. Patients were recruited during the first visit to the neurologist (0 time point), before starting specific AD medication. Results are expressed as mean ± SD. N is the number of patients tested for MMSE at consecutive yearly visits. *p<0.001 denotes statistically significant difference vs visit 0 (Pairwise Wilcoxon signed-rank test). (B) TAU, phosphoTAU (p-TAUT181) and Aβ(1–42) levels in CSF. Expected normal values are as follows: TAU, 212±122 pg/mL [47]; p-TAUT181 <60 pg/mL;46 Aβ(1–42), 979±419 pg/mL47. (C) Total TAU, Aβ(1–40) and Aβ(1–42) levels in plasma. Expected normal values are as follows: TAU, 74±076 pg/mL,48 Aβ(1–40), 272±52 pg/mL,49 Aβ(1–42), 39.7±10.5 pg/mL49. For B and C, values are expressed as mean ± SEM. |
A targeted gene expression screening was performed by qRT-PCR using pathway-focused arrays of 136 inflammation and 84 redox genes (Supplementary Tables 1–3). As shown in the gene expression heat maps (Figure 3), we identified 48 inflammation genes (Figure 3A) and 34 redox genes (Figure 3B) that were significantly overexpressed (FC>1.5, p<0.01) in the blood of patients vs controls. Heat maps of inflammation and redox genes with FC value <1.5 are also presented in Supplementary Figures 1 and 2, respectively.
 |
Figure 3 Heat maps of individual gene expression data in the blood of mild AD patients and controls (CTRL). (A) Inflammatory genes. (B) Redox genes. Only genes with mean FC value >1.5 and p<0.01 in the AD group vs the control group are represented. Individual FC values for each gene were obtained by dividing the 2−ΔCt value of each subject to the mean 2−ΔCt value of the control group. Data were normalized and ordered in the heat map according to the average expression levels of all the considered genes, and were scaled considering the highest value as 100%. Heat maps of inflammation and redox genes with FC value<1.5 are presented in Supplementary Figures 1 and 2, respectively. |
We compared significant alterations in gene blood expression with available GSE122063 microarray datasets of frontal and temporal cortex of AD patients and controls.51 Thirteen inflammatory and six redox genes appeared to be upregulated both in the blood and in the brain of AD patients as compared to controls (Table 2).
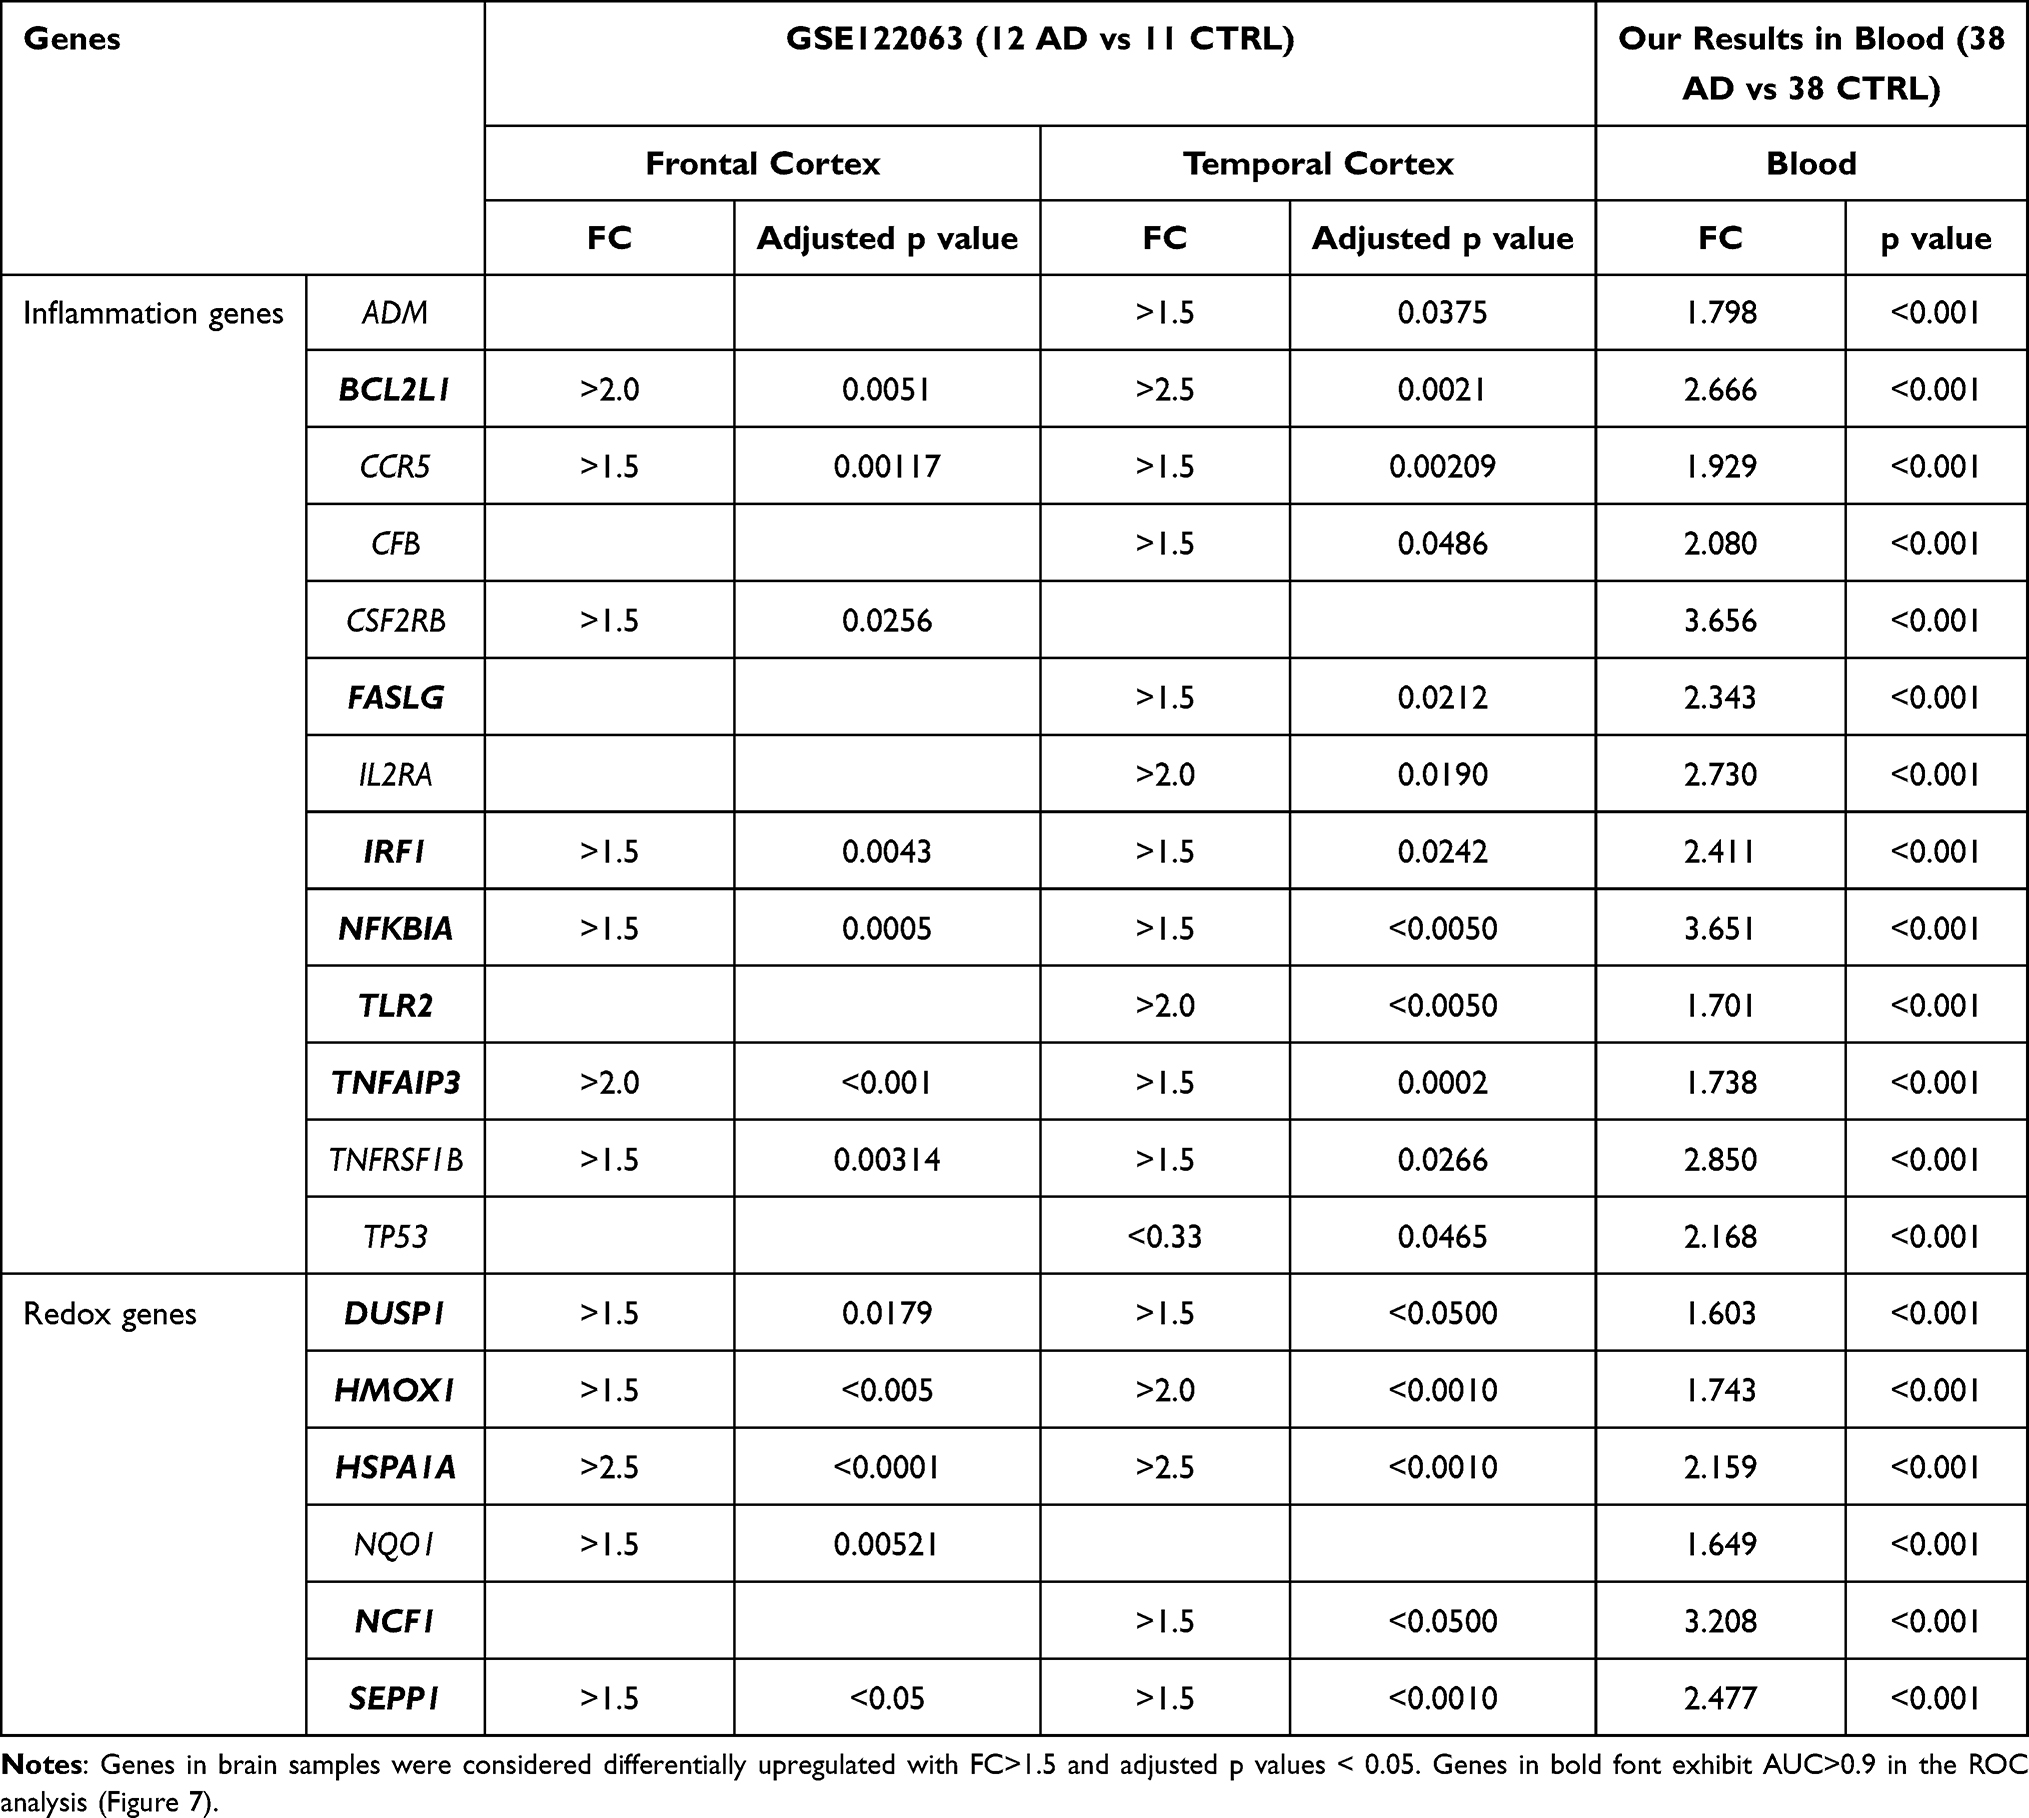 |
Table 2 Comparison of Genes Upregulated in the Blood of AD Patients (FC>1.5, p<0.01, Figure 3) and in Post-Mortem Samples of AD Brain from the GSE122063 Microarray Data Set |
In silico Identification of Transcription Factors Associated with the Altered Gene Expression Pattern Evidenced in the Blood of Mild AD Patients
The dysregulated gene expression profile indicates that the activity of some transcription factors must be altered. To identify such transcription factors, we used the oPOSSUM 3.0 software39 which provides over-represented transcription factor binding sites in the genes with altered expression (Figure 4). Among the inflammation-related transcription factors, we found sites for binding to the REL family (RELA, generic NFKB, NFKB1, REL), the ETS family (ELK1, GABPA, FEB and SPI1), the zinc finger superfamily (KLF4, SP1 and ERG1) and STAT1. Regarding redox-related transcription factors, we found binding sites for the helix-loop-helix family (ARNT: HIF1A, ARNR:AHR, MAX, MYF and EBF1), the zinc finger superfamily (ZNF354C, ERG1, ZFP423 and KLF4), two REL sites (generic NFKB and NFKB1), as well as binding sites for transcription factors encoded by NFYA, FOXF2, SRY, E2F1, MYB and NFE2L2 (Supplementary Tables 4 and 5). These results confirm the dysregulation of the NFκB pathway found in the blood of these patients, and further extend these findings to several Zinc finger and helix-loop-helix transcription factors involved in homeostatic functions. Of note, a dysregulated transcription factor found in the redox group was NFE2L2, encoding NRF2 which is a master regulator of redox homeostasis (see Discussion for a detailed analysis of altered transcription factors).
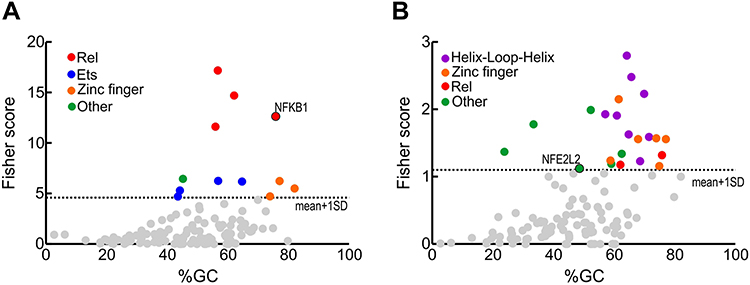 |
Figure 4 Transcription factors whose binding sites are enriched in the regulatory sequences of the genes with altered expression (FC>1.5 and p<0.05) comparing AD vs control subjects. (A) inflamatory genes from Figure 3A. (B) redox genes from Figure 3B. Identification of enriched transcription factors was done with the oPOSSUM software.39 Fisher scores are plotted vs the GC composition of the TF profile. Dashed line represents one standard deviation above the mean. Transcription factor binding with scores higher than 1±SD are highlighted in colors as indicated. |
Selection of Dysregulated Inflammation and Redox Genes
In a more restrictive gene expression analysis, we highlighted 22 inflammation genes (Figure 5) that had FC>2 and p<0.001. The overexpressed inflammation genes contribute to the canonical (NFKBIA) and non-canonical (RELB. LTA, NFKB2, TRAF2, CD40) NFκB activation pathways (Figure 5A), modulate apoptosis: TNFRSF1B, CCND1, BCL2L1, TP53, FASLG, and AKT1 (Figure 5B), are part of the interferon signalling pathway: STAT1, IRF1 and TBK1 (Figure 5C) or are involved in other signalling pathways (STAT5B) (Figure 5C), are receptors or ligands (CSF2RB, IL2RA, CFB, LTB) that are signalling via NFκB (Figure 5C) or participate in coagulation (FB and PLAU) (Figure 5D). We also detected 12 redox genes with FC > 2 and p<0.001 in the patients group as compared to controls (Figure 6). These genes encode members of the NADPH oxidases family (NCF1, DUOX1, and DUOX2) that are involved in ROS production (Figure 6A), regulate the metabolism of glutathione (GSR, GSTP1 and GPX3) and thioredoxin (TXNRD2) (Figure 6B), or perform other redox functions (FOXM1, SEPP1, HSPA1A, TRAPPC6A1A, and CCS) (Figure 6C). The fact that we found upregulation of genes involved in ROS production and detoxification, indicated a global dysregulation of redox homeostasis in the blood of mild AD patients.
 |
Figure 5 Inflammation genes with FC>2 and p<0.001, grouped according to their functional role. (A) Genes of the canonical and non-canonical NFκB pathway. (B) Genes involved in modulation of apoptosis. (C) Genes of the interferon and other inflammatory signalling pathways. (D) Genes that participate in coagulation. Mean FC values and SEM for each individual gene in AD patients and controls are also represented, as well as outlier values. |
 |
Figure 6 Redox genes with FC>2 and p<0.001, grouped according to their functional role. (A) Genes of the NADPH oxidase family, involved in ROS production. (B) Genes of glutathione and thioredoxin pathways. (C) Other genes involved in redox metabolism. Mean FC values and SEM for each individual gene in AD patients and controls are also represented, as well as outlier values. |
Receiver operating characteristic (ROC) analysis of inflammatory and redox genes with FC>2 was used for selecting those genes whose expression levels could discriminate well between patients and controls. The computation of the Area Under the Curve (AUC) evidenced nine inflammatory genes (AKT1, CSF2RB, IL2RA, NFKB2, RELB, STAT5B, TBK1, TNFRSF1B and TP53) and seven redox genes (DUOX1, FOXM1, GSR, GSTP1, NCF1, TRAPPC6A and TXNRD2) that have AUC values > 0.9 (Figure 7, Supplementary Table 6). In addition, we identified three genes with 1.5< FC <2 that also yielded high AUC values (AUC > 0.9) and might be considered potential candidates for discriminating between patients and controls (Supplementary Table 6). These genes were CCR5 (FC = 1.93, p<0.001; AUC = 0.905), RHOA (FC = 1.92, p<0.001; AUC = 0.950), and GSTZ1 (FC = 1.99, p<0.001; AUC = 0.904). Moreover, PCA for the selected inflammatory and redox genes with FC >2 and p<0.001 showed a partial separation of patients and controls, with some overlap in Principal component 1 (PCA1) that explains 66.7% of the total variance, evidencing some connections between the selected genes and mild AD. (Figure 8).
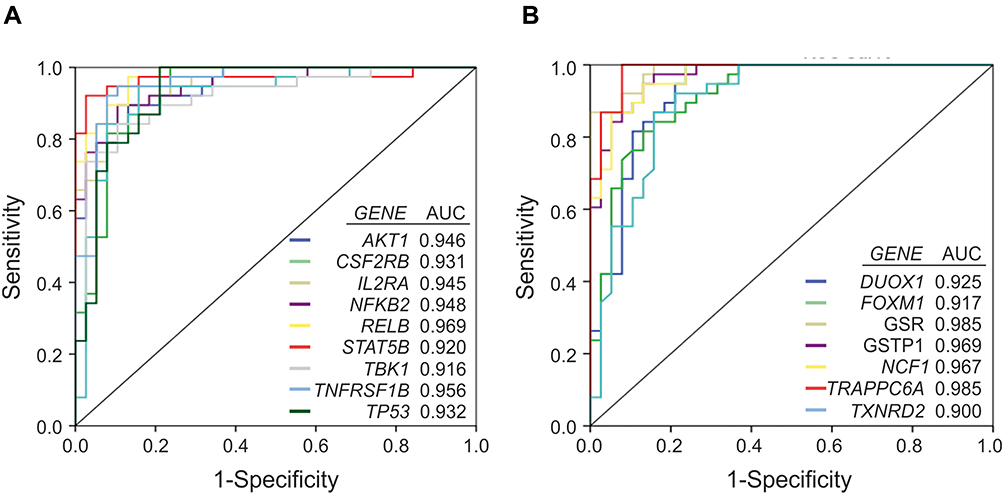 |
Figure 7 Receiver operating curve (ROC) analysis of the inflammation and redox genes that were significantly overexpressed (FC>2) in the group of AD patients vs controls, and exhibit area under the curve (AUC) values ≥ 0.9. A, inflammatory genes. B, redox genes. |
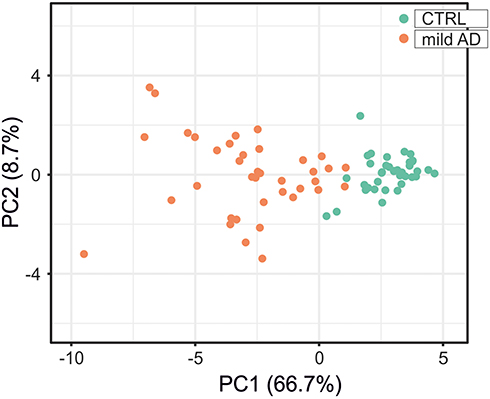 |
Figure 8 Principal component analysis for the expression level of the 19 inflammatory and redox genes selected from the ROC analysis (Figure 7). Green dots, control subjects; orange dots, AD patients. X and Y axis show principal component 1 (PCA1) and principal component 2 (PCA2) that explain 66.7% and 8.7% of the total variance, respectively. |
Associations Between Candidate Inflammation and Redox Genes
Considering that we have found alterations in both inflammation and redox genes, and that the oPOSSUM analysis suggests that some of these genes might share common transcription factors, we analyzed inter-pathway correlations between some of the most significantly overexpressed inflammation and redox genes. Among inflammation genes, NFKBIA was chosen because it is also upregulated in the AD frontal and temporal cortex (Table 2), and RELB because of its high FC value (FC>3). Albeit not being clearly upregulated in blood, RELA was analyzed because it is a master regulator of the canonical NFκB activation pathway and a critical regulator of NFKBIA expression.52,53 Regarding redox metabolism, we chose some of the most well-established genes regulated by the transcription factor NRF2, which is the master regulator of antioxidant defense and is critically involved in resolution of inflammation.54 These genes included GSR (FC=3.93, p<0.001), GSTP1 (FC=2.48, p<0.001) and SQSTM1 (FC=1.88, p<0.001). Moreover, we analyzed two genes involved in ROS production: NCF1 (FC = 3.21, p<0.001) and DUOX1 (FC = 3.13, p<0.001). As shown in Figure 9, the selected inflammatory and redox genes exhibited good correlations (Pearson r>0.6 and p<0.001) that indicate an association between these dysregulated inflammation and redox genes.
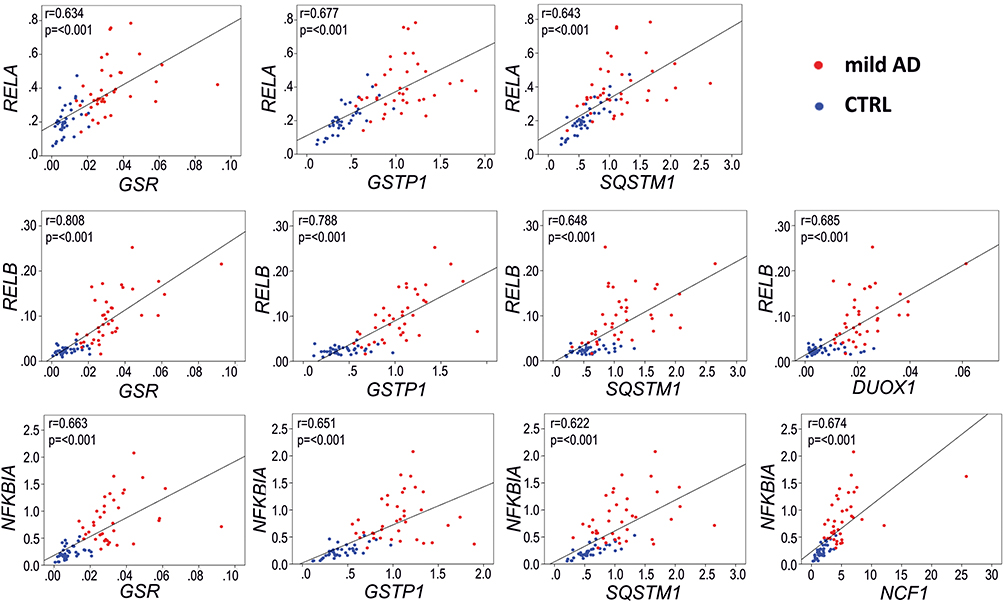 |
Figure 9 Representative Pearson correlations between inflammation and redox genes in the blood of AD patients.with the most significantly overexpressed (FC>3, p<0.001, and AUC>0.9) inflammation and redox genes. Note the high correlation in expression between the inflammation-related genes RELB and NFKB1A, regulated by transcription factor RELA, and three redox genes, GSR, GSTP1 and SQSTM1, regulated by the transcription factor NRF2. Blue dots, control group; red dots, AD group. Gene expression data are presented as 2−∆Ct values. |
To elucidate if there are also mechanistic relationships in addition to the associations presented above, we conducted an analysis of the transcription factor binding sites for RELA/p65, RELB and NFKB1/p105 (Supplemental Table 7). We used the ChIP-seq experimental data from ChIP-Atlas,41 and we developed a Python script able to scan a set of genomic regions using a position-specific scoring matrix (PSSM) computed from profiles in the JASPAR database43 for transcription factor binding sites that are active according to the Combined ChromHMM and Segway segmentation.55 We then scanned the ChIP-seq sites within RELA, RELB and NFKB1 with their respective PSSMs. Our script retrieved several already known transcription binding sites for RELA, RELB and NFKB1 (relative score >90%) in the NFKBIA gene,56–59 that we used as a positive control. We also found an already described binding site for RELA and NFKB1 in the promoter of GSTP160 and two additional binding sites: one overlapping with the first, but in the antisense direction, and another one ~2 kb upstream. One binding site for RELA was detected for the DUOX1 gene in an enhancer region, and four novel binding sites for NFKB1 were found in the promoter region of the autophagy-related gene SQSTM1. This evidence suggests that GSTP1, DUOX1 and SQSTM1 are NFκB-regulated genes and their expression was found upregulated in the blood of mild AD patients (Figure 3B and Figure 6A and B).
Discussion
This study aimed to determine if transcriptional alterations of inflammation and redox genes in whole blood could provide a molecular signature for mild AD patients as compared to age-matched controls. Because these gene expression changes might be common to various other chronic diseases, the observed alterations cannot be used for diagnostic purposes but rather as 1) evidence that blood leukocytes develop systemic inflammatory and oxidative responses in these patients, 2) identification of the most dysregulated inflammatory and redox pathways in the blood of mild AD patients, 3) correlation with reported brain alterations in AD, 4) identification of the transcription factors responsible for these alterations.
This clinical case–control study pointed out a distinctive gene expression profile in the blood of mild AD patients. We identified 48 inflammation genes and 34 redox genes that were upregulated in the blood of these patients.
In an attempt to identify the transcription factors that might account for these alterations, we used the oPOSSUM software that identifies common transcription factor binding sites in the dysregulated genes. As expected, we found the participation of NFκB among the inflammation genes but, interestingly, also among the redox genes. The involvement of the transcription factor NRF2, master regulator of redox homeostasis, was expected but, somewhat surprisingly, its transcriptional activity was at the limit of statistical significance. This probably reflects that most of the investigated redox genes already have a robust basal expression, and NRF2 induces most likely a modest but still very relevant response to inflammation. We found that several inflammation and redox genes dysregulated in the investigated cohort presented binding sites for zinc fingers proteins. It has been long known that trace metals, such as zinc, are impacting on protein aggregation, synaptic signaling, mitochondrial function, oxidative stress and inflammation, ultimately resulting in synapse dysfunction and neuronal loss in the AD brain.61 It was shown that zinc status alters AD progression through NLRP3-dependent inflammation,62 and zinc dyshomeostasis has been reported in the plasma of AD patients.63 Another intriguing finding was the very significant contribution of helix-loop-helix transcription factors to the dysregulated redox gene expression pattern. It is particularly interesting the case of ARNT/HIF1α, related to the hypoxic response,64 and of ARNT/AHR,65 involved in ageing and inflammation. Increased HIF-1-mediated expression of target genes, such as those related to glycolysis or blood flow, may be an adaptive response to oxidative stress in AD pathology.66 Regarding AHR, its levels were shown to be increased in astrocytes of hippocampal post-mortem tissues and in the serum of AD patients.67
Substantial overexpression (FC>2, p<0.001) was registered in the blood of the investigated AD patients for 22 inflammation and 12 redox genes that are involved in several distinctive functions. Very relevant is the dysregulation of the non-canonical NFκB signaling pathway, including the CD40 receptor and the members of the tumor necrosis factor family, lymphotoxin alpha and beta,68 as well as core modulators of inflammatory genes such as RELB, NFKB2 and TRAF2. Considering that the non-canonical pathway requires de novo protein synthesis69 overexpression of these genes points out an ongoing inflammatory process. On the other hand, the NFKBIA gene, that inhibits the canonical NFκB pathway, was found significantly upregulated in our blood analysis as well as in the frontal and temporal cortex of AD patients (Table 2). NFKBIA contains several κB-responsive elements that participate in a negative feedback control of the canonical pathway, and therefore NFKBIA upregulation might reflect an activation of the canonical pathway. This pathway is widely regulated through post-transcriptional protein processing by phosphorylation, sumoylation and ubiquitination of RELA, and not at transcriptional level.70 Accordingly, our results do not exclude a combined activation of both canonical and non-canonical NFκB signaling pathways. In fact, because non-canonical NFκB activation requires an early contribution of the canonical signaling cascade,71 results indicate that the canonical NFκB pathway might be indeed activated in the blood of the investigated patients.
We found dysregulation of the interferon signaling pathway at the level of IRF1, TBK1 and STAT1 in the blood of the investigated AD patients. High expression levels of IRF1 were also found in the AD brain, in the frontal and temporal cortex (Table 2). The TANK binding kinase 1 (TBK1) is an IκB kinase (IKK) involved in the regulation of type I interferons and NFκB signal transduction triggered by pathogens and endogenous stimuli.72 In the brain, TBK1 may promote TAU hyperphosphorylation and neuronal loss in AD and related tauopathies. Our findings also evidence the enhanced transcription of two genes under the NFκB transcriptional control, that encode members of the STAT protein family of transcription factors (STAT1 and STAT5) and are involved in many aspects of cellular immunity, proliferation, apoptosis, and differentiation.73 Moreover, STAT1 can regulate the expression of β secretase 1 for the generation of Aβ peptides,74 while STAT5 seems to regulate microglial activation.75
Apoptosis-modulating NFκB targets were also found overexpressed in the blood of the investigated AD patients, including the genes encoding the pro/anti-apoptotic Bcl-2-like protein 1 (BCL2L1) and AKT1, as well as the apoptosis inducer Fas ligand (FASLG). GEO data mining evidenced that BCL2L1 and FASLG have been found overexpressed also in the cortex of AD patients (Table 2), contributing to cell death and neurodegeneration. In addition, it has been shown that higher counts of apoptotic peripheral leukocytes were registered in AD patients, probably accounting, at least partially, for their increased susceptibility to infections.76
Besides inflammation, a distinctive redox status was evidenced at transcriptional level in the blood of the investigated AD patients. Significant overexpression of genes involved in superoxide metabolism included the NADPH oxidases NOX2 (the p47phox component encoded by NCF1), DUOX1 and DUOX2, as well as the copper chaperone for superoxide dismutase (CCS) involved in the activation of cytoplasmic copper/zinc superoxide dismutase-1. These results point towards an increased production of reactive oxygen species (ROS) in the blood of mild AD patients. Consistent with this, we found overexpression (FC>1.5) of several antioxidant genes that are directly or indirectly regulated by the transcription factor NRF2. Among bona fide NRF2 target genes,77 we identified several genes involved in glutathione (GSH) metabolism, such as the cysteine-glutamate exchanger Xc(-) that provides cysteine for GSH synthesis (SLC7A11),78 GSH regeneration (GSR)79 and GSH use in antioxidant responses (GPX2, GPX3, GSTP1, GSTZ1).80 Noteworthy, it has been recently demonstrated in vivo that glutathione levels in specific brain regions, measured by magnetic resonance spectroscopy, is a clinically relevant biomarker in AD.81 We also found increased expression of genes involved in thioredoxin metabolism (TXNRD1),77 or encoding antioxidant peroxiredoxins (PRDX2),82 NAD(P)H quinone oxidoreductase (NQO1),83 heme oxygenase 1 (HMOX1),83 and autophagy cargo receptor p62 (SQSTM1).84 Among these NRF2 responsive genes, at least NQO1 and HMOX1 were found to be overexpressed also in post-mortem frontal or temporal cortex of AD patients.85
The stepwise selection procedure applied to the investigated inflammation and redox genes brought to the forefront a panel of nine inflammation and seven redox genes that were significantly overexpressed (FC>2), and discriminate between patients and controls according to the ROC and PCA analyses. Moreover, the inter-pathway correlation studies indicated potential functional association between at least some of these inflammation and redox genes. Mechanistically, we have highlighted for the first time the regulation by RELA of two genes involved in ROS production (DUOX1) and in GSH regeneration (GSR). Moreover, two NRF2 target genes, the antioxidant GSTP1 gene and the autophagy-related SQSTM1 gene, were correlated with NFKB1 expression level, indicating a sophisticated crosstalk between oxidative stress, inflammation and autophagy.86 Autophagy impairment has been shown to play a critical role in AD by accretion of noxious proteins in the brain,87 and also in shaping both the systemic innate and adaptive immune responses, including antigen presentation.88
A coordinated modulation of ROS metabolism and inflammation in the blood of mild AD patients is suggested. Nevertheless, the present study, which is based on gene expression, can only evidence gene associations but cannot substantiate functional interferences between the identified inflammation and redox genes, beyond the known redox-control of the transcriptional activity of NFκB.89,90
Summarizing, the reported alterations provide a gene expression signature in the blood of mild AD patients that, albeit not being specific for this pathology, certainly emphasizes the relevance of blood inflammatory and redox disturbances in AD. The gene expression changes registered in the blood of mild AD patients are indicative of possible systemic immune disturbances, especially at the level of the innate immunity. These disturbances are seemingly not due to ageing, considering that age-matched individuals constituted the control group.
Despite the well-characterized and homogeneous cohorts used in this study, the main limitation is represented by the small sample size. Power analysis results (Power 1-β error=0.56, α=0.05), obtained using the G*Power tool, impose future investigations in larger independent cohorts for validating the most relevant findings of this study and for avoiding the risk of over-fitting. Additionally, investigations at protein and cellular functional level are needed to clearly demonstrate the impact of the identified gene expression changes on the peripheral immune response and the connection with the pathological processes in AD brain,91 in the context of leukocyte trafficking to the brain through the compromised blood–brain barrier.92
Conclusion
This gene expression study brings new evidence on the activation of inflammatory pathways accompanied by increased redox activity and regulation in the blood of mild AD patients. The reported alterations of signaling pathways in blood leukocytes might have consequences on immune competence and neurodegeneration in mild AD, but this has to be demonstrated in future studies. Besides NFκB, several other transcription factors, including zinc finger and helix-loop-helix proteins, as well as the cytoprotective NRF2 transcription factor may underlie the altered transcriptional profile of inflammation and redox genes in mild AD. We highlight for the first time the potential contribution of RELA to the enhanced expression of the redox genes DUOX1 and GSR. Altogether, the selected nine inflammation and seven redox genes might be promising therapeutic targets, and, in conjunction with disease-specific markers, could also represent valuable tools for monitoring new adjunctive therapeutic approaches targeted towards inflammation and redox disturbances in mild AD.
Availability of Data and Materials
Supporting data are available from the corresponding authors upon reasonable request
Ethics Approval and Consent to Participate
The study was conducted in accordance with the Declaration of Helsinki and was approved by the ethics committee Hospital Arnau de Vilanova de Lleida, Lleida, Spain – CE 1218. Written informed consent was obtained from all study participants at the moment of recruitment and blood collection.
Acknowledgment
We thank Aitor Palomino for technical support.
Author Contributions
All authors contributed to data analysis, drafting or revising the article, gave final approval of the version to be published, agreed to the submitted journal, and agree to be accountable for all aspects of the work. Elena Milanesi and Maria Dobre contributed equally and thus share first authorship.
Funding
Research and publication of the present study was funded by the Romanian Ministry of Research, Innovation and Digitization through the European Regional Development Fund, Competitiveness Operational Program 2014–2020 [the REDBRAIN project, ID: P_37_732].
Disclosure
Antonio Cuadrado reports grants from European Commission during the conduct of the study. The authors report no other potential conflicts of interest for this work.
References
1. Kolanko MA, Win Z, Loreto F, et al. Amyloid PET imaging in clinical practice. Pract Neurol. 2020;20(6):451–462. doi:10.1136/practneurol-2019-002468
2. McKhann GM, Knopman DS, Chertkow H, et al. The diagnosis of dementia due to Alzheimer’s disease: recommendations from the National Institute on Aging-Alzheimer’s Association workgroups on diagnostic guidelines for Alzheimer’s disease. Alzheimers Dement. 2011;7(3):263–269. doi:10.1016/j.jalz.2011.03.005
3. Dubois B, Feldman HH, Jacova C, et al. Advancing research diagnostic criteria for Alzheimer’s disease: the IWG-2 criteria. Lancet Neurol. 2014;13(6):614–629. doi:10.1016/S1474-4422(14)70090-0
4. Toledo JB, Xie SX, Trojanowski JQ, Shaw LM. Longitudinal change in CSF Tau and Aβ biomarkers for up to 48 months in ADNI. Acta Neuropathol. 2013;126(5):659–670. doi:10.1007/s00401-013-1151-4
5. Sutphen CL, McCue L, Herries EM, et al. Longitudinal decreases in multiple cerebrospinal fluid biomarkers of neuronal injury in symptomatic late onset Alzheimer’s disease. Alzheimers Dement. 2018;14(7):869–879. doi:10.1016/j.jalz.2018.01.012
6. Park SA, Han SM, Kim CE. New fluid biomarkers tracking non-amyloid-β and non-tau pathology in Alzheimer’s disease. Exp Mol Med. 2020;52(4):556–568. doi:10.1038/s12276-020-0418-9
7. Gaetani L, Blennow K, Calabresi P, Di Filippo M, Parnetti L, Zetterberg H. Neurofilament light chain as a biomarker in neurological disorders. J Neurol Neurosurg Psychiatry. 2019;90(8):870–881. doi:10.1136/jnnp-2018-320106
8. Guarner V, Rubio-Ruiz ME. Low-grade systemic inflammation connects aging, metabolic syndrome and cardiovascular disease. Interdiscip Top Gerontol. 2015;40:99–106. doi:10.1159/000364934
9. Guzman-Martinez L, Maccioni RB, Andrade V, Navarrete LP, Pastor MG, Ramos-Escobar N. Neuroinflammation as a common feature of neurodegenerative disorders. Front Pharmacol. 2019;10:1008. doi:10.3389/fphar.2019.01008
10. Kinney JW, Bemiller SM, Murtishaw AS, Leisgang AM, Salazar AM, Lamb BT. Inflammation as a central mechanism in Alzheimer’s disease. Alzheimers Dement. 2018;4:575–590. doi:10.1016/j.trci.2018.06.014
11. Onyango IG, Jauregui GV, Čarná M, Bennett JP, Stokin GB. Neuroinflammation in Alzheimer’s disease. Biomedicines. 2021;9(5):524. doi:10.3390/biomedicines9050524
12. Milind N, Preuss C, Haber A, et al. Transcriptomic stratification of late-onset Alzheimer’s cases reveals novel genetic modifiers of disease pathology. PLOS Genet. 2020;16(6):e1008775. doi:10.1371/journal.pgen.1008775
13. Passamonti L, Tsvetanov KA, Jones PS, et al. Neuroinflammation and functional connectivity in Alzheimer’s disease: interactive influences on cognitive performance. J Neurosci. 2019;39(36):7218–7226. doi:10.1523/JNEUROSCI.2574-18.2019
14. Fu W-Y, Wang X, Ip NY. Targeting neuroinflammation as a therapeutic strategy for Alzheimer’s disease: mechanisms, drug candidates, and new opportunities. ACS Chem Neurosci. 2019;10(2):872–879. doi:10.1021/acschemneuro.8b00402
15. Chen X, Hu Y, Cao Z, Liu Q, Cheng Y. Cerebrospinal fluid inflammatory cytokine aberrations in Alzheimer’s Disease, Parkinson’s disease and amyotrophic lateral sclerosis: a systematic review and meta-analysis. Front Immunol. 2018;9:2122. doi:10.3389/fimmu.2018.02122
16. Suárez-Calvet M, Capell A, Araque Caballero MÁ, et al. CSF progranulin increases in the course of Alzheimer’s disease and is associated with sTREM2, neurodegeneration and cognitive decline. EMBO Mol Med. 2018;10(12). doi:10.15252/emmm.201809712
17. Lovell MA, Markesbery WR. Oxidative DNA damage in mild cognitive impairment and late-stage Alzheimer’s disease. Nucleic Acids Res. 2007;35(22):7497–7504. doi:10.1093/nar/gkm821
18. Feng Y, Wang X. Antioxidant therapies for Alzheimer’s disease. Oxid Med Cell Longev. 2012;2012:472932. doi:10.1155/2012/472932
19. Mecocci P, MacGarvey U, Beal MF. Oxidative damage to mitochondrial DNA is increased in Alzheimer’s disease. Ann Neurol. 1994;36(5):747–751. doi:10.1002/ana.410360510
20. Sakakibara R, Kawai T. Cerebrospinal fluid oxidative stress markers in Alzheimer’s disease. Neurol Clin Neurosci. 2020;8(5):232–240. doi:10.1111/ncn3.12413
21. Bubici C, Papa S, Dean K, Franzoso G. Mutual cross-talk between reactive oxygen species and nuclear factor-kappa B: molecular basis and biological significance. Oncogene. 2006;25(51):6731–6748. doi:10.1038/sj.onc.1209936
22. Verdile G, Keane KN, Cruzat VF, et al. Inflammation and oxidative stress: the molecular connectivity between insulin resistance, obesity, and Alzheimer’s disease. Mediators Inflamm. 2015;2015:105828. doi:10.1155/2015/105828
23. Mattke S, Cho SK, Bittner T, Hlávka J, Hanson M. Blood-based biomarkers for Alzheimer’s pathology and the diagnostic process for a disease-modifying treatment: projecting the impact on the cost and wait times. Alzheimers Dement. 2020;12(1):e12081. doi:10.1002/dad2.12081
24. Leuzy A, Cullen NC, Mattsson-Carlgren N, Hansson O. Current advances in plasma and cerebrospinal fluid biomarkers in Alzheimer’s disease. Curr Opin Neurol. 2021;34(2):266–274. doi:10.1097/WCO.0000000000000904
25. Franceschi C, Campisi J. Chronic inflammation (Inflammaging) and its potential contribution to age-associated diseases. Journals Gerontol Ser A Biol Sci Med Sci. 2014;69(Suppl 1):S4–S9. doi:10.1093/gerona/glu057
26. Jha NK, Jha SK, Kar R, Nand P, Swati K, Goswami VK. Nuclear factor-kappa β as a therapeutic target for Alzheimer’s disease. J Neurochem. 2019;150(2):113–137. doi:10.1111/jnc.14687
27. Leandro GS, Evangelista AF, Lobo RR, Xavier DJ, Moriguti JC, Sakamoto-Hojo ET. Changes in expression profiles revealed by transcriptomic analysis in peripheral blood mononuclear cells of Alzheimer’s disease patients. J Alzheimers Dis. 2018;66(4):1483–1495. doi:10.3233/JAD-170205
28. Paouri E, Georgopoulos S. Systemic and CNS Inflammation crosstalk: implications for Alzheimer’s disease. Curr Alzheimer Res. 2019;16(6):559–574. doi:10.2174/1567205016666190321154618
29. Lee T, Lee H. Prediction of Alzheimer’s disease using blood gene expression data. Sci Rep. 2020;10(1):3485. doi:10.1038/s41598-020-60595-1
30. Phongpreecha T, Fernandez R, Mrdjen D, et al. Single-cell peripheral immunoprofiling of Alzheimer’s and Parkinson’s diseases. Sci Adv. 2020;6(48). doi:10.1126/sciadv.abd5575
31. Folstein MF, Folstein SE, McHugh PR, “Mini-mental state”. A practical method for grading the cognitive state of patients for the clinician. J Psychiatr Res. 1975;12(3):189–198. doi:10.1016/0022-3956(75)90026-6
32. Milanesi E, Manda G, Dobre M, et al. Distinctive under-expression profile of inflammatory and redox genes in the blood of elderly patients with cardiovascular disease. J Inflamm Res. 2021;14:429–442. doi:10.2147/JIR.S280328
33. Metsalu T, Vilo J. ClustVis: a web tool for visualizing clustering of multivariate data using principal component analysis and heatmap. Nucleic Acids Res. 2015;43(W1):W566–70. doi:10.1093/nar/gkv468
34. Faul F, Erdfelder E, Buchner A, Lang A-G. Statistical power analyses using G*Power 3.1: tests for correlation and regression analyses. Behav Res Methods. 2009;41(4):1149–1160. doi:10.3758/BRM.41.4.1149
35. Lovestone S, Francis P, Kloszewska I, et al. AddNeuroMed–the European collaboration for the discovery of novel biomarkers for Alzheimer’s disease. Ann N Y Acad Sci. 2009;1180(1):36–46. doi:10.1111/j.1749-6632.2009.05064.x
36. Lunnon K, Ibrahim Z, Proitsi P, et al. Mitochondrial dysfunction and immune activation are detectable in early Alzheimer’s disease blood. J Alzheimers Dis. 2012;30(3):685–710. doi:10.3233/JAD-2012-111592
37. Dennis G, Sherman BT, Hosack DA, et al. DAVID: database for annotation, visualization, and Integrated discovery. Genome Biol. 2003;4(5):P3.
38. Benjamini Y. Discovering the false discovery rate. J R Stat Soc Ser B. 2010;72(4):405–416. doi:10.1111/j.1467-9868.2010.00746.x
39. Kwon AT, Arenillas DJ, Worsley Hunt R, Wasserman WW. POSSUM-3: advanced analysis of regulatory motif over-representation across genes or ChIP-Seq datasets. G3 (Bethesda). 2012;2(9):987–1002. doi:10.1534/g3.112.003202
40. Quinlan AR, Hall IM. BEDTools: a flexible suite of utilities for comparing genomic features. Bioinformatics. 2010;26(6):841–842. doi:10.1093/bioinformatics/btq033
41. Oki S, Ohta T, Shioi G, et al. ChIP-Atlas: a data-mining suite powered by full integration of public ChIP-seq data. EMBO Rep. 2018;19(12). doi:10.15252/embr.201846255
42. Dale RK, Pedersen BS, Quinlan AR. Pybedtools: a flexible Python library for manipulating genomic datasets and annotations. Bioinformatics. 2011;27(24):3423–3424. doi:10.1093/bioinformatics/btr539
43. Fornes O, Castro-Mondragon JA, Khan A, et al. JASPAR 2020: update of the open-access database of transcription factor binding profiles. Nucleic Acids Res. 2020;48(D1):D87–D92. doi:10.1093/nar/gkz1001
44. Pajares M, Jiménez-Moreno N, García-Yagüe ÁJ, et al. Transcription factor NFE2L2/NRF2 is a regulator of macroautophagy genes. Autophagy. 2016;12(10):1902–1916. doi:10.1080/15548627.2016.1208889
45. Naughton BJ, Duncan FJ, Murrey DA, et al. Blood genome-wide transcriptional profiles reflect broad molecular impairments and strong blood-brain links in Alzheimer’s disease. J Alzheimers Dis. 2015;43(1):93–108. doi:10.3233/JAD-140606
46. Maes OC, Xu S, Yu B, Chertkow HM, Wang E, Schipper HM. Transcriptional profiling of Alzheimer blood mononuclear cells by microarray. Neurobiol Aging. 2007;28(12):1795–1809. doi:10.1016/j.neurobiolaging.2006.08.004
47. Skillbäck T, Farahmand BY, Rosén C, et al. Cerebrospinal fluid tau and amyloid-β1-42 in patients with dementia. Brain. 2015;138(Pt9):2716–2731. doi:10.1093/brain/awv181
48. Sunderland T, Linker G, Mirza N, et al. Decreased beta-amyloid1-42 and increased tau levels in cerebrospinal fluid of patients with Alzheimer disease. JAMA. 289(16):2094–2103. doi:10.1001/jama.289.16.2094
49. Fossati S, Ramos Cejudo J, Debure L, et al. Plasma tau complements CSF tau and P-tau in the diagnosis of Alzheimer’s disease. Alzheimers Dement. 2019;11:483–492. doi:10.1016/j.dadm.2019.05.001
50. Hanon O, Vidal J-S, Lehmann S, et al. Plasma amyloid levels within the Alzheimer’s process and correlations with central biomarkers. Alzheimers Dement. 2018;14(7):858–868. doi:10.1016/j.jalz.2018.01.004
51. McKay EC, Beck JS, Khoo SK, et al. Peri-infarct upregulation of the oxytocin receptor in vascular dementia. J Neuropathol Exp Neurol. 2019;78(5):436–452. doi:10.1093/jnen/nlz023
52. Huang TT, Miyamoto S. Postrepression activation of NF-kappaB requires the amino-terminal nuclear export signal specific to IkappaBalpha. Mol Cell Biol. 2001;21(14):4737–4747. doi:10.1128/MCB.21.14.4737-4747.2001
53. Cheng Q, Cant CA, Moll T, et al. NK-kappa B subunit-specific regulation of the I kappa B alpha promoter. J Biol Chem. 1994;269(18):13551–13557.
54. Saha S, Buttari B, Panieri E, Profumo E, Saso L. An overview of Nrf2 signaling pathway and its role in inflammation. Molecules. 2020;25(22):5474. doi:10.3390/molecules25225474
55. Vavrik ZM, Gonchar’ MG, Dudik IV, Zelenetskiĭ RG, Kulevnik II. [Teaching surgery at a stomatologic faculty]. Klin Khir. 1988;(11):41–43. Available from: http://www.ncbi.nlm.nih.gov/pubmed/3221638. Russian
56. Brown K, Park S, Kanno T, Franzoso G, Siebenlist U. Mutual regulation of the transcriptional activator NF-kappa B and its inhibitor, I kappa B-alpha. Proc Natl Acad Sci U S A. 1993;90(6):2532–2536. doi:10.1073/pnas.90.6.2532
57. Pasparakis M, Luedde T, Schmidt-Supprian M. Dissection of the NF-kappaB signalling cascade in transgenic and knockout mice. Cell Death Differ. 2006;13(5):861–872. doi:10.1038/sj.cdd.4401870
58. Ferreiro DU, Komives EA. Molecular mechanisms of system control of NF-kappaB signaling by IkappaBalpha. Biochemistry. 2010;49(8):1560–1567. doi:10.1021/bi901948j
59. Gao Z, Chiao P, Zhang X, et al. Coactivators and corepressors of NF-kappaB in IkappaB alpha gene promoter. J Biol Chem. 2005;280(22):21091–21098. doi:10.1074/jbc.M500754200
60. Morceau F, Duvoix A, Delhalle S, Schnekenburger M, Dicato M, Diederich M. Regulation of glutathione S-transferase P1-1 gene expression by NF-kappaB in tumor necrosis factor alpha-treated K562 leukemia cells. Biochem Pharmacol. 2004;67(7):1227–1238. doi:10.1016/j.bcp.2003.10.036
61. De Benedictis CA, Vilella A, Grabrucker AM. The role of trace metals in Alzheimer’s disease; 2019. Available from: http://www.ncbi.nlm.nih.gov/pubmed/31895516.
62. Rivers-Auty J, Tapia VS, White CS, et al. Zinc status alters Alzheimer’s disease progression through NLRP3-dependent inflammation. J Neurosci. 2021;41(13):3025–3038. doi:10.1523/JNEUROSCI.1980-20.2020
63. Ashraf A, Stosnach H, Parkes HG, et al. Pattern of altered plasma elemental phosphorus, calcium, zinc, and iron in Alzheimer’s disease. Sci Rep. 2019;9(1):3147. doi:10.1038/s41598-018-37431-8
64. Chilov D, Camenisch G, Kvietikova I, Ziegler U, Gassmann M, Wenger RH, Induction and nuclear translocation of hypoxia-inducible factor-1 (HIF-1): heterodimerization with ARNT is not necessary for nuclear accumulation of HIF-1alpha. J Cell Sci. 1999;112(Pt 8):1203–1212. doi:10.1242/jcs.112.8.1203
65. Brinkmann V, Ale-Agha N, Haendeler J, Ventura N. The Aryl hydrocarbon receptor (AhR) in the aging process: another puzzling role for this highly conserved transcription factor. Front Physiol. 2019;10:1561. doi:10.3389/fphys.2019.01561
66. Iyalomhe O, Swierczek S, Enwerem N, et al. The role of hypoxia-inducible factor 1 in mild cognitive impairment. Cell Mol Neurobiol. 2017;37(6):969–977. doi:10.1007/s10571-016-0440-6
67. Ramos-García NA, Orozco-Ibarra M, Estudillo E, et al. Aryl hydrocarbon receptor in post-mortem hippocampus and in serum from young, elder, and Alzheimer’s patients. Int J Mol Sci. 2020;21(6):1983. doi:10.3390/ijms21061983
68. Cildir G, Low KC, Tergaonkar V. Noncanonical NF-κB signaling in health and disease. Trends Mol Med. 2016;22(5):414–429. doi:10.1016/j.molmed.2016.03.002
69. Meyerovich K, Fukaya M, Terra LF, Ortis F, Eizirik DL, Cardozo AK. The non-canonical NF-κB pathway is induced by cytokines in pancreatic beta cells and contributes to cell death and proinflammatory responses in vitro. Diabetologia. 2016;59(3):512–521. doi:10.1007/s00125-015-3817-z
70. Tergaonkar V. NFκB pathway: a good signaling paradigm and therapeutic target. Int J Biochem Cell Biol. 2006;38(10):1647–1653. doi:10.1016/j.biocel.2006.03.023
71. Shih VF-S, Tsui R, Caldwell A, Hoffmann A. A single NFκB system for both canonical and non-canonical signaling. Cell Res. 2011;21(1):86–102. doi:10.1038/cr.2010.161
72. Möser CV, Stephan H, Altenrath K, et al. TANK-binding kinase 1 (TBK1) modulates inflammatory hyperalgesia by regulating MAP kinases and NF-κB dependent genes. J Neuroinflammation. 2015;12(1):100. doi:10.1186/s12974-015-0319-3
73. Calò V, Migliavacca M, Bazan V, et al. STAT proteins: from normal control of cellular events to tumorigenesis. J Cell Physiol. 2003;197(2):157–168. doi:10.1002/jcp.10364
74. Lee WJ, Ham SA, Lee GH, et al. Activation of peroxisome proliferator‐activated receptor delta suppresses BACE 1 expression by up‐regulating SOCS 1 in a JAK 2/ STAT 1‐dependent manner. J Neurochem. 2019;151(3):370–385. doi:10.1111/jnc.14715
75. Di Liberto G, Pantelyushin S, Kreutzfeldt M, et al. Neurons under T cell attack coordinate phagocyte-mediated synaptic stripping. Cell. 2018;175(2):458–471.e19. doi:10.1016/j.cell.2018.07.049
76. Bergman M, Salman H, Beloosesky Y, Djaldetti M, Bessler H. Are peripheral blood cells from patients with Alzheimer disease more sensitive to apoptotic stimuli? Alzheimer Dis Assoc Disord. 2002;16(3):156–160. doi:10.1097/00002093-200207000-00005
77. Tonelli C, Chio IIC, Tuveson DA. Transcriptional regulation by Nrf2. Antioxid Redox Signal. 2018;29(17):1727–1745. doi:10.1089/ars.2017.7342
78. Koppula P, Zhang Y, Zhuang L, Gan B. Amino acid transporter SLC7A11/xCT at the crossroads of regulating redox homeostasis and nutrient dependency of cancer. Cancer Commun. 2018;38(1):12. doi:10.1186/s40880-018-0288-x
79. Harvey CJ, Thimmulappa RK, Singh A, et al. Nrf2-regulated glutathione recycling independent of biosynthesis is critical for cell survival during oxidative stress. Free Radic Biol Med. 2009;46(4):443–453. doi:10.1016/j.freeradbiomed.2008.10.040
80. Jaganjac M, Milkovic L, Sunjic SB, Zarkovic N. The NRF2, thioredoxin, and glutathione system in tumorigenesis and anticancer therapies. Antioxidants (Basel, Switzerland). 2020;9(11). doi:10.3390/antiox9111151
81. Mandal PK, Saharan S, Tripathi M, Murari G. Brain glutathione levels – a novel biomarker for mild cognitive impairment and Alzheimer’s disease. Biol Psychiatry. 2015;78(10):702–710. doi:10.1016/j.biopsych.2015.04.005
82. Li W, Febbraio M, Reddy SP, Yu D-Y, Yamamoto M, Silverstein RL. CD36 participates in a signaling pathway that regulates ROS formation in murine VSMCs. J Clin Invest. 2010;120(11):3996–4006. doi:10.1172/JCI42823
83. Li L, Dong H, Song E, Xu X, Liu L, Song Y. Nrf2/ARE pathway activation, HO-1 and NQO1 induction by polychlorinated biphenyl quinone is associated with reactive oxygen species and PI3K/AKT signaling. Chem Biol Interact. 2014;209:56–67. doi:10.1016/j.cbi.2013.12.005
84. Jain A, Lamark T, Sjøttem E, et al. p62/SQSTM1 is a target gene for transcription factor NRF2 and creates a positive feedback loop by inducing antioxidant response element-driven gene transcription. J Biol Chem. 2010;285(29):22576–22591. doi:10.1074/jbc.M110.118976
85. Osama A, Zhang J, Yao J, Yao X, Fang J. Nrf2: a dark horse in Alzheimer’s disease treatment. Ageing Res Rev. 2020;64:101206. doi:10.1016/j.arr.2020.101206
86. Zhong Z, Sanchez-Lopez E, Karin M. Autophagy, inflammation, and immunity: a troika governing cancer and its treatment. Cell. 2016;166(2):288–298. doi:10.1016/j.cell.2016.05.051
87. Uddin MS, Stachowiak A, Al MA, et al. Autophagy and Alzheimer’s disease: from molecular mechanisms to therapeutic implications. Front Aging Neurosci. 2018;10:04. doi:10.3389/fnagi.2018.00004
88. Cui B, Lin H, Yu J, Yu J, Hu Z. Autophagy and the immune response. Adv Exp Med Biol. 2019;1206:595–634. doi:10.1007/978-981-15-0602-4_27
89. Meyer M, Schreck R, Müller JM, Baeuerle PA. Redox control of gene expression by eukaryotic transcription factors NF-κB, AP-1 and SRF/TCF. In: Oxidative Stress, Cell Activation and Viral Infection. Basel: Birkhäuser Basel;1994:217–235. doi:10.1007/978-3-0348-7424-3_20
90. Buelna-Chontal M, Zazueta C. Redox activation of Nrf2 & NF-κB: a double end sword? Cell Signal. 2013;25(12):2548–2557. doi:10.1016/j.cellsig.2013.08.007
91. Zetterberg H, Schott JM. Biomarkers for Alzheimer’s disease beyond amyloid and tau. Nat Med. 2019;25(2):201–203. doi:10.1038/s41591-019-0348-z
92. Pietronigro E, Zenaro E, Constantin G. Imaging of leukocyte trafficking in Alzheimer’s disease. Front Immunol. 2016;7:33. doi:10.3389/fimmu.2016.00033.
 © 2021 The Author(s). This work is published and licensed by Dove Medical Press Limited. The full terms of this license are available at https://www.dovepress.com/terms.php and incorporate the Creative Commons Attribution - Non Commercial (unported, v3.0) License.
By accessing the work you hereby accept the Terms. Non-commercial uses of the work are permitted without any further permission from Dove Medical Press Limited, provided the work is properly attributed. For permission for commercial use of this work, please see paragraphs 4.2 and 5 of our Terms.
© 2021 The Author(s). This work is published and licensed by Dove Medical Press Limited. The full terms of this license are available at https://www.dovepress.com/terms.php and incorporate the Creative Commons Attribution - Non Commercial (unported, v3.0) License.
By accessing the work you hereby accept the Terms. Non-commercial uses of the work are permitted without any further permission from Dove Medical Press Limited, provided the work is properly attributed. For permission for commercial use of this work, please see paragraphs 4.2 and 5 of our Terms.