")
Back to Journals » Integrated Blood Pressure Control » Volume 14
Which anthropometric and metabolic index is superior in hypertension prediction among overweight/obese adults?
Authors Abolhasani M, Maghbouli N , Karbalai Saleh S , Aghsaeifar Z, Sazgara F, Tahmasebi M, Ashraf H, Haidar Ali J
Received 24 September 2021
Accepted for publication 14 October 2021
Published 8 November 2021 Volume 2021:14 Pages 153—161
DOI https://doi.org/10.2147/IBPC.S340664
Checked for plagiarism Yes
Review by Single anonymous peer review
Peer reviewer comments 2
Editor who approved publication: Dr Konstantinos Tziomalos
Maryam Abolhasani,1,* Nastaran Maghbouli,2,* Shahrokh Karbalai Saleh,3 Ziba Aghsaeifar,4 Faeze Sazgara,5 Maryam Tahmasebi,6 Haleh Ashraf,7 Jemal Haidar Ali8,*
1Cardiac Primary Prevention Research Center (CPPRC), Tehran Heart Center, Tehran University of Medical Sciences, Tehran, Iran; 2Physical Medicine and Rehabilitation Department, Tehran University of Medical Sciences, Tehran, Iran; 3Department of Cardiology, Sina Hospital, Tehran University of Medical Sciences, Tehran, Iran; 4Department of Internal Medicine, Sina Hospital, Tehran University of Medical Sciences, Tehran, Iran; 5Department of Radiology, Guilan University of Medical Sciences, Rasht, Guilan, Iran; 6Department of Cardiology, Amir Al Momenin Hospital, Islamic Azad University of Medical Sciences, Tehran, Iran; 7Cardiac Primary Prevention Research Center (CPPRC), Tehran Heart Center and Research Development Center, Sina Hospital, Tehran University of Medical Sciences, Tehran, Iran; 8Department of Public Health Nutrition, School of Public Health, College of Health Sciences, Addis Ababa University, Addis Ababa, Ethiopia
*These authors contributed equally to this work
Correspondence: Jemal Haidar Ali
Addis Ababa University, College of Health Sciences, School of Public Health, Department of Public Health Nutrition, P.O. Box: 27285, Addis Ababa, 1000, Ethiopia
Tel +251 115547465
; +251 911505465
Email [email protected]
Haleh Ashraf
Research Development Center, Sina Hospital, Emam Khomeini St., Tehran, 1136746911, Iran
Fax +98 21-66348553
Email [email protected]
Background: Although the effectiveness of some combined anthropometric and metabolic scores were evaluated in hypertension prediction, none of them had addressed their accuracy in association with overweight/obese populations. This study examined the accuracy of several anthropometric parameters in this regard and compared the novel indices to the ancient ones.
Methods: Through a cross-sectional study, 5115 patients have been evaluated at the weight loss clinic. Data on demographic information, anthropometric indices, and biochemical measurements were assembled into a checklist. Multivariable regression modeling and the area under the receiver-operating characteristic (ROC) were analyzed using SPSS version 20. To find new combined scores, SEM (structural equation modeling) analysis was also adopted. P-values < 0.05 were considered statistically significant.
Results: Considering ancient indices, WHtR (waist-to-height ratio) showed a sufficient area under the curve in predicting hypertension among both genders concomitant with WC (waist circumference) in men, and BRI (body roundness index) in women as highest AUC. The highest odds ratio (OR) for the presence of hypertension, based on the age-adjusted model, was BRI in females (OR, 3.335; 95% confidence interval [CI], 1.58– 7.28) and WC in males (OR, 13.478; 95% CI: 1.99– 45.02). The combined scores were not superior to the single ones.
Conclusion: The most powerful association between hypertension and sufficient discrimination ability of normotensives from hypertensive patients was detected for BRI in women and WC among men. However, neither the BSI and BAI nor FMI and FFMI showed superiority to WC or WHtR in predicting the presence of hypertension.
Keywords: prediction, hypertension, obesity, anthropometric indices, novel indices, Iran
Introduction
Obesity has become a major unsolved problem worldwide because of its proven risk for developing cardiovascular disease and its metabolic adverse effects in addition to its role in some cancers.1 Globally, the proportion of overweight/obese adults has increased to 36/9% in men and 29/8% in women,2 while 51/2% for men and 57/5% for women in Iran.3 Based on a systematic review, between 0.7% and 2.8% of a country’s total health-related budget was devoted to obesity. Furthermore, studies showed that medical costs for obese people were 30% greater than the normal weight population.4
Consequences of obesity are not only related to the degree of obesity but are also associated with the pattern of body fat distribution or fat to lean body mass proportion.5–7 A growing body of evidence has assessed the relationship of types/grades of obesity with hypertension (HTN) and found significant correlations.8–10 Mechanisms of obesity-related HTN following increased sodium reabsorption in kidneys include the role of renal sympathetic nervous system, kidney compression by visceral fat, and increased anti-natriuretic hormones and adipokines levels.11 Interestingly, the role of insulin resistance as a stimulating factor for other mechanisms in HTN was introduced recently.12
Other than the ancient anthropometric indices such as body mass index (BMI), waist circumference (WC), waist-to-hip ratio (WHR) and waist-to-height ratio (WHtR),13,14 there is a new index referred as Visceral Adiposity Index (VAI). This index is sex-specific, reflects the level of tissue resistance to insulin and adipose tissue mass15 and has a positive association with the risk of developing HTN.16
In 2011, Lipid Accumulation Product (LAP) index which describes lipid accumulation using WC and triglyceride (TG) concentrations, is reported to be a better index in predicting HTN compared to BMI and WC based on a study conducted among Mongolians in China.17
Another newly developed index known as Body Shape Index (BSI), showed superiority over BMI and WC for predicting HTN18 though Chang et al rebuffed this theory and instead came up with another better predicting index for HTN called Body Round Index (BRI) than BSI, BMI and WC.19
Body Adiposity Index (BAI), directly calculates the percentage of adiposity by using hip circumference and height.20 In some studies, BAI, when compared with BMI and WHtR, was not a better predictor for coronary vascular disease (CVD) risk factors;21,22 on the contrary, another study with a longitudinal study, showed BAI to predict incidence of HTN more precisely than BMI and WHR23 showing some inconsistencies in the anthropometric indices used deserves further study.
The Influence of lean body mass index versus that of fat mass index on blood pressure of Gujarati in-school adolescents studied in 2014 displayed a positive relationship between HTN and fat mass index (FMI) and also the free fat mass index (FFMI).24 Contrary to the Gujarati study findings, Stephen et al documented BMI as a stronger predictor than FMI and FFMI for developing HTN.25
Considering the lack of existing studies on the evaluation of newly developed anthropometric indices in Asia beyond China, the importance of ethnicity on obesity indices, and the controversial findings reported by some previous investigators on the superiority of adiposity indices that predict HTN, we examined the accuracy of several anthropometric parameters in this regard and compared the novel indices to the ancient ones in predicting hypertension among overweight/obese Iranian adults. Secondly, we reported some new potential combined scores in predicting hypertension contextually.
Methods
Study Design
This study employed a cross-sectional design, implemented at the obesity clinic of Sina Hospital, a referral hospital of Tehran University of Medical Sciences.
Study Participants
A total of 5115 obese/overweight adults involving 4042 (79.1%) females and 1073 (20.9%) males referred to the weight loss clinic from June 2017 to June 2019 of whom 1870 were overweight and the remaining 3245 were obese. Most (73.1%) of the studied women were in their menopause state while the remaining 1089 (23.9%) were in their pre-menopause. Only 3251 patients with complete data were considered for the analysis and the rest were excluded [Figure 1].
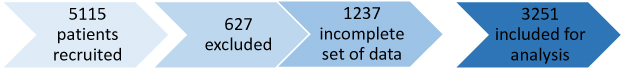 |
Figure 1 Flow chart of study participants. |
Procedure
The medication history of patients was recorded. Patients on low-dose Statins were included since the mentioned doses did not affect serum TG level. We excluded patients with recent (through six months) heart failure, myocardial infarction, or stroke in addition to participants with chronic conditions or rheumatologic diseases, and pregnant women.
An informed consent form was filled by all participants after explaining the aims of the study. Moreover, the Ethics Committee of Tehran University of Medical Sciences approved the protocol of this study. A trained nurse collected the demographic data and information on measurements using a standard checklist for data entry.
Hypertension Definition
The diagnosis of hypertension was made based on BP > 130/80 on two separate office visits or previous treatment with antihypertensive drugs according to the American College of Cardiology (ACC) and the American Heart Association (AHA) guideline for the Prevention, Detection, Evaluation and Management of High Blood Pressure in Adults. Hypertensive patients were grouped as stage 1 and stage 2 when the studied participants had blood pressure of 130–139/80–89 and greater than 140/90, respectively based on American Heart Association (AHA) guidelines.26 We used a standard mercury sphygmomanometer with appropriate cuff size to evaluate the blood pressure in a sitting position.
Measurements
We used a Seca 755 Column Medical Scale for measurement of body weight with an accuracy of 0.1 kg and a standard stadiometer for heights of about 0.1 cm. While recording weights, the patients wore light clothing, and during height measurements, shoes were taken off. Weight divided by height squared (kg/m2) was used for the BMI calculation. 30 > BMI ≥ 25 was determined as overweight and obesity was defined as BMI ≥ 30. Waist circumference was assessed at the most narrow part of the waist. Hip circumference was taken at the maximal protuberance of the gluteal using a single tape.
Anthropometric Indices
The body composition analyzer BC-418 MA (TANITA, Tokyo, Japan) was used for the evaluation of anthropometric indices including total fat percentage, total fat mass, and total free fat mass.27
VAI and LAP, sex specific indices, were calculated using the following equation : (TG and HDL are expressed in mmol/l) For males: VAI = (WC/39.68 + (1.88×BMI)) × (TG/1.03) × (1.31/HDL), For females: VAI = (WC/36.58 + (1.89×BMI)) × (TG/0.81) × (1.52/HDL)15 and LAP = (WC-65) × TG for men and (WC-58) × TG for women.28
BSI was calculated using this formula: BSI = WC/(BMI2/3x height1/2)29 below and WC and height in this index are in meters. BRI was calculated using this equation: 364.2−365.5  .30 BAI was calculated using this equation: ((hip circumference (cm)/height (m)1.5) − 18).20 WHtR of patients is defined as the waist circumference divided by height, with the same units for both measures. WHR is defined as their waist circumference divided by hip circumference, both measured in the same units.31
FMI and FFMI were measured by calculating the total fat mass and free fat mass by body composition analyzer and then using the following formulas: FMI = fat mass/height squared (m2) and FFMI = fat-free mass/height squared(m2).27
Laboratory Investigations
After a 12-hour fasting, patients’ sera were collected to determine the levels of fasting blood sugar (FBS), triglyceride (TG), cholesterol (CHOL), low-density lipoprotein (LDL) and high-density lipoprotein (HDL). For fasting plasma glucose level evaluation, the enzymatic colorimetric technique was implemented. For assessing serum levels of lipids, an Erba Mannheim auto analyzer XL-640 (Erba Diagnostics Mannheim, Germany) with Pars Azmoon reagent kit (Tehran, Iran) was employed. Then, low-density lipoprotein-cholesterol (LDL-cholesterol) level was calculated based on the Fried Ewald’s formula.32 In cases with serum triglyceride levels of more than 400 mg/dl, LDL-cholesterol was directly measured by the enzymatic method and using commercial kits (Parsazmun, Karaj, Iran).
Statistical Analysis
The independent t-test and chi-square test were employed to compare quantitative and categorical variables, respectively between normotensive and hypertensive patients. Pearson’s correlation test was used to examine the association of systolic blood pressure and anthropometric indices. The area under the receiver-operating characteristic curve (AUC) with 95% confidence intervals (CIs) and Youden distance were used to assess the power of each anthropometric measure to discriminate normotensives from hypertensive patients. According to the gender-specific nature of some indices,33 we analyzed the data in two subgroups for men and women. The odds ratios (ORs) and their 95% CIs for the presence of hypertension were estimated by logistic regression analysis. Variables were adjusted for age and sex in the first model, and for age, sex, BMI, and WC in the second model. The SEM (Structural Equation Modeling) method was used to extract latent synthetic obesity scores from the manifest anthropologic indices.34 However, the ordinary linear SEM was not suitable for the association detection between obesity score and hypertension due to the stronger multi-co-linearity relationships between the anthropologic indices. Therefore, we used the PLSPM method to implement the SEM model for new latent combined scores extraction.35 All statistical analyses were performed using IBM SPSS Statistics version 20.0 (SPSS Inc., Chicago, IL, USA) and SmartPLS version 2.0 (Ringle, Wende, and Becker, 2015). P-values < 0.05 were considered statistically significant.
Results
The characteristics of 5115 participants are shown in Table 1. BMI, WHtR, BSI, BRI, total fat mass, total fat-free mass, total fat percentage, FMI, and FFMI were significantly higher in male hypertensives than normotensives while WC, HC, WHtR, VAI, LAP, BAI, BRI, total fat mass, total fat-free mass, total fat percentage, FMI, and FFMI were significantly higher in female hypertensive individuals. BSI and BMI in women whereas WC, HC, BAI, LAP, and VAI were similar in male hypertensives as well as normotensives [Table 1].
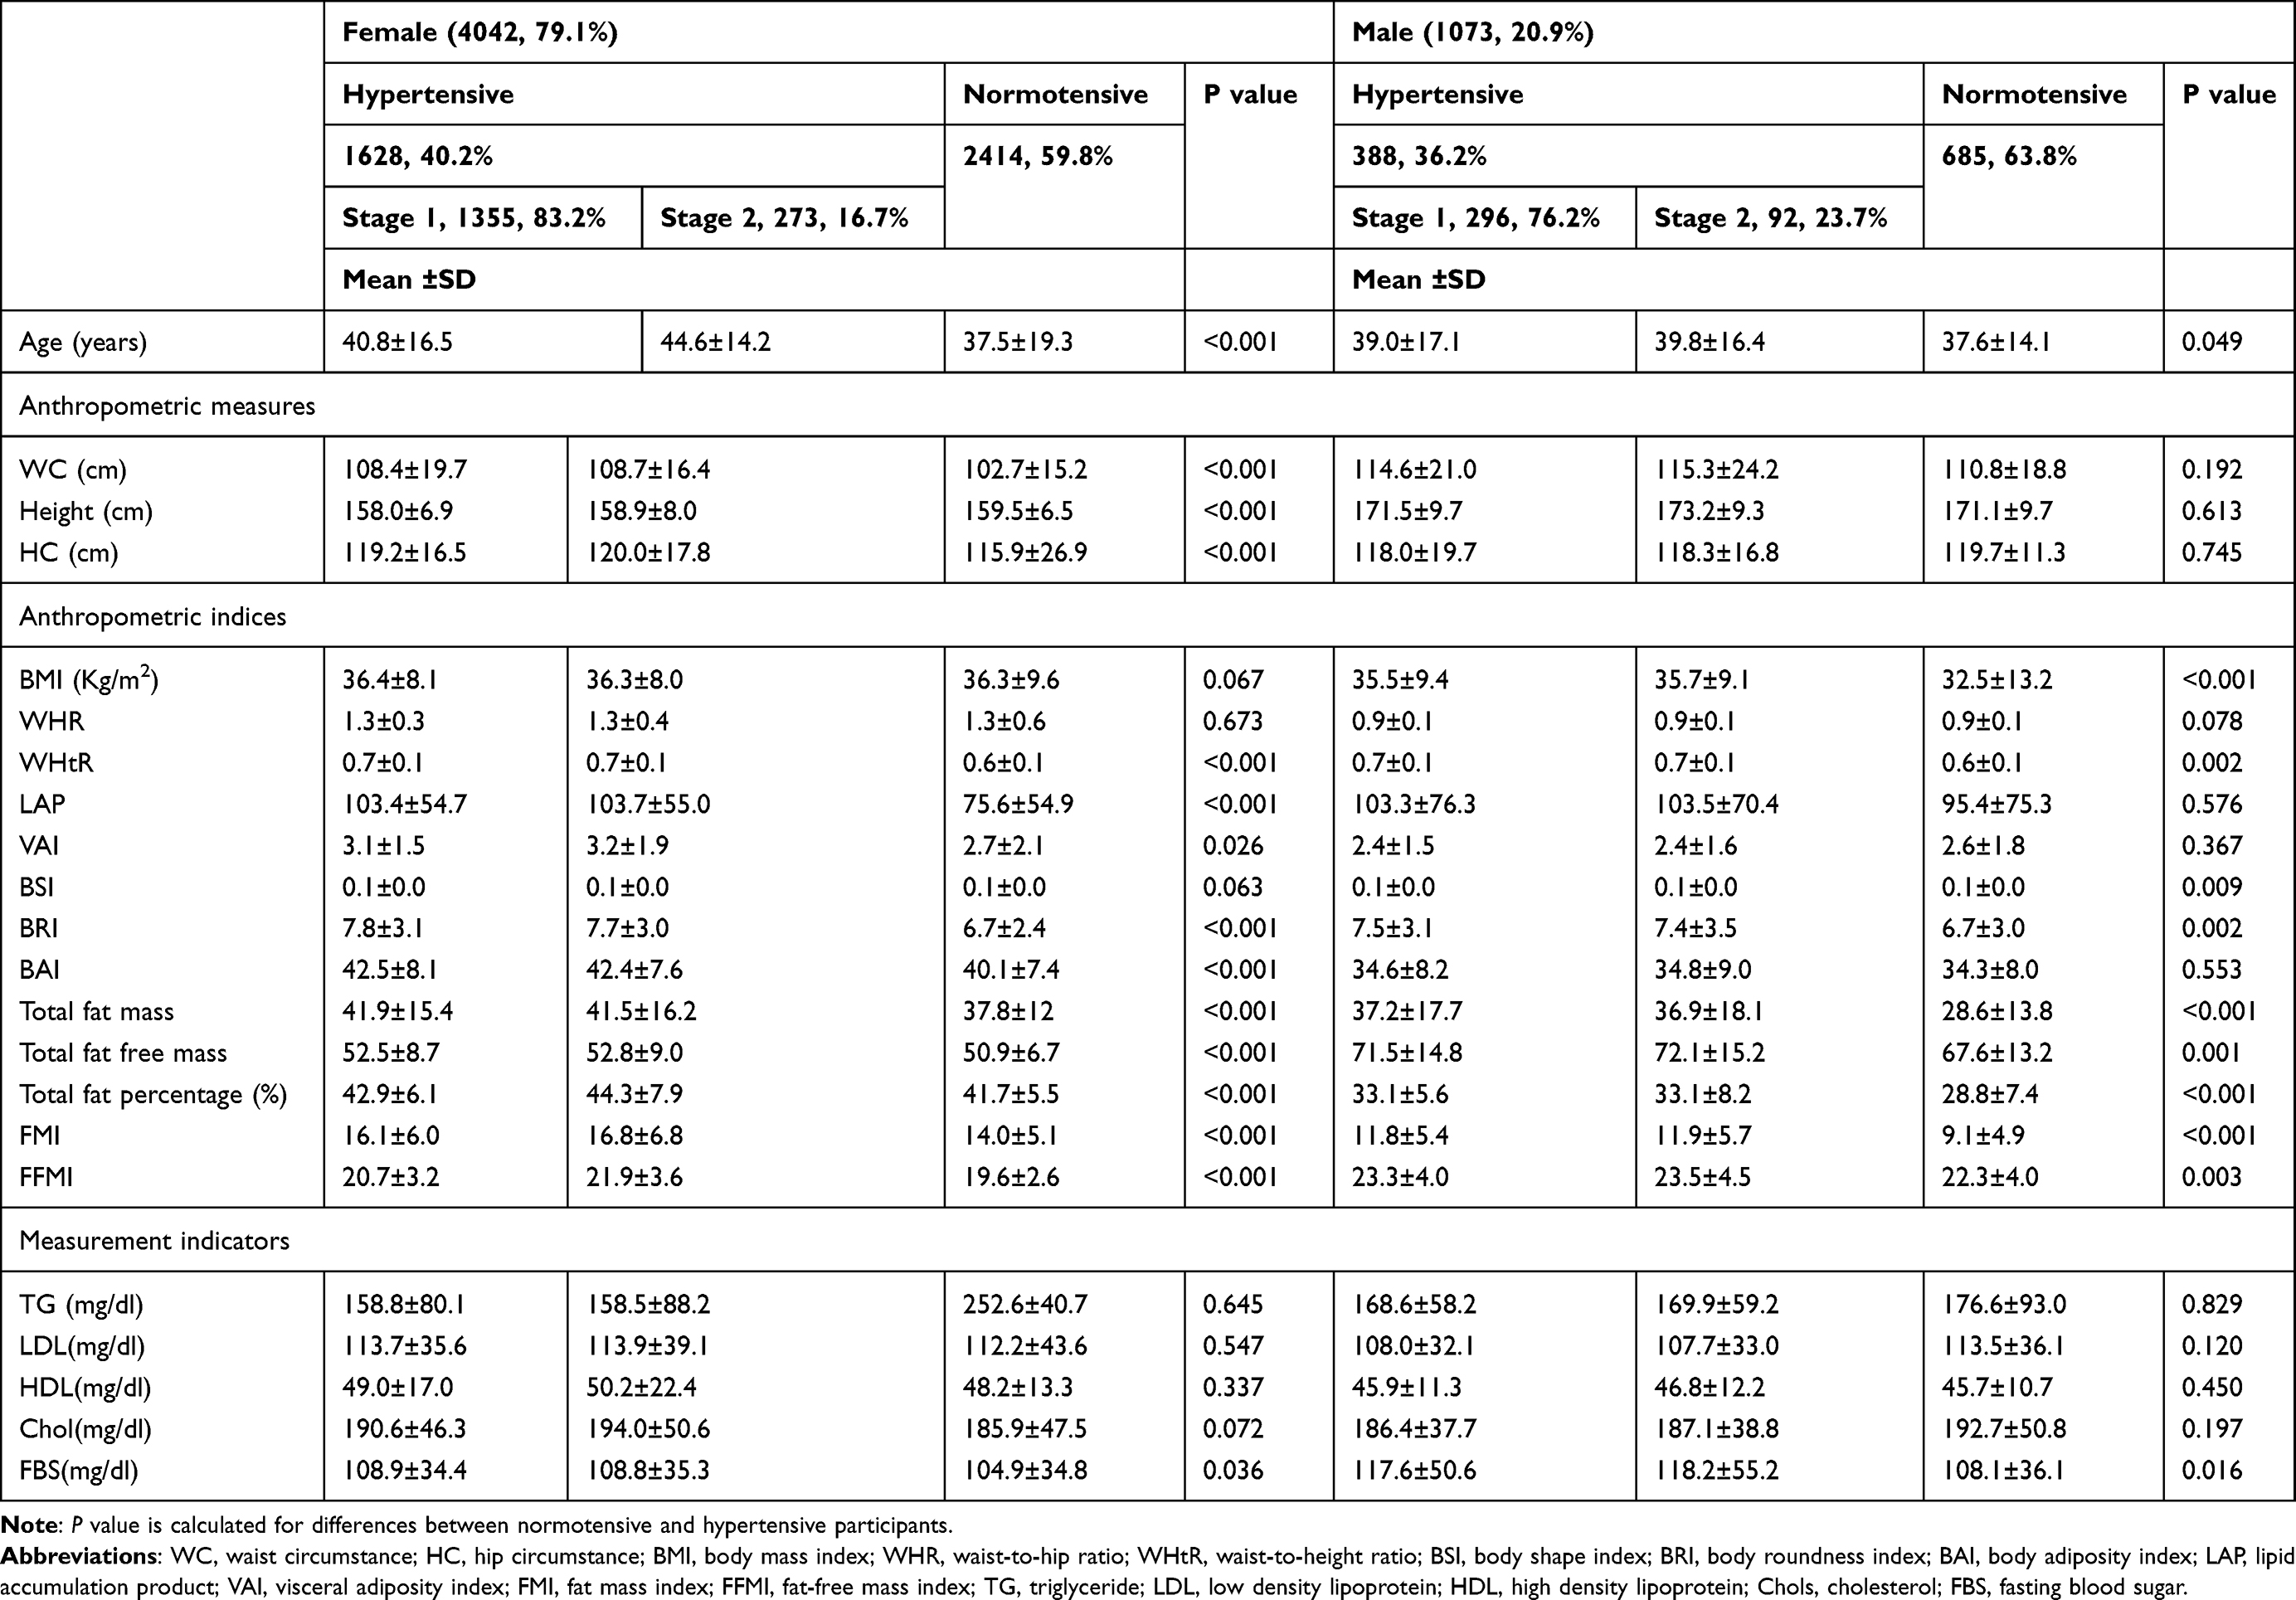 |
Table 1 Age, Anthropometric Measures, Indices and Measure Indicators Adjusted for Gender and Hypertension |
Table 2 displays the area under the curve, cut off, sensitivity and specificity of each anthropometric measures for the presence of hypertension in both genders. LAP, WHtR, and BRI revealed the highest diagnostic accuracy for predicting hypertension with AUC of 0.67 and CI 95% of 0.57–0.78, 0.55–0.79, and 0.55–0.79 in females, respectively. Whereas WC and BSI were more accurate measures for predicting hypertension in males, (AUC = 0.70, 0.71, CI 95% = 0.54–0.77, 0.37–0.86) which was closely followed by WHtR (AUC = 0.68, CI 95% = 0.55–0.79).
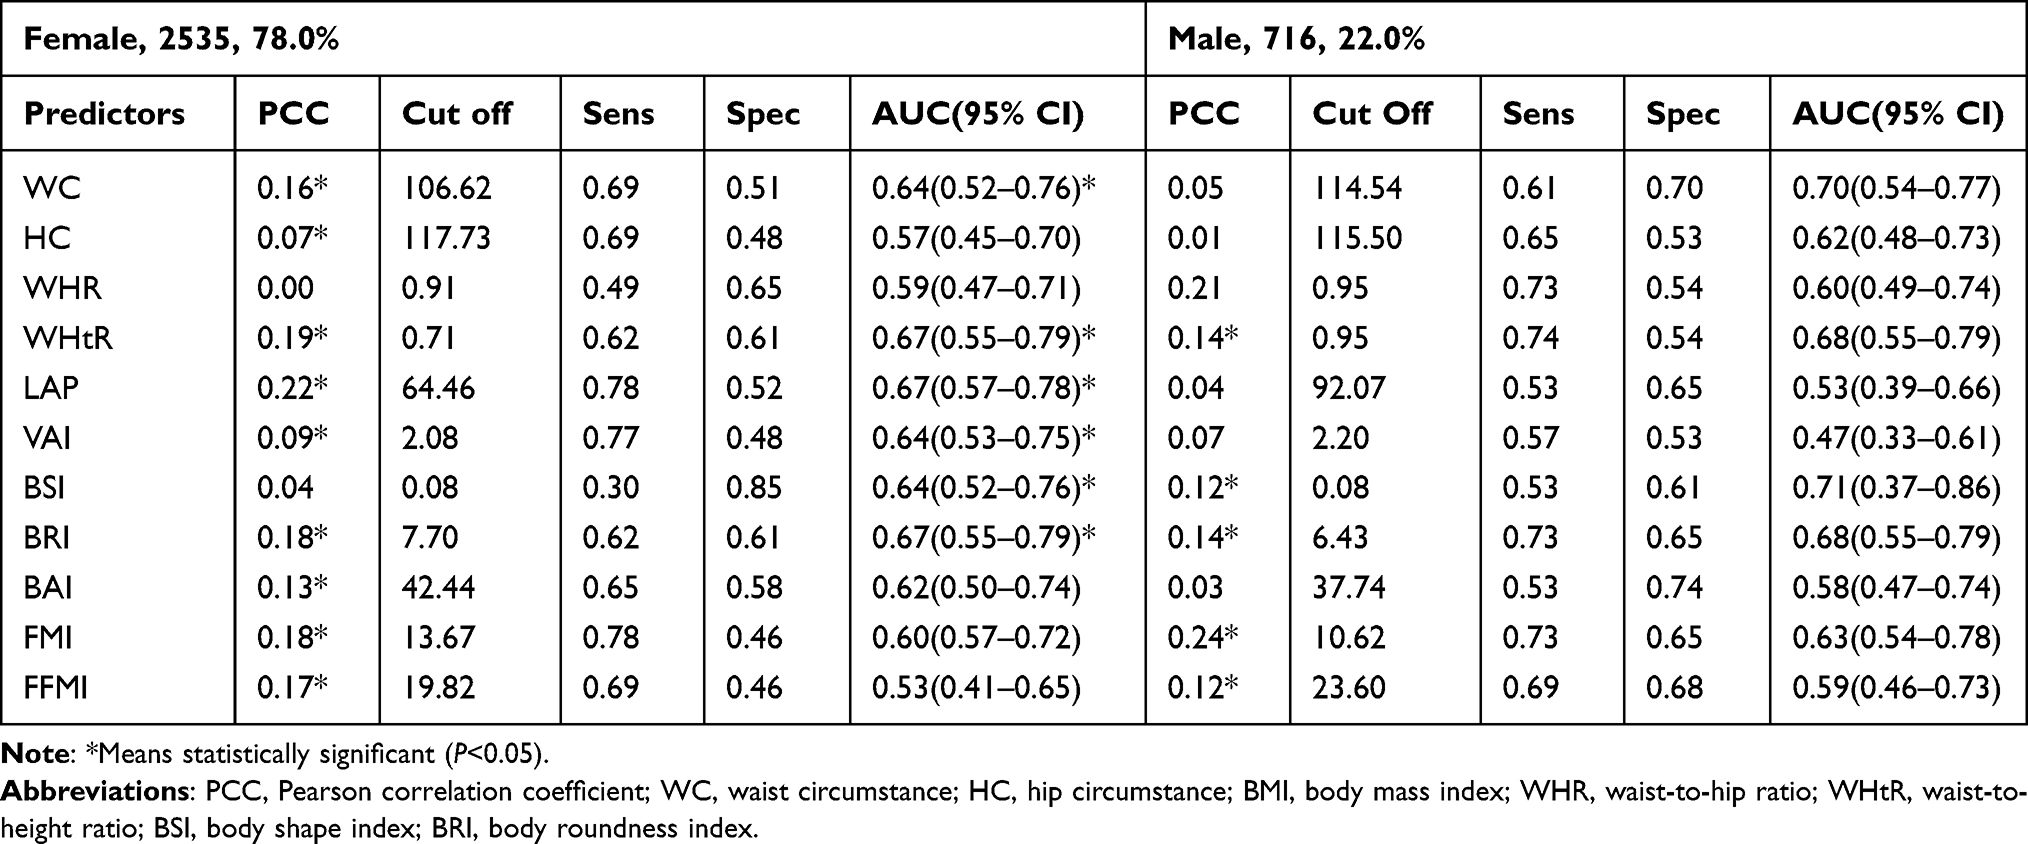 |
Table 2 The Area Under the Curve, Cut off, Sensitivity and Specificity of Each Anthropometric Measures for the Presence of Hypertension by Gender |
Considering sensitivity, the most sensitive index for hypertension prediction was LAP (sensitivity: 78% and specificity: 52%) for females and WHtR (sensitivity: 74% and specificity: 54%) for males. Concomitantly, BSI was the most specific index (sensitivity: 30% and specificity: 85%) for women and BAI (sensitivity: 53% and specificity: 74%) for men.
Figure 2 shows the AUC values for combined latent indices/scores for male and female groups. We selected three of the strongest correlated manifest indices with patients’ systolic blood pressure to conduct latent combined indices for both genders. BRI, WHtR, and WC were chosen for females, while BRI, FMI, and WHtR were selected for men. Based on the aforementioned latent combined indices, four scores were generated to a different combination of mentioned indices, and the combined scores were approximately similar as the manifest indices with no better discriminating power for hypertension detection.
 |
Figure 2 AUC values for combined latent indices in women and men. Women: Score 1 (BRI, WHtR), Score 2 (BRI, WC), Score 3 (WHtR, WC), Score 4 (BRI, WHtR, WC); Men: Score 1 (WHtR, FMI), Score 2 (WHtR, BRI), Score 3 (BRI, FMI), Score 4 (BRI, WHtR, FMI). |
When indices were used to estimate the risk for HTN, the most powerful odds ratios belonged to WC with OR = 13.47 (1.99–45.02) for men and BRI (OR = 3.33 (1.58–7.28)) for women, comparatively higher than those observed for all other indices. Combined latent indices were not better than the manifest [Table 3].
 |
Table 3 Odds Ratio (95% CI) of the Presence of Hypertension for Each Anthropometric Measure by Gender |
Discussion
Considering the literature review, to our knowledge, our study is the first one to compare the vast spectrum of indices including ancient and novel parameters in addition to combined scores among populations with an appropriate sample size and revealed BRI and WC to be the best predictors. The aforementioned anthropometric indices for predicting hypertension among overweight/obese patients had a good power of discrimination of normotensive from hypertensive patients in both genders. Similar to our study findings, Chang et al suggested BRI as a potential parameter in hypertension assessment.36 On the other hand, the study findings from Mongolian males, LAP was reported as a better potential HTN predictor than BMI.17 Moreover, Wang et al suggested LAP as a better choice than BAI in association with hypertension among the obese population.37
Our findings advocated the use of ancient indices since they showed WC among men and WHtR among women to be the best predictors than the suggested novel parameters elsewhere. In the same breath, the study done by Lee’s group among Korean obese people38 documented similar findings to ours. According to the two meta-analyses, in which each study extracted more than thirty studies and pooled data comparing ancient obesity indices (BMI, WC, WHR, and WHtR), WHtR has been suggested not only as the strongest hypertension risk predictor but also as the best discriminator of normotensives in hypertensive patients though the pooled studies in these meta-analyses were mostly from China and the studies were heterogeneous.39,40 Conversely, in a study evaluating 622 Jordanian people, WC was introduced as an independent predictor of hypertension.41 It is likely that such differences could occur as a result of differences in ethnicity/race and other sociodemographic factors.
Our findings agreed that latent combined scores were not superior to the manifest indices, neither in predicting hypertension nor in discriminating hypertensive from normotensive patients. Two studies with remarkable sample sizes, approved some superiority for combined indices in comparison to ancient indices (including BMI, WC, HER, and WHtR) using wrapper-based variable selection and Partial Least Squares Path Modeling (PLSPM) method especially among women.42 Different findings of our study and mentioned studies might be explained by different index selections for combined scores construction.43
The strengths of our study include a large cohort of overweight/obese participants from over a two-year period, and employed standardized anthropometric measurements to decrease inter-rater bias. Nonetheless, our findings need to be interpreted cautiously in the context of potential limitations that include lack of socioeconomic information, smoking status, dietary habits, and physical activity level variables of participants. There was also a higher number of women participants which might have resulted in a selection bias though maximum effort was made to compensate for the selection bias through subgroup analysis. In order to support the causality association and overcome the limitation of the present cross-sectional study, further longitudinal studies are warranted.
Conclusion
In summary, the most powerful association between hypertension and sufficient discrimination ability of normotensives from hypertensive patients were detected for BRI in women and WC for men. However, neither the BSI, BAI nor FMI and FFMI showed superiority to WC or WHtR in predicting the presence of hypertension.
Abbreviations
AHA, American Heart Association; AUC, area under the curve; BAI, body adiposity index; BMI, body mass index; BRI, body roundness index; BSI, body shape index; CVD, coronary vascular disease; FFMI, free fat mass index; FMI, fat mass index; HC, hip circumference; LAP, lipid accumulation product; OR, odds ratio; PLSPM, partial least squares path modeling; SEM, structural equation modeling; VAI, visceral adiposity index; WC, waist circumference; WHR, waist-to-hip ratio; WHtR, waist-to-height ratio.
Data Sharing Statement
Research data is confidential but in needed situation, is available through the email contact with corresponding author.
Ethics Approval
The Ethics Committee of Tehran University of Medical Sciences approved the protocol of this study (Code: IR.TUMS.VCR.REC.1397.063). The study was conducted in accordance with the Declaration of Helsinki.
Consent to Participate
A written consent form was obtained from all participants after explaining the aims of the study.
Consent for Publication
All authors approved manuscript for publication.
Author Contributions
All authors contributed to data analysis, drafting or revising the article, have agreed on the journal to which the article will be submitted, gave final approval of the version to be published, and agree to be accountable for all aspects of the work. Maryam Abolhasani and Nastaran Maghbouli contributed equally to this work and share co-first authorship. Haleh Ashraf and Jemal Haidar Ali are shared corresponding authors.
Funding
This study was not funded by any agency.
Disclosure
The authors report no conflicts of interest for this work.
References
1. Camici MGF, Carpi A. Obesity and increased risk for atherosclerosis and cancer. Intern Med. 2014;4:154.
2. Ng M, Fleming T, Robinson M, et al. Global, regional, and national prevalence of overweight and obesity in children and adults during 1980–2013: a systematic analysis for the Global Burden of Disease Study 2013. Lancet. 2014;384(9945):766–781. doi:10.1016/S0140-6736(14)60460-8
3. Moghimi-Dehkordi B, Safaee A, Vahedi M, et al. Overweight and obesity and related factors in urban Iranian population aged between 20 to 84 years. Ann Med Health Sci Res. 2013;3(2):171–176. doi:10.4103/2141-9248.113656
4. Withrow D, Alter DA. The economic burden of obesity worldwide: a systematic review of the direct costs of obesity. Obes Rev. 2011;12(2):131–141. doi:10.1111/j.1467-789X.2009.00712.x
5. Lee YE, Park JE, Hwang J-Y, Kim WY. Comparison of health risks according to the obesity types based upon BMI and waist circumference in Korean adults: the 1998–2005 Korean National Health and Nutrition Examination Surveys. Korean J Nutr. 2009;42(7):631–638. doi:10.4163/kjn.2009.42.7.631
6. Cikim A, Ozbey N, Orhan Y. Relationship between cardiovascular risk indicators and types of obesity in overweight and obese women. J Int Med Res. 2004;32(3):268–273. doi:10.1177/147323000403200306
7. Khazem S, Itani L, Kreidieh D, et al. Reduced lean body mass and cardiometabolic diseases in adult males with overweight and obesity: a pilot study. Int J Environ Res Public Health. 2018;15(12):2754. doi:10.3390/ijerph15122754
8. Zhang Y-X, Wang S-R. Blood pressure level profiles among children and adolescents with various types of obesity: study in a large population in Shandong, China. Clin Res Cardiol. 2014;103(7):553–559. doi:10.1007/s00392-014-0683-5
9. Kelishadi R, Cook SR, Motlagh ME, et al. Metabolically obese normal weight and phenotypically obese metabolically normal youths: the CASPIAN Study. J Am Diet Assoc. 2008;108(1):82–90. doi:10.1016/j.jada.2007.10.013
10. Ashraf H, Rashidi A, Noshad S, Khalilzadeh O, Esteghamati A. Epidemiology and risk factors of the cardiometabolic syndrome in the Middle East. Expert Rev Cardiovasc Ther. 2011;9(3):309–320. doi:10.1586/erc.11.9
11. Hall JE, Do Carmo JM, da Silva AA, Wang Z, Hall ME. Obesity, kidney dysfunction and hypertension: mechanistic links. Nat Rev Nephrol. 2019;1:367–385.
12. Seravalle G, Grassi G. Obesity and hypertension. Pharmacol Res. 2017;122:1–7. doi:10.1016/j.phrs.2017.05.013
13. Heymsfield SB, Stevens J. Anthropometry: Continued Refinements and New Developments of an Ancient Method. Oxford University Press; 2017.
14. Esteghamati A, Ashraf H, Rashidi A, Meysamie A. Waist circumference cut-off points for the diagnosis of metabolic syndrome in Iranian adults. Diabetes Res Clin Pract. 2008;82(1):104–107. doi:10.1016/j.diabres.2008.07.009
15. Amato MC, Giordano C, Galia M, et al. Visceral Adiposity Index: a reliable indicator of visceral fat function associated with cardiometabolic risk. Diabetes Care. 2010;33(4):920–922. doi:10.2337/dc09-1825
16. Ding Y, Gu D, Zhang Y, Han W, Liu H, Qu Q. Significantly increased visceral adiposity index in prehypertension. PLoS One. 2015;10(4):e0123414. doi:10.1371/journal.pone.0123414
17. Gao X, Wang G, Wang A, Xu T, Tong W, Zhang Y. Comparison of lipid accumulation product with body mass index as an indicator of hypertension risk among Mongolians in China. Obes Res Clin Pract. 2013;7(4):e308–e314. doi:10.1016/j.orcp.2012.02.002
18. Duncan MJ, Mota J, Vale S, Santos MP, Ribeiro JC. Associations between body mass index, waist circumference and body shape index with resting blood pressure in Portuguese adolescents. Ann Hum Biol. 2013;40(2):163–167. doi:10.3109/03014460.2012.752861
19. Chang Y, Guo X, Guo L, et al. GW26-e3889 A Body Shape Index and Body Roundness Index: two new body indices to identify hypertension among rural populations in northeast China. J Am Coll Cardiol. 2015;16(66):C117.
20. Bergman RN, Stefanovski D, Buchanan TA, et al. A better index of body adiposity. Obesity. 2011;19(5):1083–1089. doi:10.1038/oby.2011.38
21. Lam BCC, Koh GCH, Chen C, Wong MTK, Fallows SJ. Comparison of body mass index (BMI), body adiposity index (BAI), waist circumference (WC), waist-to-hip ratio (WHR) and waist-to-height ratio (WHtR) as predictors of cardiovascular disease risk factors in an adult population in Singapore. PLoS One. 2015;10(4):e0122985. doi:10.1371/journal.pone.0122985
22. Melmer A, Lamina C, Tschoner A, et al. Body adiposity index and other indexes of body composition in the SAPHIR study: association with cardiovascular risk factors. Obesity. 2013;21(4):775–781. doi:10.1002/oby.20289
23. Moliner-Urdiales D, Artero EG, Sui X, España-Romero V, Lee D, Blair S. Body adiposity index and incident hypertension: the aerobics center longitudinal study. Nutr Metabol Cardiovasc Dis. 2014;24(9):969–975. doi:10.1016/j.numecd.2014.03.004
24. Verma V, Singh SK. Influence of lean body mass index versus that of fat mass index on blood pressure of gujarati school going adolescents. Indian J Physiol Pharmacol. 2014;58(1):39–44.
25. Mooney SJ, Baecker A, Rundle AG. Comparison of anthropometric and body composition measures as predictors of components of the metabolic syndrome in a clinical setting. Obes Res Clin Pract. 2013;7(1):e55–e66. doi:10.1016/j.orcp.2012.10.004
26. Colantonio LD, Booth JN, Bress AP, et al. 2017 ACC/AHA blood pressure treatment guideline recommendations and cardiovascular risk. J Am Coll Cardiol. 2018;72(11):1187–1197. doi:10.1016/j.jacc.2018.05.074
27. Jebb SA, Cole TJ, Doman D, Murgatroyd PR, Prentice AM. Evaluation of the novel Tanita body-fat analyser to measure body composition by comparison with a four-compartment model. Br J Nutr. 2000;83(2):115–122. doi:10.1017/S0007114500000155
28. Kahn HS. The” lipid accumulation product” performs better than the body mass index for recognizing cardiovascular risk: a population-based comparison. BMC Cardiovasc Disord. 2005;5(1):26. doi:10.1186/1471-2261-5-26
29. Krakauer NY, Krakauer JC, Li S. A new body shape index predicts mortality hazard independently of body mass index. PLoS One. 2012;7(7):e39504. doi:10.1371/journal.pone.0039504
30. Thomas DM, Bredlau C, Bosy‐Westphal A, et al. Relationships between body roundness with body fat and visceral adipose tissue emerging from a new geometrical model. Obesity. 2013;21(11):2264–2271. doi:10.1002/oby.20408
31. Kang SH, Cho KH, Park JW, Do JY. Comparison of waist to height ratio and body indices for prediction of metabolic disturbances in the Korean population: the Korean National Health and Nutrition Examination Survey 2008–2011. BMC Endocr Disord. 2015;15(1):79. doi:10.1186/s12902-015-0075-5
32. Friedewald WT, Levy RI, Fredrickson DS. Estimation of the concentration of low-density lipoprotein cholesterol in plasma, without use of the preparative ultracentrifuge. Clin Chem. 1972;18(6):499–502. doi:10.1093/clinchem/18.6.499
33. de Oliveira Alvim R, Mourao-Junior CA, de Oliveira CM, Krieger JE, Mill JG, Pereira AC. Body mass index, waist circumference, body adiposity index, and risk for type 2 diabetes in two populations in Brazil: general and Amerindian. PLoS One. 2014;9(6):e100223.
34. Esposito Vinzi V, Chin WW, Henseler J, Wang H. Handbook of Partial Least Squares: Concepts, Methods and Applications. Heidelberg, Dordrecht, London, New York: Springer; 2010.
35. Henseler J, Ringle CM, Sinkovics RR. The use of partial least squares path modeling in international marketing. In: New Challenges to International Marketing. Emerald Group Publishing Limited; 2009.
36. Chang Y, Guo X, Guo L, Li Z, Li Y, Sun Y. The feasibility of two new anthropometric indices to identify hypertension in rural China: a cross-sectional study. Medicine. 2016;95(44):e5301. doi:10.1097/MD.0000000000005301
37. Wang H, Chen Y, Sun G, Jia P, Qian H, Sun Y. Validity of cardiometabolic index, lipid accumulation product, and body adiposity index in predicting the risk of hypertension in Chinese population. Postgrad Med. 2018;130(3):325–333. doi:10.1080/00325481.2018.1444901
38. Lee J-W, Lim N-K, Baek T-H, Park S-H, Park H-Y. Anthropometric indices as predictors of hypertension among men and women aged 40–69 years in the Korean population: the Korean Genome and Epidemiology Study. BMC Public Health. 2015;15(1):1–7. doi:10.1186/s12889-015-1471-5
39. Deng G, Yin L, Liu W, et al. Associations of anthropometric adiposity indexes with hypertension risk: a systematic review and meta-analysis including PURE-China. Medicine. 2018;97(48):e13262. doi:10.1097/MD.0000000000013262
40. Ashwell M, Gunn P, Gibson S. Waist‐to‐height ratio is a better screening tool than waist circumference and BMI for adult cardiometabolic risk factors: systematic review and meta‐analysis. Obes Rev. 2012;13(3):275–286. doi:10.1111/j.1467-789X.2011.00952.x
41. Batiha A-M, AlAzzam M, ALBashtawy M, Tawalbeh L, Tubaishat A, Alhalaiqa FN. The relationship between hypertension and anthropometric indices in a Jordanian population. Adv Stud Biol. 2015;7(5):233–243. doi:10.12988/asb.2015.5214
42. Lee BJ, Kim JY, Zhu Z. A comparison of the predictive power of anthropometric indices for hypertension and hypotension risk. PLoS One. 2014;9(1):e84897. doi:10.1371/journal.pone.0084897
43. Wang S, Liu Y, Li F, Jia H, Liu L, Xue F. A novel quantitative body shape score for detecting association between obesity and hypertension in China. BMC Public Health. 2015;15(1):7. doi:10.1186/s12889-014-1334-5
 © 2021 The Author(s). This work is published and licensed by Dove Medical Press Limited. The full terms of this license are available at https://www.dovepress.com/terms.php and incorporate the Creative Commons Attribution - Non Commercial (unported, v3.0) License.
By accessing the work you hereby accept the Terms. Non-commercial uses of the work are permitted without any further permission from Dove Medical Press Limited, provided the work is properly attributed. For permission for commercial use of this work, please see paragraphs 4.2 and 5 of our Terms.
© 2021 The Author(s). This work is published and licensed by Dove Medical Press Limited. The full terms of this license are available at https://www.dovepress.com/terms.php and incorporate the Creative Commons Attribution - Non Commercial (unported, v3.0) License.
By accessing the work you hereby accept the Terms. Non-commercial uses of the work are permitted without any further permission from Dove Medical Press Limited, provided the work is properly attributed. For permission for commercial use of this work, please see paragraphs 4.2 and 5 of our Terms.