")
Back to Journals » Diabetes, Metabolic Syndrome and Obesity » Volume 17
Triglyceride Glucose Index as an Indicator of Cardiovascular Risk in Syrian Refugees
Authors Hasan Ibrahim A, Hammad AM , Al-Qerem W , Alaqabani H , Hall FS, Alasmari F
Received 17 January 2024
Accepted for publication 15 March 2024
Published 22 March 2024 Volume 2024:17 Pages 1403—1414
DOI https://doi.org/10.2147/DMSO.S455050
Checked for plagiarism Yes
Review by Single anonymous peer review
Peer reviewer comments 2
Editor who approved publication: Dr Konstantinos Tziomalos
Ameerah Hasan Ibrahim,1 Alaa Mahmoud Hammad,1 Walid Al-Qerem,1 Hakam Alaqabani,1,2 F Scott Hall,3 Fawaz Alasmari4
1Department of Pharmacy, Faculty of Pharmacy, Al-Zaytoonah University of Jordan, Amman, Jordan; 2Strathclyde Institute of Pharmacy and Biomedical sciences, University of Strathclyde, Glasgow, UK; 3Department of Pharmacology and Experimental Therapeutics, College of Pharmacy and Pharmaceutical Sciences, University of Toledo, Toledo, OH, USA; 4Department of Pharmacology and Toxicology, College of Pharmacy, King Saud University, Riyadh, Saudi Arabia
Correspondence: Alaa Mahmoud Hammad, Department of Pharmacy, Faculty of Pharmacy, Al-Zaytoonah University of Jordan, P.O. Box 130, Amman, 11733, Jordan, Tel +962-6-4291511, Fax +962-6-4291432, Email [email protected]
Background: The triglyceride glucose (TyG) index is a quick and inexpensive approach to measure insulin resistance. The aim of this study was to evaluate the TyG index’s ability to predict cardiovascular risk and determine the TyG index cutoff values in Syrian refugees.
Methods: A retrospective research study was conducted with 756 Syrian refugees. Data on demographics and clinical laboratory assessments were obtained from refugee’s files. The formula Ln [fasting triglycerides (mg/dL) × fasting plasma glucose (mg (dL)/2] was used to calculate the TyG index. The Framingham risk score was used to calculate ten-year cardiovascular risk. The TyG index cutoff point was determined using the receiver operating characteristic curve (ROC).
Results: Included participants had a mean age of 56.76 ± 10.78 years and a mean body mass index (BMI) of 27.42 ± 4.03 kg/m2. 28.57% of the subjects were smokers, and the majority were female (56.75%). A significant moderate correlation was observed between TyG index and Framingham score (r = 0.428, p < 0.001). ROC curve analysis for TyG index and Framingham score showed an area under the curve (AUC) of 0.741 (95% CI = 0.691– 0.791; p < 0.001). The cutoff value of the TyG index to recognize intermediate/high risk Framingham risk score was 9.33, with a sensitivity of 64.3%, and specificity of 75.0%.
Conclusion: Our findings determine that, given a TyG index cutoff value of 9.33, the TyG index has a predictive ability to assess ten-year cardiovascular risk by comparison to the Framingham risk score in a high-risk group of Syrian refugees and can be used as an independent indicator of cardiovascular risk.
Keywords: TyG index, Framingham risk score, ROC, Syrian refugees, cardiovascular risk
Introduction
Cardiovascular diseases (CVD) are one of the leading causes of mortality and morbidity worldwide, accounting for a substantial burden on healthcare systems and societies.1 Insulin resistance (IR) is a vital risk factor for CVD, including ischemic heart disease, hypertension, and heart failure, the leading causes of morbidity and mortality worldwide.2 Previous research using the gold standard method for measuring IR, hyperinsulinemic-euglycemic clamping (HEC), has demonstrated an independent relationship between IR and CVD.3,4 IR is a contributing factor for cardiovascular events pathologically, including modifying other cardiovascular risk factors, such as gender and age and down-regulating insulin signaling pathways in many tissues.5,6 The triglyceride glucose (TyG) index, a biomarker for IR, can be used to identify IR in a variety of ethnic groups as an alternative to other classic methods, including HEC.7–10
Fasting plasma triglyceride and glucose concentrations are used to calculate the TyG index and indirectly evaluate IR.10 The TyG index is a straightforward, inexpensive marker that has been found to indicate IR in a more accurate manner than other substitute indicators, such as the Homeostasis Model Assessment of Insulin Resistance (HOMA-IR) or when linked to HEC.11–13 The TyG index has been used as a substitute for other measures of IR in this sense.14 Additionally, with sensitivity values between 67% and 96%, and specificity values between 32.5% and 85%, this alternative index for IR has demonstrated validity for predicting the probability of cardiovascular events,15 although further examination of its predictive validity is needed. The Framingham risk score (FRS) is an instrument that is used to determine the likelihood of impending cardiovascular events based on the existence or absence of specific risk factors.15 Alternative measures, such as the TyG index, might be able to predict the development of negative cardiovascular outcomes at an earlier stage in disease progression.
The TyG index is positively associated with a variety of cardiometabolic risk factors.16,17 High TyG index scores are associated with an increased prevalence of symptomatic coronary artery disease,16 as well as subclinical small vessel disease13 and coronary artery disease in asymptomatic patients.18 Similarly, in cases of type 2 diabetes and acute coronary syndrome, a higher TyG index was linked to an increased risk of negative cardiac outcomes of all types.19 A higher TyG index is also associated with worse outcomes after percutaneous coronary intervention. Consistent with these observations, high TyG index scores are associated with higher risk as determined by the FRS,17 and are predictive of the later development of CVD in a prospective study over a 10-year follow-up period.9 Given these considerations, we sought to explore the use of this index in an especially vulnerable population.
Syrian refugees in Jordan suffer from high disease burden and drug therapy problems (DTPs).20 The circumstances of refugees from Syria reflect similar problems worldwide for refugees. The number of refugees worldwide has increased dramatically since 2010, to more than 100 million people.21 The world’s overall health conditions and trends are reflected in the health problems that refugees face. For example, due to limited resources, inadequate nutrition, and limited healthcare in Syria under the current circumstances, Syrian refugees are more vulnerable to cardiovascular diseases.22,23 The epidemiology of disease among Syrian refugees is comparable in many respects to that of other nations around the world. Chronic illnesses, contagious infections, wounds, and mental and emotional issues plague Syrian refugees.24 One in 10 refugees are anticipated to be living with mild-to-moderate mental health conditions, including depression and anxiety, and one in 30 has more serious conditions owing to extended exposure to the traumatic consequences of the conflict.21 Furthermore, even before the war started, reports indicated that Syria had a high prevalence of non-communicable disorders.25 Consequently, being uprooted from their homes and losing their resources, the health of Syrian refugees has gotten worse.
One of the problems with providing healthcare to refugees is limited resources. Thus, organizations providing this care must seek to do more with fewer resources. Consequently, alternative approaches are sought for all aspects of healthcare, including diagnosis. As cardiac diseases are a major cause of death among refugees, as with the rest of the population, identifying approaches that can be more effectively used to assess the risk of negative cardiac outcomes is a critical need. The overall goal of the current study was to determine the cutoff threshold for the TyG index in Syrian refugees with cardiometabolic risk and to assess its ability to predict cardiovascular risk over ten years according to the FRS. Importantly, it provides an alternative simple, cost-effective indicator of CVD for Syrian refugees, an interesting high-risk population.
Materials and Methods
Subjects
A retrospective study was conducted between December 2022-March 2023 on data obtained from patients’ files in a Syrian refugee camp in Jordan (the Al-Zaatari camp). Data and participants’ details acquired were anonymized. As this study design is retrospective, there is no need to obtain written informed consent from the study participants prior to study commencement. However, database owner approval was obtained prior to study commencement. Ethical approval was obtained from Al-Zaytoonah University, with ethical committee approval number 16/7/2022–2023 on 16 July 2022. Furthermore, an approval for the study was obtained from the Jordanian Ministry of Health, approval number MOH/REC/2022/162, as well as the Jordanian Ministry of Interior Affairs, approval number 50,223/18,725, to use the information from the Al-Zaatari camp database. This study complies with the Declaration of Helsinki.26
Body mass index (BMI) was determined by dividing weight (in kilograms) by the square of height (in meters). Trained nurses measured systolic blood pressure (SBP) and diastolic blood pressure (DBP) of refugees in the Al-Zaatari camp, twice within a 5-minute interval, and the average of the two readings was considered as the final SBP and DBP values. Laboratory parameters assessed using standard clinical tests, in laboratories inside Al-Zaatari camp, included fasting blood glucose, thyroid stimulating hormone, thyroxin, aspartate aminotransferase (AST), alanine aminotransferase (ALT), HbA1c%, estimated glomerular filtration rate (eGFR), uric acid (UA), triglycerides (TG), high-density lipoprotein cholesterol (HDL-C), and low-density lipoprotein cholesterol (LDL-C). eGFR was calculated according to serum creatinine, age, and sex using a modification of the diet in the renal disease trial (MDRD) formula.
The included data were for the patients who satisfied the following criteria, 1) Age of 18 or older; 2) Had at least a one recorded triglyceride reading and one fasting blood glucose reading at the time of the study; 3) Present CVD established or incidence of cardiometabolic risk factors such as, BMI ≥ 25 kg/m2, total cholesterol ≥200 mg/dL, triglycerides ≥150 mg/dL, HDL-C at low concentrations (men <40 mg/dl and women <50 mg/dl), SBP and DBP ≥130/ ≥85 mmHg or diagnosis of arterial hypertension (AH), glucose fasting ≥100 mg/DL or diagnoses of diabetes mellitus (DM). The total number of refugees screened was 1576, 720 refugees had no CVD established or incidence of cardiometabolic risk factors, 100 refugees had no TG reading or fasting blood glucose reading and were excluded due to incomplete data, and 756 refugees were finally included in the analysis (Figure 1).
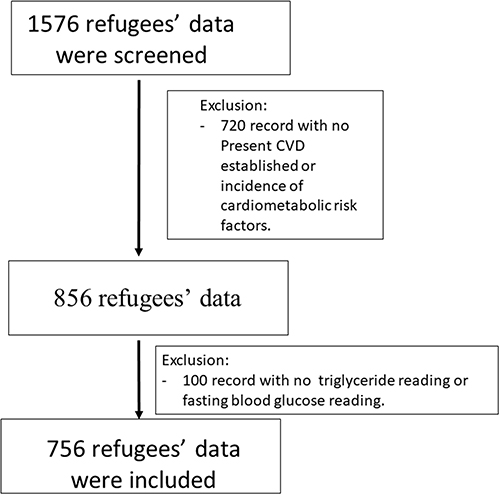 |
Figure 1 Flow chart of refugees’ data included in the analysis. |
TyG Index and Framingham Risk Score
The imported data included age, sex, smoking status, BMI, chronic diseases, medications history, laboratory tests, and vital signs. Mean Arterial Pressure (MAP) was calculated based on the following equation: MAP =1/3 * Systolic blood pressure (SBP) + 2/3 * Diastolic blood pressure (DBP).27 Pulse Pressure (PP) was measured as the difference between SBP and DBP.24 Triglyceride (TyG) index was calculated as TyG index = ln (fasting TG [mg/dL] × fasting glucose [mg/dL]/2).28 The FRS for CVD risk was calculated to estimate the 10-year risk of cardiovascular diseases, according to 2013 ACC/AHA guidelines on the assessment of cardiovascular risk.29 Participants were categorized as low risk (<10%), intermediate risk (10–19%), or high risk (>20%). In this study, intermediate and high-risk categories were combined for subsequent analysis. Thus, FRS has two categories, low risk and intermediate/high risk. The mean of vitals and laboratory tests were calculated when more than one value appeared in medical records.
Statistical Analysis
The statistical analysis of the data in this study was conducted using SPSS version 27. Categorical variables were presented as frequency and percentage (%) and analyzed using Pearson’s chi-square test. Continuous variables were presented as mean ± standard deviation (SD). The Kolmogorov–Smirnov test was used to evaluate data normality. Student’s t-test or Mann–Whitney U-test was utilized following the measurement of normality of quantitative variables. Pearson’s correlation test was applied to examine the correlation between Framingham risk score, TyG index, HbA1c%, and fasting blood glucose, as well as fasting triglyceride with different BP indicators, GFR, Framingham score, uric acid, and HbA1c%. Binary logistic regression analysis was performed to determine the association of the TyG index with the Framingham risk score (0 = low risk, 1 = intermediate/high risk). An unadjusted model was assessed, as well as another model adjusted for possible confounding factors determined from the literature (gender, age, diabetes, hypertension, and BMI). The receiver operating characteristic curve (ROC) was developed using SPSS to assess the ability of the TyG index, HbA1c%, and fasting blood glucose to indicate cardiovascular risk through the Framingham 10-year risk score. The ROC was illustrated by area under the curve (AUC) with its respective 95% confidence interval. Moreover, sensitivity and specificity of the ROC were measured. TyG cutoff value was recognized as the point corresponding to the best balance between sensitivity and specificity. In all analyses, a significance level of 0.05 was used.
Results
The participants’ demographics and health status are shown in Table 1. A total of 756 patients fulfilled the study inclusion criteria with a mean age of 56.76 ±10.78 years and a mean BMI of 27.42 ± 4.03 kg/m2, of which 28.57% were smokers and the majority (56.75%) were female. The most common chronic disease among the participants was Type 2 Diabetes Mellitus (T2DM) (70.6%), followed by hypertension (69.44%).
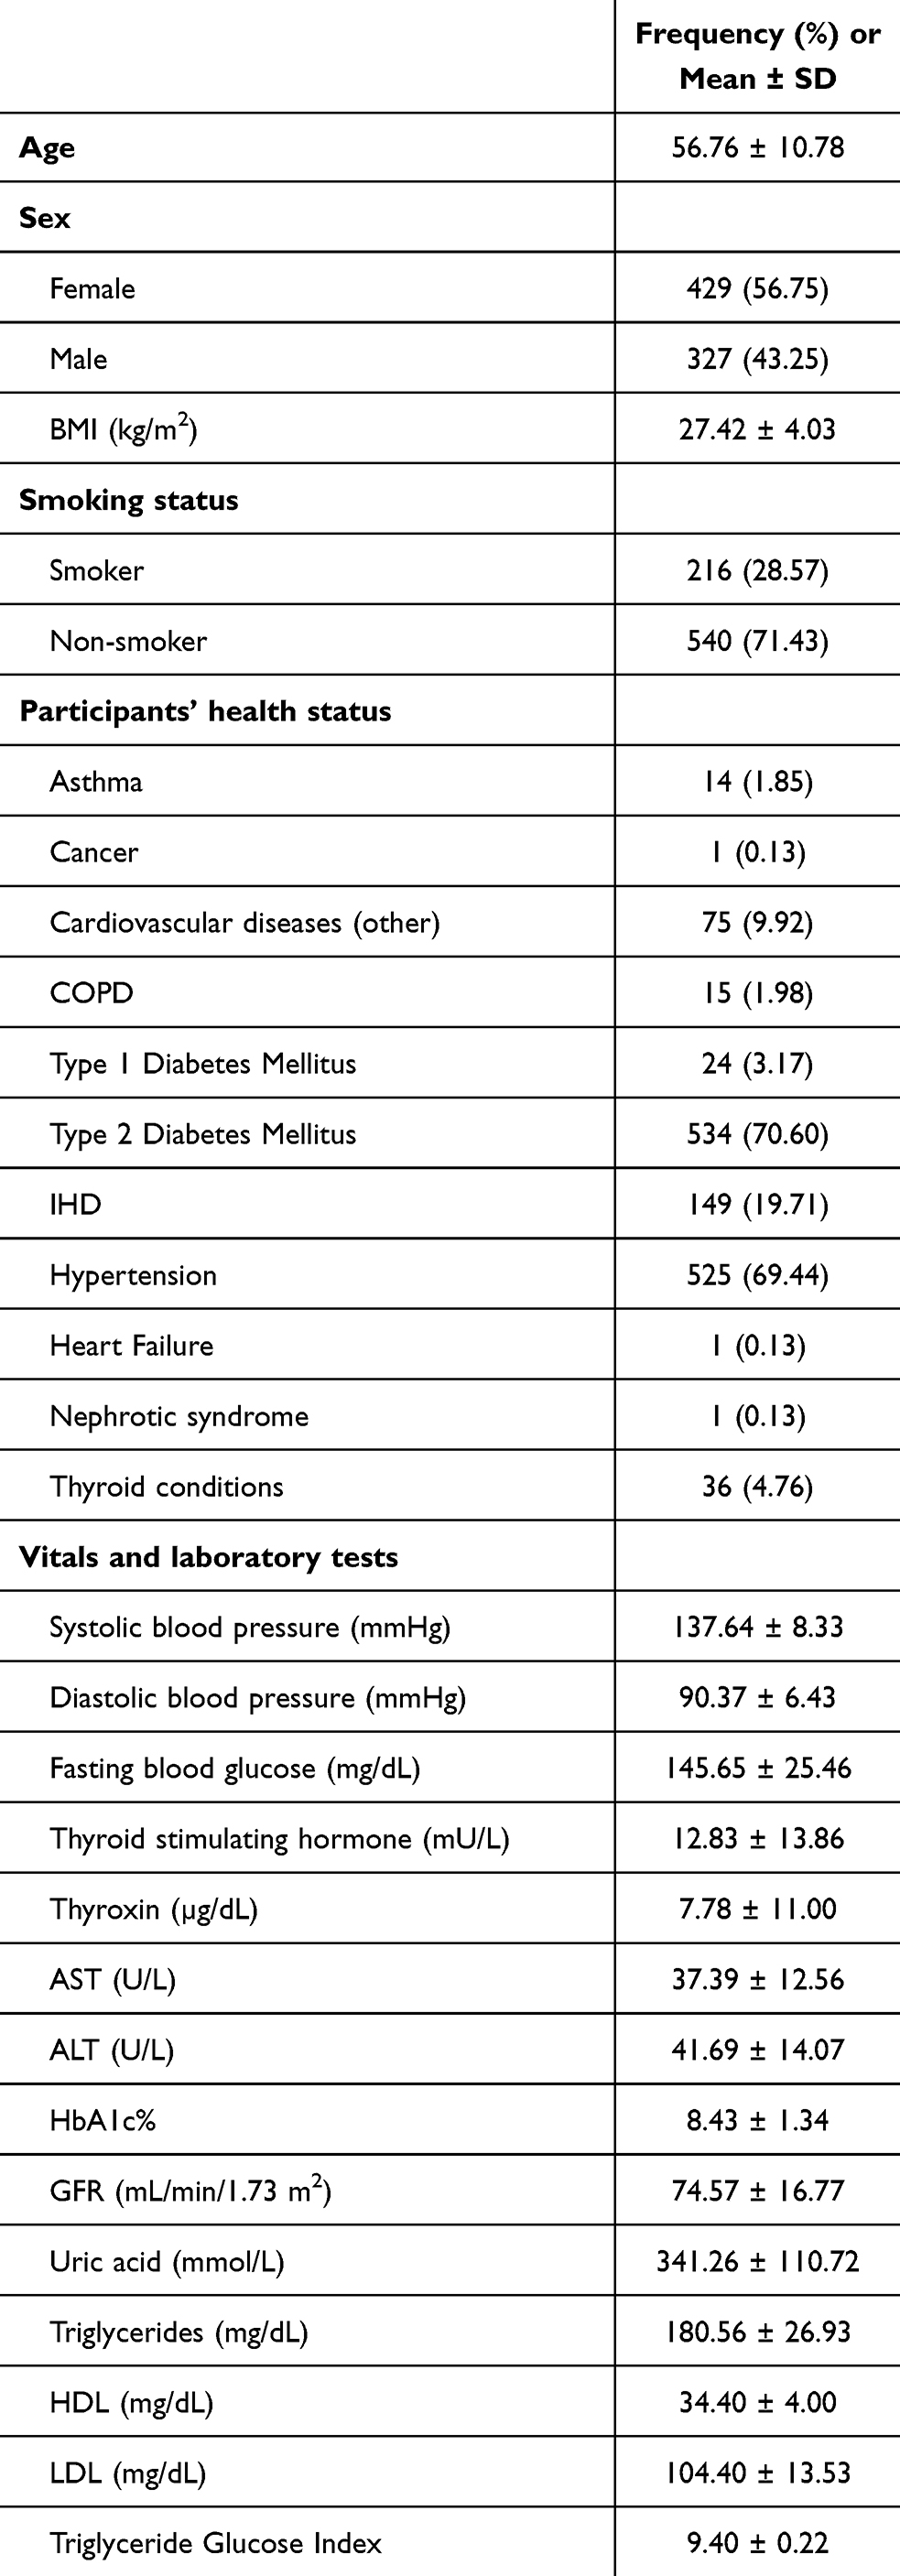 |
Table 1 Participant Demographics (Frequency (%) or Mean ± SD) |
As shown in Table 2, significant moderate correlations were observed between the TyG index and FRS (r = 0.43, p < 0.001) and between the TyG index and HbA1c% (r = 0.43, p < 0.001). Significant weak correlations were observed between the TyG index and uric acid (r = 0.19, p = 0.026). Similarly, the TyG index was significantly, but weakly, correlated with all blood pressure indicators (p < 0.001). Regarding fasting triglyceride, significant moderate correlations were observed between fasting triglyceride and the Framingham score (r = 0.49, p < 0.001). Likewise, fasting triglyceride was significantly correlated with all blood pressure indicators (p < 0.001). However, no significant correlation was found between HbA1c% and other measures. Moreover, weak correlations were observed between fasting blood glucose and FRS (r = 0.14, p < 0.001).
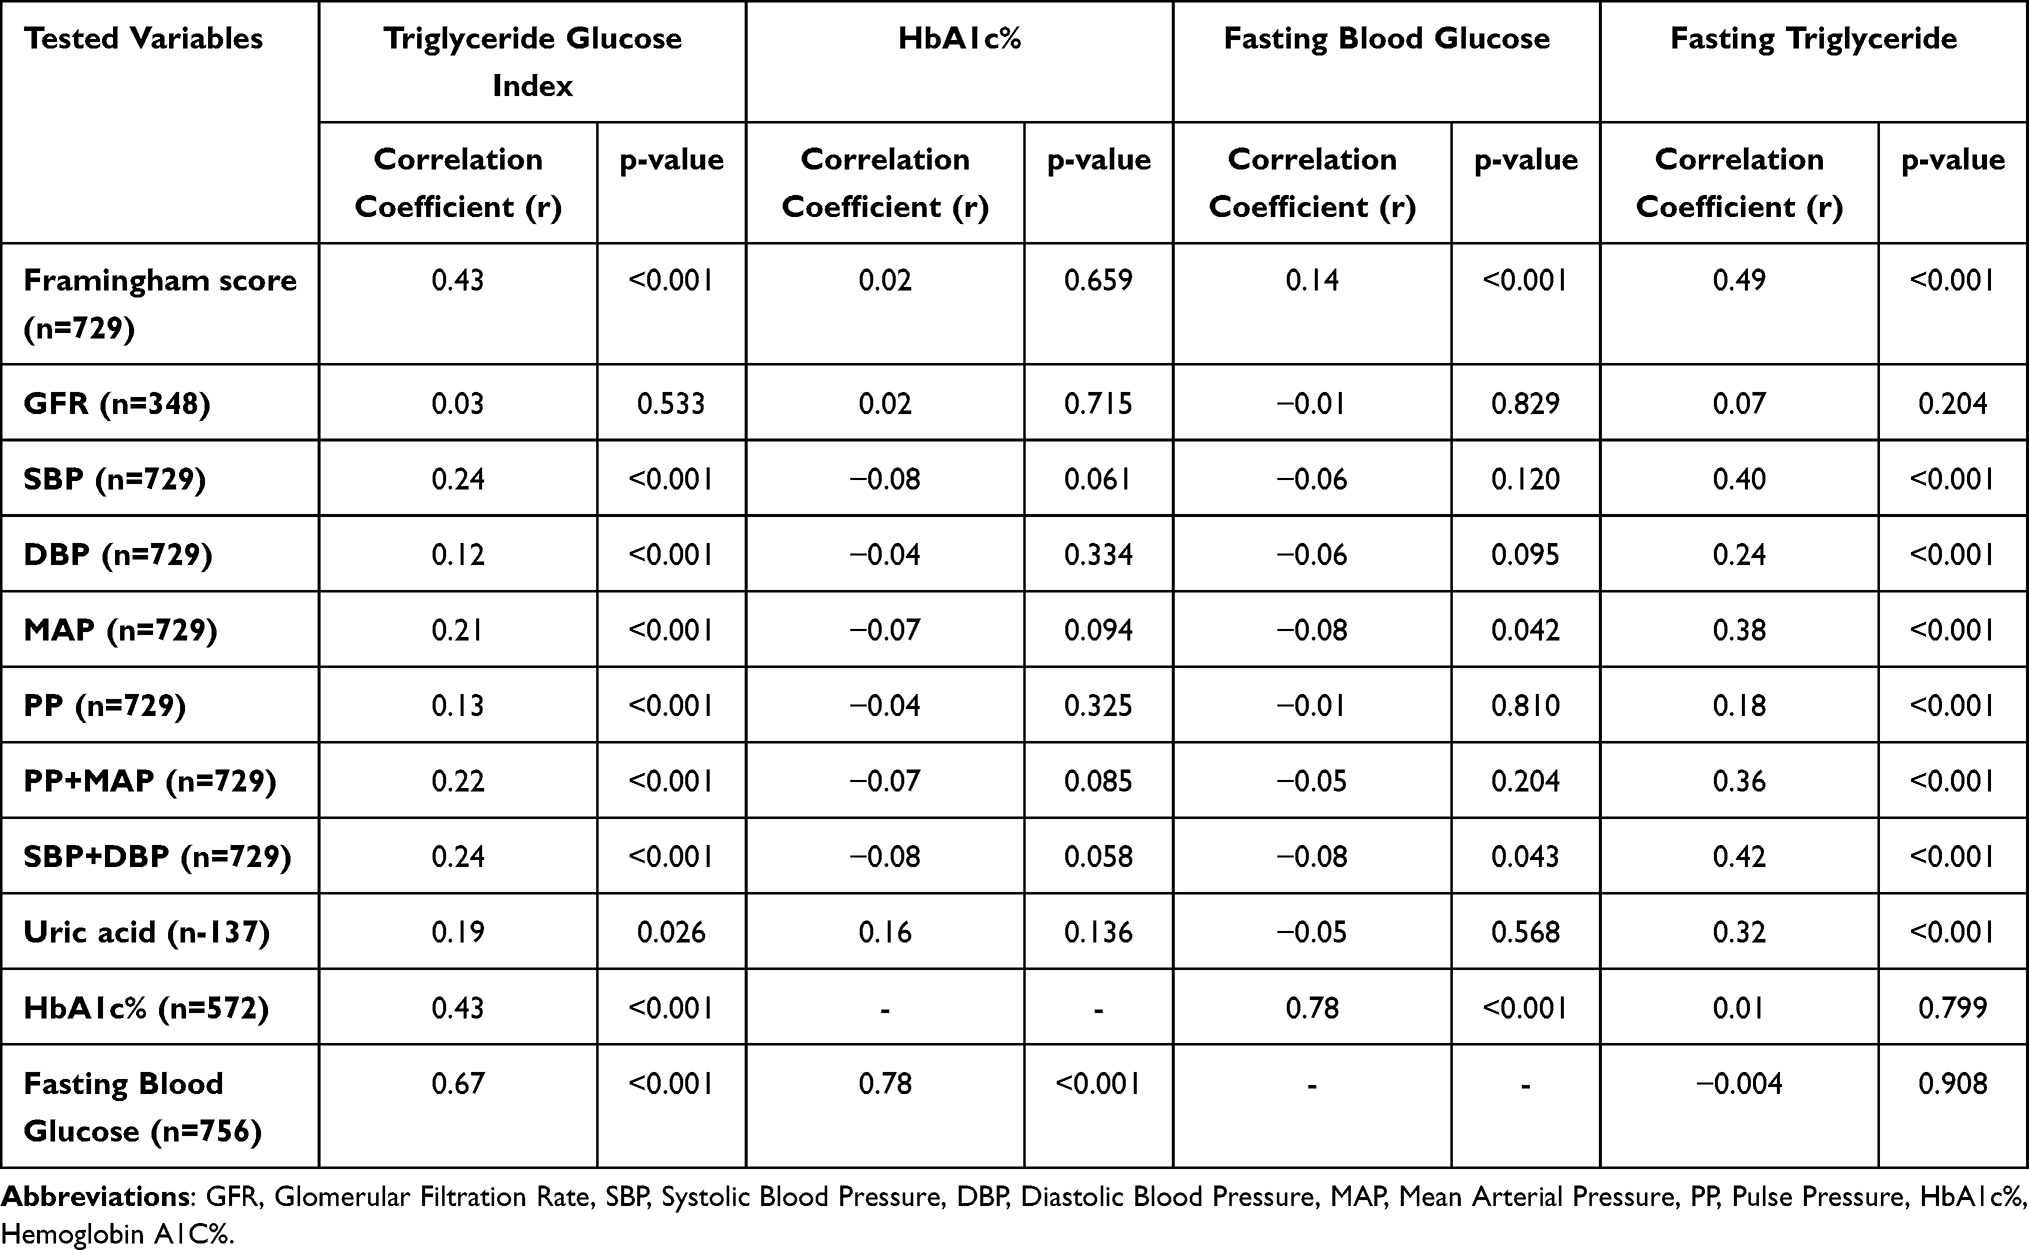 |
Table 2 Correlation Between Triglyceride Glucose Index, HbA1c%, Fasting Blood Glucose as Well as Fasting Triglyceride with Different Variables |
ROC curve analysis for the TyG index showed an AUC of 0.741 (95% CI = 0.691–0.791; p < 0.001). The cutoff value of the TyG index to recognize intermediate/high risk FRS was 9.33, with a sensitivity of 64.3% and specificity of 75.0%, a positive predictive value of 93.7% and an equal negative predictive value of 26.7% (Figure 2A). Similarly, ROC curve analysis for HbA1c showed an AUC of 0.515 (95% CI = 0.432–0.598; p = 0.726), (Figure 2B). ROC curve analysis for fasting blood glucose showed an AUC of 0.643 (95% CI = 0.581–0.704; p < 0.001) (Figure 2C). In addition, ROC curve analysis for fasting triglyceride showed an AUC of 0.720 (95% CI = 0.674–0.765; p < 0.001) (Figure 2D).
 |
Figure 2 (A) Operational characteristic curve of the ROC for the TyG index to predict ten-year cardiovascular risk as assessed by the FRS in Syrian Refugees (n = 756). (B) Operational characteristic curve of the ROC for the HbA1c to predict ten-year cardiovascular risk as assessed by the FRS in Syrian Refugees (n = 756). (C) Operational characteristic curve of the ROC for the Fasting blood glucose to predict ten-year cardiovascular risk as assessed by the FRS in Syrian Refugees (n = 756). (D) Operational characteristic curve of the ROC for the Fasting triglyceride to predict ten-year cardiovascular risk as assessed by the FRS in Syrian Refugees (n = 756). |
According to Pearson’s correlation values and the AUC of the ROC analysis, the cutoff value to indicate intermediate-high risk of negative cardiovascular outcomes was determined based on TyG index. Participants with high TyG (TyG ≥9.3346) had significantly higher TG, LDL-C, UA, ALT, AST, SBP, and DBP values, as well as a higher prevalence of smoking, diabetes, and hypertension compared to those with low TyG (TyG <9.3346; Table 3). Moreover, lower HDL-C values in the high TyG group were observed compared to the group with lower index values. In addition, a higher frequency of participants with intermediate/high risk of emerging cardiovascular events in FRS was detected in those with high values of the TyG index.
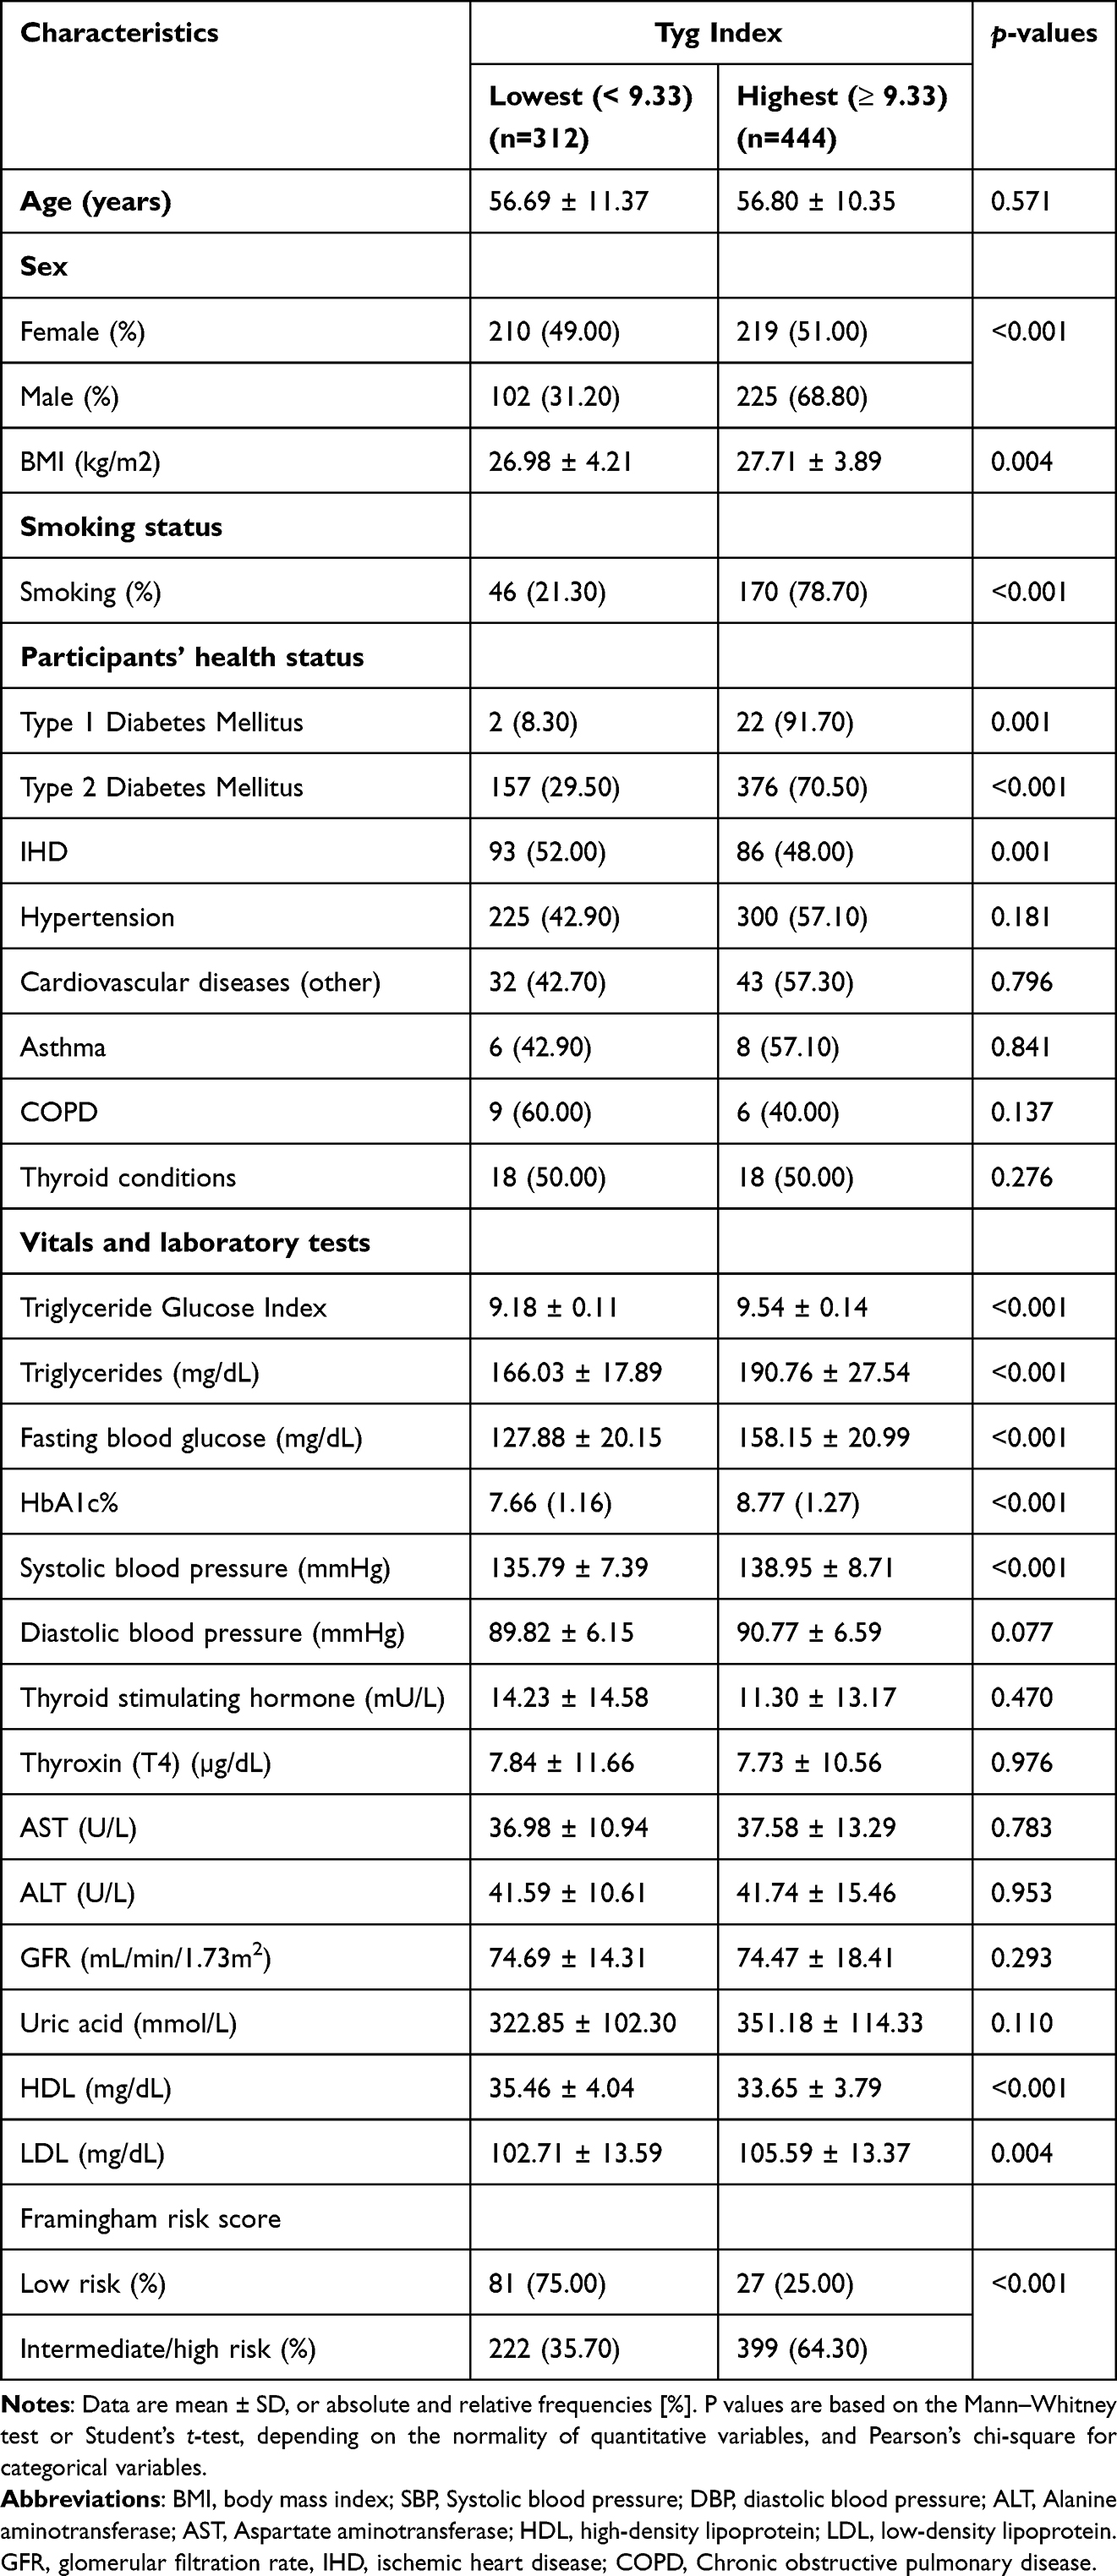 |
Table 3 Demographic, Smoking Status, Participant Health-Status, and Vitals and Laboratory Tests of the Sample According to TyG Index Categories (n = 756) |
Binary Logistic Regression Analysis showed that the TyG index was an independent risk factor for intermediate or high risk in all participants (OR = 5.39, 95% CI 3.38–8.58, p < 0.001). This relationship remained statistically significant even after adjusting for confounding variables including gender, age, diabetes status, hypertension status, and BMI (OR = 4.41, 95% CI 1.78–10.93, p = 0.001), Table 4.
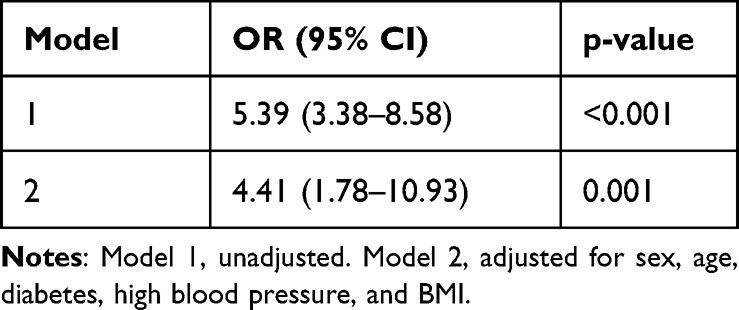 |
Table 4 Logistic Regression Analysis of the Association Between the TyG Index and Framingham Risk Score |
Discussion
The findings from this study verified a significant relationship between increasing TyG index values and an elevated risk of CVD over a ten-year period. The cutoff value was based on the ROC analysis was 9.33, with a sensitivity of 64.3% and a specificity of 75.0%. As seen in the ROC analysis, AUC for TyG index is superior to other indicators of CVD, including HbA1c and fasting blood glucose. There is little existing literature that examined the TyG index cutoff value and its ability to indicate cardiovascular risk over ten years as determined by the FRS, and none in a population with the sort of risk factors characteristic of these Syrian refugees.
Understanding the intricate mechanisms underlying the pathology, physiology, and molecular biology of fasting glucose and triglycerides unveils crucial insights into their role in precipitating cardiovascular disease and adverse cardiovascular events. Elevated levels of fasting glucose and triglycerides contribute to the dysregulation of metabolic pathways, fostering a pro-inflammatory state within the vasculature and promoting endothelial dysfunction.30 Prolonged hyperglycemia triggers advanced glycation end product formation, oxidative stress, and endothelial injury, fostering atherosclerosis progression and plaque destabilization.31 Concurrently, elevated triglycerides stimulate the production of atherogenic lipoproteins, fostering lipid accumulation within arterial walls and promoting foam cell formation.32 Moreover, dyslipidemia perturbs endothelial integrity, exacerbating inflammation and thrombosis, thereby escalating the risk of cardiovascular events.31 At the molecular level, intricate signaling cascades involving insulin resistance, lipoprotein lipase dysfunction, and dysregulated lipid metabolism converge to perpetuate cardiovascular pathogenesis. Comprehending these multifaceted mechanisms is pivotal for devising targeted therapeutic interventions aimed at mitigating the burden of cardiovascular disease and enhancing patient outcomes.33
Previous work has shown that the TyG index might be predictive of negative cardiac outcomes in a variety of circumstances. To being with, TyG scores are positively associated with a variety of cardiometabolic risk factors.16,17 High TyG index scores are associated with an increased prevalence of CVD,9,16 and more negative cardiac outcomes in a variety of circumstances,17,19 as well as subclinical presentation of CVD.13,18 These last findings are especially important since they suggest an early utility of the measure for predicting the development of CVD.
In the present study, we used the FRS as a reference to examine the TyG index as an indicator of ten-year cardiovascular risk among Syrian refugees. Another study conducted on a Brazilian population supports these findings, demonstrating that the TyG index has a good indicator of ten-year cardiovascular risk as determined by the FRS.17 However, our study was conducted on a larger sample size, where the AUC was higher, and potential confounding or intermediate factors such as HbA1c and fasting blood glucose were evaluated. Furthermore, this differs from a previous study where the TyG index was one of the factors used to calculate the FRS.9 For example, Sánchez-Íñigo et al (2016) compared FRS plus the TyG index with the FRS alone in predicting cardiovascular events.9 They found that the precision of the risk for CVD increased when the TyG index was included in the model, leading to an increased AUC value (0.719) compared to that seen with the FRS model alone (0.708; p = 0.014).9
Previous research revealed a cutoff value of >9.0 for the TyG index to predict cardiovascular risk.8,17,19 Araújo et. Al (2022) identified a TyG index cutoff value of 9.04 (AUC = 0.678, sensitivity = 62.5%, specificity = 66.7%) in participants with cardiometabolic risk evaluated by the FRS.17 In a retrospective observational study, the TyG index’s ability to foresee major adverse cardiovascular events (MACE) in individuals with diabetes and acute coronary syndrome was determined to have a predictive capacity of 9.323 (sensitivity = 46.0%, specificity = 63.6% and AUC = 0.560).7 Luo et al (2019) identified 0.685 as the AUC of the TyG index to assume the occurrence of adverse cardiovascular events in ST-segment elevation myocardial infarction (STEMI) patients after percutaneous coronary intervention (PCI) and the incidence of occurrence of adverse cardiovascular events was higher among those STEMI patients with TyG index levels in the highest quartile (TyG index ≥9.608).19 These findings are parallel to our results in which the cutoff value for the TyG index was 9.3346.
Existing literature revealed a significant association between the TyG index and an elevated risk of type 2 diabetes and hypertension.8,9 In our study, those with high TyG (≥9.3346) had significantly higher prevalence of type 2 diabetes and hypertension in comparison to people with low TyG (<9.3346). As noted in this study, participants with high triglyceride values (TyG ≥9.3346) were linked to cardiometabolic risk factors such as elevated LDL, triglycerides, ALT, AST, uric acid, diastolic blood pressure, systolic blood pressure, and smoking, which have also been demonstrated to be CVD risk factors with other approaches.16,17
In this study, HbA1c and fasting blood glucose were found to be weaker indicators of cardiovascular events than has often been found or assumed (for review see)34 As is clear in that review, a pre-diabetic state predicts progression to more serious conditions, including the development of diabetes and CVD. However, as that review notes that progression is far from absolute and despite highly significant odds ratios. Consequently, not all studies show significant relationships for these outcomes. For instance, one study that explored the correlation between HbA1c levels and cardiovascular events in individuals diagnosed with type 2 diabetes revealed only a moderate connection that, while notable, did not reach statistical significance.35 Conversely, a separate investigation published in Diabetes in 2014 proposed a gradual increase in the risk of cardiovascular disease corresponding to elevated HbA1c levels.36 Moreover, a study has revealed that fasting glucose blood level is not an independent indicator of risk for cardiovascular events in type 2 diabetes.37 Consequently, that these relationships were apparent, but not significant in the present study, is not completely surprising.
A key strength of the study presented here is the large sample size, which includes almost all Syrian refugees with cardiometabolic risk living in the Zaatari refugee camp. In addition, this study, to our knowledge, is the first to evaluate the TyG index in accordance with the FRS in individuals such as these Syrian refugees at cardiovascular risk. Populations such as this, because of their experiences in war and as refugees, may be at much higher risk for stress-related diseases, including CVD. The fact that the suggested cutoff value had reasonable sensitivity and specificity supports the validity of this index for monitoring people at high cardiovascular risk. This study also has some limitations, including the retrospective nature of this study. Additionally, merging the groups of participants at moderate and high risk limits the ability to determine how sensitive the TyG is to measure severity of CVD outcomes.
Conclusion
Our findings suggest that, given the TyG index’s cutoff value of 9.33, the TyG index has predictive validity for assessing ten-year cardiovascular risk (as determined by the FRS). In light of this, the application of the TyG index for cardiovascular risk screening appears helpful for the initial detection of patients who are at high risk for cardiovascular events in health practice. Importantly, it provides an alternative simple, cost-effective indicator of CVD for Syrian refugees, an interesting high-risk population.
Data Sharing Statement
All data generated or analysed during this study are included in this published article.
Ethics Approval
Ethical approval was obtained from Al-Zaytoonah University ethical committee approval number 26/12/2019–2020.
Funding
This work was supported by Al-Zaytoonah University of Jordan (Grant no. 26/12/2019–2020) as well as supported by the researchers supporting project number (RSP2024R235), King Saud University, Riyadh, Saudi Arabia.
Disclosure
The authors have no relevant financial or non-financial interests to disclose for this work.
References
1. Labarthe DR. Epidemiology and prevention of cardiovascular diseases, a global challenge, a global challenge; 2010.
2. Ormazabal V, Nair S, Elfeky O, et al. Association between insulin resistance and the development of cardiovascular disease. Cardiovasc Diabetol. 2018;17(1):1–14. doi:10.1186/s12933-018-0762-4
3. Hung AM, Sundell MB, Egbert P, et al. A comparison of novel and commonly-used indices of insulin sensitivity in African American chronic hemodialysis patients. Clin J Am Soc Nephrol. 2011;6(4):767. doi:10.2215/CJN.08070910
4. Jia T, Huang X, Qureshi AR, et al. Validation of insulin sensitivity surrogate indices and prediction of clinical outcomes in individuals with and without impaired renal function. Kidney Int. 2014;86(2):383–391. doi:10.1038/ki.2014.1
5. Aronis KN, Mantzoros CS. A brief history of insulin resistance, from the first insulin radioimmunoassay to selectively targeting protein kinase C pathways. Metabolism. 2012;61(4):445–449. doi:10.1016/j.metabol.2012.01.001
6. Laakso M. Is insulin resistance a feature of or a primary risk factor for cardiovascular disease? Curr Diab Rep. 2015;15(12):1–9. doi:10.1007/s11892-015-0684-4
7. Zhang S, Yin R-X, Gao H, et al. The triglyceride and glucose index (TyG) is an effective biomarker to identify nonalcoholic fatty liver disease. Lipids Health Dis. 2017;16(1):1–8. doi:10.1186/s12944-016-0392-3
8. Won K-B, Park EJ, Han D, et al. Triglyceride glucose index is an independent predictor for the progression of coronary artery calcification in the absence of heavy coronary artery calcification at baseline. Cardiovasc Diabetol. 2020;19(1):1–8. doi:10.1186/s12933-020-01008-5
9. Sánchez‐íñigo L, Navarro‐González D, Fernández‐Montero A, et al. The TyG index may predict the development of cardiovascular events. Eur J Clin Invest. 2016;46(2):189–197. doi:10.1111/eci.12583
10. Simental-Mendía LE, Rodríguez-Morán M, Guerrero-Romero F. The product of fasting glucose and triglycerides as surrogate for identifying insulin resistance in apparently healthy subjects. Metab Syndr Relat Disord. 2008;6(4):299–304. doi:10.1089/met.2008.0034
11. Irace C, Carallo C, Scavelli FB, et al. Markers of insulin resistance and carotid atherosclerosis. A comparison of the homeostasis model assessment and triglyceride glucose index. Int J Clin Pract. 2013;67(7):665–672. doi:10.1111/ijcp.12124
12. Vasques ACJ, Novaes FS, de Oliveira MDS, et al. TyG index performs better than HOMA in a Brazilian population, a hyperglycemic clamp validated study. Diabetes Res Clin Pract. 2011;93(3):e98–e100. doi:10.1016/j.diabres.2011.05.030
13. Nam K-W, Kwon H-M, Jeong H-Y, et al. High triglyceride-glucose index is associated with subclinical cerebral small vessel disease in a healthy population, a cross-sectional study. Cardiovasc Diabetol. 2020;19(1):1–8. doi:10.1186/s12933-020-01031-6
14. Guerrero-Romero F, Simental-Mendia LE, Gonzalez-Ortiz M, et al. The product of triglycerides and glucose, a simple measure of insulin sensitivity. Comparison with the euglycemic-hyperinsulinemic clamp. J Clin Endocrinol Metab. 2010;95(7):3347–3351. doi:10.1210/jc.2010-0288
15. Sanchez-Garcia A, Rodríguez-Gutiérrez R, Mancillas-Adame L, et al. Diagnostic accuracy of the triglyceride and glucose index for insulin resistance, a systematic review. Int J Endocrinol. 2020;2020:1–7. doi:10.1155/2020/4678526
16. da Silva A, Caldas APS, Hermsdorff HHM, et al. Triglyceride-glucose index is associated with symptomatic coronary artery disease in patients in secondary care. Cardiovasc Diabetol. 2019;18(1):1–8. doi:10.1186/s12933-019-0893-2
17. Araújo SP, Juvanhol LL, Bressan J, Hermsdorff HH. Triglyceride glucose index, A new biomarker in predicting cardiovascular risk. Prev Med Rep. 2022;29:101941. doi:10.1016/j.pmedr.2022.101941
18. Park G-M, Cho Y-R, Won K-B, et al. Triglyceride glucose index is a useful marker for predicting subclinical coronary artery disease in the absence of traditional risk factors. Lipids Health Dis. 2020;19(1):1–7. doi:10.1186/s12944-020-1187-0
19. Luo E, Wang D, Yan G, et al. High triglyceride–glucose index is associated with poor prognosis in patients with acute ST-elevation myocardial infarction after percutaneous coronary intervention. Cardiovasc Diabetol. 2019;18(1):1–12. doi:10.1186/s12933-019-0957-3
20. Doocy S, Lyles E, Akhu-Zaheya L, et al. Health service access and utilization among Syrian refugees in Jordan. Int J Equity Health. 2016;15(1):1–15. doi:10.1186/s12939-016-0399-4
21. UNHCR; 2022 [cited January 11, 2023]. Available from: https://www.unrefugees.org/news/rebuilding-futures-how-unhcr-is-empowering-syrian-refugees-through-mental-health-support/#,~,text=In%20Syria%2C%20the%20prevalence%20of,to%20prolonged%20exposure%20to%20conflict.
22. Hammad AM, Al Qerem W, Alaqabani H, Alasmari F, Ling J. Factors influencing hypertension and diabetes mellitus control among Syrian refugees in Zaatari refugee camp. Eur Rev Med Pharmacol Sci. 2022;26(7).
23. Ali N, Al Ganideh SF. Syrian refugees in Jordan, Burden or boon. Res World Econ. 2020;11(1):180–194. doi:10.5430/rwe.v11n1p180
24. Dator W, Abunab H, Dao-Ayen N. Health challenges and access to health care among Syrian refugees in Jordan, a review. East Mediterr Health J. 2018;24(7):680–686. doi:10.26719/2018.24.7.680
25. Doocy S, Lyles E, Roberton T, et al. Prevalence and care-seeking for chronic diseases among Syrian refugees in Jordan. BMC Public Health. 2015;15(1):1–10. doi:10.1186/s12889-015-2429-3
26. Ashcroft RE. The declaration of Helsinki. Oxford Textbook Clin Res Ethics. 2008;141–148.
27. Schwartz GL, Sheps SG. The sixth report of the joint national committee on prevention, detection, evaluation, and treatment of high blood pressure. Arch Intern Med. 1997;157(21):2413–2446. doi:10.1001/archinte.1997.00440420033005
28. Zheng R, Mao Y. Triglyceride and glucose (TyG) index as a predictor of incident hypertension, a 9-year longitudinal population-based study. Lipids Health Dis. 2017;16(1):1–7. doi:10.1186/s12944-017-0562-y
29. Anderson TJ, Grégoire J, Hegele RA, et al. 2012 update of the Canadian Cardiovascular Society guidelines for the diagnosis and treatment of dyslipidemia for the prevention of cardiovascular disease in the adult. Cana J Cardiol. 2013;29(2):151–167. doi:10.1016/j.cjca.2012.11.032
30. Sena CM, Carrilho F, Seiça RM. Endothelial dysfunction in type 2 diabetes, targeting inflammation. Endothelial Dysfunction. 2018;24:23110.
31. Dwaib HS, AlZaim I, Eid AH, et al. Modulatory effect of intermittent fasting on adipose tissue inflammation, amelioration of cardiovascular dysfunction in early metabolic impairment. Front Pharmacol. 2021;12:626313. doi:10.3389/fphar.2021.626313
32. Luk C, Haywood NJ, Bridge KI, et al. Paracrine role of the endothelium in metabolic homeostasis in health and nutrient excess. Front Cardiovasc Med. 2022;9:882923. doi:10.3389/fcvm.2022.882923
33. Ertunc ME, Hotamisligil GS. Lipid signaling and lipotoxicity in metaflammation, indications for metabolic disease pathogenesis and treatment. J Lipid Res. 2016;57(12):2099–2114. doi:10.1194/jlr.R066514
34. Echouffo-Tcheugui JB, Perreault L, Ji L, et al. Diagnosis and management of prediabetes, a review. JAMA. 2023;329(14):1206–1216. doi:10.1001/jama.2023.4063
35. Kranenburg G, van der Graaf Y, van der Leeuw J, et al. The relation between HbA1c and cardiovascular events in patients with type 2 diabetes with and without vascular disease. Diabetes Care. 2015;38(10):1930–1936. doi:10.2337/dc15-0493
36. Zhao W, Katzmarzyk PT, Horswell R, et al. HbA1c and coronary heart disease risk among diabetic patients. Diabetes Care. 2014;37(2):428–435. doi:10.2337/dc13-1525
37. Cavalot F, Petrelli A, Traversa M, et al. Postprandial blood glucose is a stronger predictor of cardiovascular events than fasting blood glucose in type 2 diabetes mellitus, particularly in women, lessons from the san Luigi Gonzaga diabetes study. J Clin Endocrinol Metab. 2006;91(3):813–819. doi:10.1210/jc.2005-1005
 © 2024 The Author(s). This work is published and licensed by Dove Medical Press Limited. The full terms of this license are available at https://www.dovepress.com/terms.php and incorporate the Creative Commons Attribution - Non Commercial (unported, v3.0) License.
By accessing the work you hereby accept the Terms. Non-commercial uses of the work are permitted without any further permission from Dove Medical Press Limited, provided the work is properly attributed. For permission for commercial use of this work, please see paragraphs 4.2 and 5 of our Terms.
© 2024 The Author(s). This work is published and licensed by Dove Medical Press Limited. The full terms of this license are available at https://www.dovepress.com/terms.php and incorporate the Creative Commons Attribution - Non Commercial (unported, v3.0) License.
By accessing the work you hereby accept the Terms. Non-commercial uses of the work are permitted without any further permission from Dove Medical Press Limited, provided the work is properly attributed. For permission for commercial use of this work, please see paragraphs 4.2 and 5 of our Terms.