")
Back to Journals » Clinical Ophthalmology » Volume 18
Trends in Medicare Submitted Charges to Allowed Payment Ratios for Ophthalmology Services
Authors Elhusseiny AM, Chauhan MZ, Sallam AB
Received 24 August 2023
Accepted for publication 21 November 2023
Published 18 March 2024 Volume 2024:18 Pages 859—863
DOI https://doi.org/10.2147/OPTH.S436918
Checked for plagiarism Yes
Review by Single anonymous peer review
Peer reviewer comments 2
Editor who approved publication: Dr Scott Fraser
Abdelrahman M Elhusseiny,1,2 Muhammad Z Chauhan,1 Ahmed B Sallam1,3
1Department of Ophthalmology, Harvey and Bernice Jones Eye Institute, the University of Arkansas for Medical Sciences, Little Rock, AR, USA; 2Department of Ophthalmology, Boston Children’s Hospital, Harvard Medical School, Boston, MA, USA; 3Department of Ophthalmology, Ain Shams University, Cairo, Egypt
Correspondence: Ahmed B Sallam, Department of Ophthalmology, Jones Eye Institute, the University of Arkansas for Medical Sciences, 4301 W Markham Street # 523, Little Rock, AR, 72205, USA, Email [email protected]
Purpose: Many physicians charge more than the Medicare insurance program pays. Current charge-to-payment ratios in ophthalmology and trends over the years are unknown. In this work, we examined physician charge-to-payment ratios in ophthalmology across procedures and consultations.
Methods: We utilized data from 100% final-action physician/supplier Part B Medicare fee-for-service (FFS) population from 2015 to 2020. We retrieved data on ophthalmic procedures and consultations, both facility-based and non-facility-based, conducted by ≥ 50 ophthalmologists. We analyzed median charge-to-payment ratios, which were calculated as submitted charges divided by the Medicare-allowed payments, between ophthalmic procedures and consultations to assess for trends over the study period.
Results: We find that the median charge-to-payment ratio for all current procedural terminology (CPT) codes in 2020 was 2.23 (Interquartile range (IQR): 1.54– 3.27) as compared to 2.00 (IQR: 1.39– 2.92) in 2015, an overall 2.76% average annual growth rate from 2015– 2020. For ophthalmic procedures, the median charge-to-payment ratio in 2020 was 3.03 (IQR: 2.13– 4.41) compared to 2.79 (IQR: 1.96– 3.97) in 2015, corresponding to a 2.01% AAGR from 2015– 2020. For consultations, those rates were 2.06 (IQR: 1.48– 2.96), 1.85 (IQR: 1.33– 2.59), and 2.71%, respectively.
Conclusion: We found that the submitted charge-to-Medicare payment ratios among ophthalmic procedures and consultations have steadily increased since 2015. However, there was a relatively low rate of excess charges for ophthalmology services compared to other surgical-based specialties with minimal variation among providers.
Keywords: medicare excess charge, ophthalmology services, billing, trends, allowed medicare payments
Introduction
Over the past decade, the Medicare medical insurance plan has undergone significant changes. Frequently, physician charges for Medicare services exceed allowed payments (excess charges); this disparity enables the determination of charges that may fall on patients who are uninsured or who have out-of-network commercial insurance.1,2 In 2017, a national study conducted by Bai and Anderson demonstrated wide variations in the charge-to-payment ratio among different subspecialties.1 They reported that the highest median charge-to-payment ratio was that of anesthesiology (5.8), and the lowest ratio was for general practice (1.6).1 Another study conducted by Gronbeck and Feng evaluated the variations in submitted charges to allowed Medicare payment for dermatology services from 2013 to 2019. They reported a median charge-to-payment ratio of 2.05.3
Disclosing the price of the medical services, especially the out-of-pocket expenses, to patients before providing the services is essential. However, sometimes providers are concerned that providing pricing information might focus on the price rather than the quality of service provided.4 In addition, providers are usually unaware of or incorrectly estimate the price of services that they order.5,6
Limited literature currently exists regarding charge-to-payment ratios for ophthalmic services and differences across socio-regional variables. We used physician payment data from the Centers for Medicare & Medicaid Services (CMS) Public Use Files to study the National trends in excess charges for ophthalmic services.
Materials and Methods
We performed a cross-sectional study utilizing data from 100% final-action physician/supplier Part B Medicare fee-for-service (FFS) population from 2015 to 2020. We extracted information on ophthalmic procedures and consultations, both facility and non-facility, performed by≥ 50 ophthalmologists. Trends in charge-to-payment ratios were performed utilizing two datasets: (1) Physician and Other Practitioners Dataset – by Provider and (2) Physician and Other Practitioners Dataset – by Provider and Service.7 Services were identified through Current Procedural Terminology (CPT)-10 and Healthcare Common Procedure Coding System (HCPCS) codes. Ophthalmic services included outpatient or inpatient office visions as well as diagnostic imaging/testing. Ophthalmic services included cataract, glaucoma, and retinal surgeries, intravitreal injections, laser procedures, oculoplastic procedures, and corneal/ocular surface procedures. Consultations included outpatient or inpatient visits and diagnostic imaging/testing. Services that did not involve procedures were categorized based on ophthalmologist billed codes 99,201–99,499, 92,002, 92,004, 92,012, and 92,014, with, procedural services encompassing all other codes not included in these ranges. We also extracted information pertaining to physicians’ sex and geographical region of practice as well as submitted charges and allowed payments. We calculated the median submitted charges/allowed payments for ophthalmic services and evaluated trends over time. We analyzed the variation in excess charges by ophthalmologist’s gender, state, and region of practice for the year 2020.
The study did not meet the human subjects’ research criteria and the Institutional Review Board (IRB) approval was waived by the University of Arkansas for Medical Sciences as this was an analysis of an existing public anonymized database. Where relevant, we followed the Strengthening the Reporting of Observational Studies in Epidemiology (STROBE) reporting.8
Results
We identified 17,631 ophthalmologists in 2020. Table 1 summarizes the variation in Medicare charge-to-payment ratios for ophthalmology services in 2020 across different subpopulations. The median charge-to-payment ratio was highest among ophthalmologists in the Midwest (2.47, interquartile range (IQR): 1.89–3.32) and was lowest in the Northeast (2.26, IQR: 1.71–2.96) (Figure 1). The state median ratio ranged from 1.3 for South Dakota to 4.4 for Wisconsin. Ratios were slightly higher for ophthalmologists practicing in metropolitan areas (2.32, IQR: 1.79–3.05) compared to non-metropolitan areas (2.22, IQR: 1.71–2.88). The median charge-to-payment ratio was slightly higher among female ophthalmologists (2.44, IQR: 1.87–3.18) compared to male ophthalmologists (2.28, IQR: 1.76–2.99). Table 2 shows the trends in charge-to-payment ratios over time for ophthalmic services. The median charge-to-payment ratio for all CPT codes in 2020 was 2.23 (IQR: 1.54–3.27) as compared to 2.00 (IQR: 1.39–2.92) in 2015, an overall 2.76% average annual increase (AAGR) from 2015–2020. The charge-to-payments ratios were higher for procedures compared with consultations. For ophthalmic procedures, the median charge-to-payment ratio in 2020 was 3.03 (IQR: 2.13–4.41) compared to 2.79 (IQR: 1.96–3.97) in 2015, corresponding to a 2.01% AAGR from 2015–2020. For ophthalmic consultations, the median charge-to-payment ratio in 2020 was 2.06 (IQR: 1.48–2.96), compared to 1.85 (IQR: 1.33–2.59) in 2015, corresponding to a 2.71% AAGR from 2015–2020.
 |
Table 1 Variation in Medicare Charge-to-Payment Ratios for Ophthalmology Subgroups in 2020 (by Providera, N=17,631) |
 |
Table 2 Median Charge-to-Medicare Payment Ratio by Ophthalmic Services, 2015–2020 (by Servicea, N=1,403,595) |
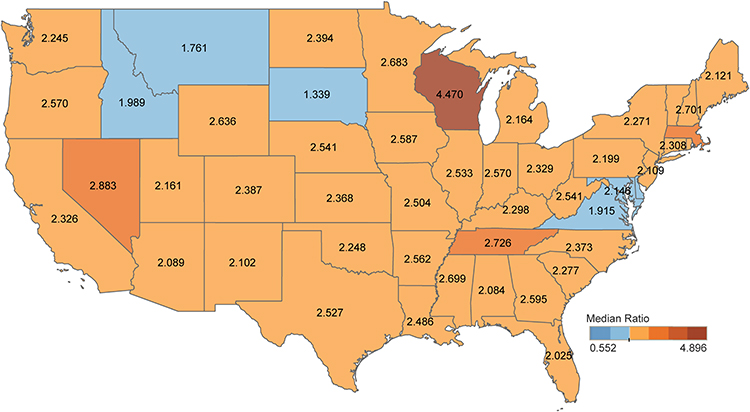 |
Figure 1 Map showing median charge-to-payment ratio differences by state. The darker the Orange/red the state is colored, the greater the median charge-to-payment ratio. |
Discussion
We found the median charge-to-payment ratio for all ophthalmology services in 2020 was 2.23, which was lower compared to the median of all medical specialties, 2.5, but higher than dermatology, 2.05.1,3 Low excess charges in ophthalmology could be attributed to the high volume of minor procedures compared to other surgical specialties that are performed as an outpatient, allowing cost containment. The ratio varied across states, with Wisconsin having the highest median ratio (4.4). Similarly, Bai and Anderson evaluated the median charge-to-payment ratio across 54 medical specialties and reported Wisconsin to have the highest median ratio (3.8).1
Overall, minimal variation in charge-to-payment ratios was found among different ophthalmologist subgroups, including practice region and rurality. We found a slightly higher charge-to-payment ratio among female ophthalmologists compared to their male counterparts. A recent study found a lower annual Medicare reimbursement for female ophthalmologists compared to male ophthalmologists. The authors reported that female ophthalmologists billed for a lower number of annual services and received $20,209 less in annual reimbursements compared to male ophthalmologists.9 Regarding the change in excess charges over the years, we observed a steady increase for ophthalmic services from 2015, 2.0 to 2020, 2.23, corresponding to an AAGR of 2.76% for all CPT codes. This may suggest that inflation-adjusted Medicare payments were not enough to offset the increase in physicians’ charges resulting in decreased reimbursement, which seemed to have a more significant impact on consultations (2.71% AAGR) compared to procedures (2.01% AAGR). It has been shown that, after adjusting for medical care and practice expense inflation, Medicare physician payment has significantly decreased by about 26% from 2001 to 2023.10
Those disparities surrounding healthcare costs are challenging and may lead to excess charges that may fall on patients who are uninsured or who have out-of-network commercial insurance. Usually, providers charge more than the actual service cost, with the knowledge that the paid price will be typically lower because health plans negotiate significant discounts.11 Those discounts, especially with Medicaid, may be so significant that insurers pay less than the actual service cost. Subsequently, many physicians prefer self-pay patients or small private insurers since they have less negotiating clouts.11
Another challenge in delivering health care services is price transparency, which refers to disclosing the price of medical services before making medical decisions. It has been shown that >60% of United States citizens are interested in knowing the health service price information, especially the expected out-of-pocket expenses.12,13 Although routine patient-provider conversations about out-of-pocket costs are recommended, patients report such communications in less than 20% of encounters.12,13 In an attempt to improve healthcare price transparency, many states have passed laws mandating hospitals, providers, and insurers to disclose prices before providing care.14
In 2019, the CMS provided hospitals with specific guidelines to create chargemaster data that is publicly available and has the costs for medical services. Those chargemaster lists were limited by having inflated prices for negotiation with insurers and providing minimal information for patients regarding the out-of-pocket expenses.15–17 Subsequently, legislations have been modified, effective in 2021, aiming to reduce the ambiguity of healthcare charges which may result in financial burden and stress, especially for vulnerable uninsured patients. However, one study by Berkowitz and colleagues evaluated the variability of the reported prices for ophthalmic procedures, mainly cataract extraction (CPT codes 66,984 and 66,821) at 247 academic hospitals. They reported that despite the recent price transparency legislature, there was significant variability in some of the current standard charges between hospitals. That variation could not be explained by geographic variability in costs.18
The current study has limitations including the retrospective analysis. Another limitation is that subgroup differences among ophthalmologists may have been affected by unexplored confounders. Also, we did not analyze the excess charges of commercial insurance.
In conclusion, our study highlights a relatively low rate of excess charges for ophthalmology services compared to other specialties with minimal variation among providers. We found that charge-to-payment ratios have increased since 2015. Because excess charges may financially affect uninsured or out-of-network patients, this information could be important for healthcare policymakers.
Funding
There is no funding to report.
Disclosure
The authors report no conflicts of interest in this work.
References
1. Bai G, Anderson GF. Variation in the ratio of physician charges to medicare payments by specialty and region. JAMA. 2017;317(3):315–318. doi:10.1001/jama.2016.16230
2. Kyanko KA, Pong DD, Bahan K, et al. Patient experiences with involuntary out-of-network charges. Health Serv Res. 2013;48(5):1704–1718. doi:10.1111/1475-6773.12071
3. Gronbeck C, Feng H. Variation in ratios of submitted charges to allowed medicare payment for dermatologic services. JAMA Dermatol. 2022;158(8):958–960. doi:10.1001/jamadermatol.2022.2214
4. Kaplan JL, Mills PH. Price Transparency in the Online Age. Ann Plastic Surg. 2016;76(Supplement 3):S246–S248. doi:10.1097/SAP.0000000000000780
5. Allan GM, Lexchin J. Physician awareness of diagnostic and nondrug therapeutic costs: a systematic review. Int J Technol Assess Health Care. 2008;24(02):158–165. doi:10.1017/s0266462308080227
6. Vijayasarathi A, Duszak R, Gelbard RB, et al. Knowledge of the costs of diagnostic imaging: a survey of physician trainees at a large academic medical center. J Am Coll Radiol. 2016;13(11):1304–1310. doi:10.1016/j.jacr.2016.05.009
7. Centers for Medicare & Medicaid Services. Medicare physician & other practitioners—by provider and service. Available from: https://data.cms.gov/provider-summary-by-type-of-service/medicare-physician-other-practitioners/medicare-physician-other-practitioners-by-provider-and-service.
8. von Elm E, Altman DG, Egger M, et al. The Strengthening the Reporting of Observational Studies in Epidemiology (STROBE) statement: guidelines for reporting observational studies. Lancet. 2007;370(9596):1453–1457. doi:10.1016/s0140-6736(07)61602-x
9. Halawa OA, Sekimitsu S, Boland MV, et al. Sex-Based Differences in Medicare Reimbursements among Ophthalmologists Persist across Time. Ophthalmology. 2022;129(9):1056–1063. doi:10.1016/j.ophtha.2022.05.006
10. Inflation. AMAMppinkuw and. Available from: https://www.ama-assn.org/system/files/medicare-updates-inflation-chart.pdf.
11. Finkler SA. The distinction between cost and charges. Ann Intern Med. 1982;96(1):102–109. doi:10.7326/0003-4819-96-1-102
12. Alexander GC, Casalino LP, Meltzer DO. Patient-physician communication about out-of-pocket costs. JAMA. 2003;290(7):953–958. doi:10.1001/jama.290.7.953
13. Irwin B, Kimmick G, Altomare I, et al. Patient experience and attitudes toward addressing the cost of breast cancer care. Oncologist. 2014;19(11):1135–1140. doi:10.1634/theoncologist.2014-0117
14. Sinaiko AD, Chien AT, Rosenthal MB. The role of states in improving price transparency in health care. JAMA Intern Med. 2015;175(6):886–887. doi:10.1001/jamainternmed.2015.0628
15. Bai G, Anderson GF. US hospitals are still using chargemaster markups to maximize revenues. Health Aff. 2016;35(9):1658–1664. doi:10.1377/hlthaff.2016.0093
16. Lu AJ, Chen EM, Vutam E, et al. Price transparency implementation: accessibility of hospital chargemasters and variation in hospital pricing after CMS mandate. Healthc. 2020;8(3):100443. doi:10.1016/j.hjdsi.2020.100443
17. Glover M, Whorms D, Singh R, et al. A radiology-focused analysis of transparency and usability of top U.S. Hospitals’ Chargemasters. Acad Radiol. 2020;27(11):1603–1607. doi:10.1016/j.acra.2019.11.021
18. Berkowitz ST, Siktberg J, Hamdan SA, et al. Health care price transparency in ophthalmology. JAMA Ophthalmol. 2021;139(11):1210–1216. doi:10.1001/jamaophthalmol.2021.3951
 © 2024 The Author(s). This work is published and licensed by Dove Medical Press Limited. The full terms of this license are available at https://www.dovepress.com/terms.php and incorporate the Creative Commons Attribution - Non Commercial (unported, v3.0) License.
By accessing the work you hereby accept the Terms. Non-commercial uses of the work are permitted without any further permission from Dove Medical Press Limited, provided the work is properly attributed. For permission for commercial use of this work, please see paragraphs 4.2 and 5 of our Terms.
© 2024 The Author(s). This work is published and licensed by Dove Medical Press Limited. The full terms of this license are available at https://www.dovepress.com/terms.php and incorporate the Creative Commons Attribution - Non Commercial (unported, v3.0) License.
By accessing the work you hereby accept the Terms. Non-commercial uses of the work are permitted without any further permission from Dove Medical Press Limited, provided the work is properly attributed. For permission for commercial use of this work, please see paragraphs 4.2 and 5 of our Terms.