")
Back to Journals » Journal of Healthcare Leadership » Volume 16
The Effect of Transformational, Transactional, and Laissez-Faire Leadership Styles on Employees’ Level of Performance: The Case of Hospital in Oromia Region, Ethiopia
Authors Hundie ZA , Habtewold EM
Received 13 December 2023
Accepted for publication 13 February 2024
Published 16 February 2024 Volume 2024:16 Pages 67—82
DOI https://doi.org/10.2147/JHL.S450077
Checked for plagiarism Yes
Review by Single anonymous peer review
Peer reviewer comments 2
Editor who approved publication: Dr Pavani Rangachari
Zeleke Amena Hundie, Ephrem Mannekulih Habtewold
Deparment of Public Health, Adama Hospital Medical College, Adama, Ethiopia
Correspondence: Zeleke Amena Hundie, Tel +251911617412, Email [email protected]
Purpose: Poor performance of health service providers has a negative impact on the ability of health systems to produce desired outcomes. Lack of suitable and impactful leadership hinders employee performance in terms of providing a high standard of care. There is a paucity of evidence on the effect of leadership style on employee performance in the current study setting. Hence, this study sought to assess the effect of leadership styles on employee performance in hospitals in the Oromia region, Ethiopia, from August 1 to October, 30, 2021.
Methods: A cross-sectional study was conducted using a sample of 41 hospitals and 412 employees, selected by stratified sampling from hospitals in the Oromia region. The data were collected using self-administered questionnaires. They were then coded and entered into the Epi-Info-7.2. software, and exported to SPSS-20 for analysis. The participants’ characteristics were analyzed and summarized using descriptive statistics. Employee performance was rated as low, average or high, and estimated by proportion along with a 95% confidence interval (CI). The association between leadership styles and the level of employee performance was modelled using ordinal logistic regression. The magnitude of association was estimated by odds ratio with a 95% CI. Statistical significance was set at p < 0.05.
Results: Employees had an increased odds of being a high performer when they experienced the following leadership styles: transformational with idealized influence (AOR=1.70; 95% CI: 1.12, 2.64), intellectual stimulation (AOR=1.60; 95% CI: 1.04, 2.48), laissez-faire approach (AOR=2.49; 95% CI: 1.71,3.62), effectiveness in terms of frequently fulfilling employees’ job-related needs (AOR=2.09; 95% CI: 1.20,3.63), and the exertion of extra effort in motivating them (AOR=2.11; 95% CI: 1.22, 3.68).
Conclusion: Among leadership styles, transformational with idealized influence and intellectual stimulation, laissez-faire approaches were significantly associated with employee performance. However, transactional leadership was not significantly associated with employee performance.
Keywords: employee performance, Ethiopia, hospital, Oromia, leadership styles
Introduction
Leadership is a formidable task that influences a group of people and contexts in order to achieve common goals. It is much more than the personal traits or qualities of someone in a leadership position, since leadership is a complex phenomenon in which the leader, followers, and context each contribute and play a role.1 In the process of leadership, the primary role of leaders is to create a compelling vision and influence the context; some people will accept them as their leaders who will translate the vision into reality.2,3 As such, leadership has significant and effects on the achievement of organizational goals and plans.3–5
Leadership style is a relatively consistent pattern of behaviors, attitudes, and traits exhibited by a leader in the processes of decision-making, directing, and influencing followers to perform efficiently and effectively.6–8 Leadership styles have evolved from ancient predecessors, and several aspects of its foundations have changed. In the modern era, there are several philosophies, theories, and models of leadership style.3,9–12 From among the current predominant leadership styles, this study focused on transformational, transactional, and laissez-faire leadership styles and their effects on job performance among healthcare service providers working in the hospital environment.7,10,11
Transformational leaders primarily focus on employees’ value systems and needs. A person with a transformational leadership style focuses mainly on transforming the value system, inspirations, aspirations, and expectations of employees. Transformational leaders articulate and communicate their vision clearly and appealingly to followers, and inspire such followers’ willingness to share and own their vision. Transformational leaders tend to alter and shape employee behavior to make it congruent with the organizational value system. Furthermore, a transformational leader upholds employees’ interests and, in doing so, makes them stand for organizational goals beyond their personal interests. Several studies have revealed that transformational leadership style significantly influences employees’ levels of satisfaction and work performance.13–15
The transformational leadership style has four behavioral elements: idealized influence, inspirational motivation, intellectual stimulation, and individualized consideration. Transformational leaders with an idealized influence behavior style follow essential sets of values and convictions, and are willing to take risks. Leaders demonstrating such behavior set a role model for strong work ethics, instill pride, and gain respect and trust from their followers.16,17 Transformational leaders who behave with individualized consideration pay personal attention to followers based on their need for growth and try to listen to followers’ concerns and needs, mentoring them, and recognizing each person’s unique contributions. The leader provides empathy and support, keeps communication open, and places challenges before followers.13,18
Transformational leaders who demonstrate an inspirational motivation style articulate a vision that appeals to and inspires their followers. Leaders using inspirational motivation challenge followers with high standards, communicate optimism regarding future goals, and provide meaning to the tasks at hand. Leaders with vision are supported by communication skills that make vision understandable, precise, powerful, and engaging. Followers are willing to invest more effort in their tasks, are encouraged and optimistic about the future, and believe in their abilities. Leaders with an intellectual stimulation style help their employees to be creative and innovative in trying new approaches, challenge their own beliefs and values, encourage them to try new approaches, and emphasize rationality. They nurture and develop people who think independently. For such leaders, learning is a value and unexpected situations are seen as opportunities to learn. Followers ask questions, think deeply about things, and determine better ways to execute tasks.7,13,19
The transactional leadership style involves leaders relying on reward and punishment to achieve optimal job performance from their subordinates. Transactional leaders compensate followers for meeting specific goals or performance criteria. The transactional leader follows the give-and-take approach, which means that he/she first validates the relationship between performance and reward and then exchanges it for an appropriate response that encourages subordinates to improve performance.10
The laissez-faire leadership style follows the principle of minimal supervision. It may be defined as a leader who has little self-reliance in his leadership ability, sets no goals for the group, and minimizes group interactions. This approach is useful when group members are able to be “self-independent” and the leader requires very little to look good because most decisions are under the control of their followers. This style is highly likely to be effective in organizations such as research centers, where a great number of intellectuals are independently doing their job in the absence of monitoring.20
Leadership/governance is one of the six building blocks of the health system framework developed by the World Health Organization (WHO). Leadership is a primary concern in the assessment of health system performance, is instrumental in strengthening the overall health system, and is used as a catalyst for achieving global health targets, including sustainable development goals (SGD).21 A study conducted to assess the performance of the health system in public hospitals in central Ethiopia found that, overall, it was rated at 60%, that is, far below the minimum performance level of 80% set by WHO. The study showed that the performance related to leadership was 61%. Among performance indicators of leadership effectiveness, the lowest performance was observed in employee working hours, rated at only 58%.22
The goals of the health system can only be met by improving and transforming leadership effectiveness, exerting extra effort, and improving employee satisfaction.21 Many studies have been conducted to understand and identify factors that influence job performance in healthcare settings. Several studies have revealed that the success or failure of an organization depends on its leadership style. Specifically, in the most populated African countries like Ethiopia, with a population growth rate of 2.7% and no effective leadership, the high employee performance is unlikely.23 However, the findings regarding the nature of the association between different leadership styles and level of employees’ performance at work are controversial. The disagreements seen in related research findings could be partially attributed to significant variations in workplace cultures, the health system, and methods used to operationalize employees’ performance among studies utilizing multifactorial leadership surveys questionnaires.
The majority of these studies were restricted to the environment of a single healthcare facility, making it impossible to extrapolate the findings from them because working cultures and the health system vary widely among contexts. This means that the findings might only offer a succinct overview of one setting, which makes it irrational to use them as baseline for designing regional and national level health system reform initiatives. As a result, it makes sense to do research that covers a variety of environments since it might act as a foundation for developing reform plans for the leadership of the health system. As such the current study was carried out taking half of the hospital (41) that have been providing health care services across the region.
In addition, when evaluating the impact of transformational, transactional, and Laissez-faire leadership styles on employees’ performance at work, the majority of studies employing multifactorial leadership questionnaires operationalize employees’ performance into binary values instead of assigning them to their original ordinal scales. The assessment instruments to gauge the performance level of the employees use an ordinal 5-point Likert scale, with values ranging from extremely low to extremely high. The underlying disparities derived from the variables’ original natures may be hidden by altering the variables’ original ordinal scale, treating them as dichotomous response variables, and fitting them into a binary logistic regression model to determine the factors impacting the degree of employees’ job performance. Taking these into consideration, the current study attempted to maintain the original scale of response variable and used ordinal logistic regression model to determine the factors impacting the degree of employees’ job performance. As such, the findings of this research serve as baseline evidence for regional and national health policymakers and strategy designers planning to improve health system performance.
Methods
Study Aims and Period
Primarily, the current study aimed to assess the relationship between leadership style and level of employee performance in hospitals in the Oromia Regional State, Ethiopia, between August 1 and October 30, 2021.
Study Settings
The study was conducted taking a random sample of hospitals in the Oromia region. The Oromia region is the largest and most populous in Ethiopia. The region is bordered to the east by the Somali region, to the north by the Amhara, Afar, and Benishangul Gumuz regions, to the northeast by Dire Dawa, to the west by the South Sudan and Gambela regions, to the south by southern nationalities and people’s regions, the Sidama region, and Kenya’s eastern province. The region is divided into 310 districts. There are 82 functional hospitals and 1383 health centers in the region. Among the 82 hospitals, four are specialized referral hospitals, 33 are general hospitals, and 45 are primary hospitals. A total of 19,418 health professionals provided services during the study period in the 82 hospitals.
Study Design
A cross-sectional study was carried out using a random sample of employees, managers and supervisors, selected from a sample of hospitals in Ethiopia’s Oromia region.
Population
Source population
In the current study, all employees, supervisors, and managers working in government hospitals in the Oromia region were considered as the source population.
Study Population
Employees, supervisors, and managers working in randomly selected hospitals were considered as the study population.
Inclusion Criteria
Employees working in the selected hospitals and their supervisors and managers including chief executive officers, provosts, vice-provosts, directors, and department heads were included in this study.
Exclusion Criteria
Employees with less than a year of experience were excluded from the study due to their lack of enough experience about the workplace leadership dynamics and organizational working culture.
Sample Size Determination
Sample size was calculated independently for each specific objective sought in the current study. Subsequently, by comparing the sample sizes calculated to address each specific objective, the largest sample that enabled researchers to address all study objectives with the desired level of confidence and precision was selected. Therefore, the largest sample size was calculated for a single population proportion. The following statistical assumptions were made when calculating the sample:
- The cross-sectional study design employed to address the study objective
- The estimated proportion of high level employee performance (P) = 50% with the aim of incorporating the maximum sample size
- A desired level of confidence to determine the level of employee performance of 95% and a corresponding standardized value (Z) of 1.96
- The desired level of precision or margin of error, that is, the proportion of high performance level to be estimated by (d) = 5%
The required sample was determined by inserting the above parameters into the following formula:
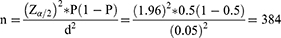
Finally, adding an estimated 10% non-response rate, it was planned to select a total of 423 employees from hospitals in Oromia region.
Sampling Techniques and Procedures
The hospital list and employee profiles were obtained from the Oromia Health Bureau’s electronic database. The Oromia Health Bureau is the government administrative entity that the hospitals are under. There were 82 hospitals in operation at the time the data were collected. These hospitals were first divided into three strata based on the variety of services they provide: primary, general, and specialized referral hospitals. Among the 82 hospitals, four were specialized referral hospitals, 33 were general hospitals, and 45 were primary hospitals. Then, using Excel spreadsheets created by computers, half (41) of them were independently chosen by simple random sampling from each stratum. Among the selected hospitals, 23 were primary hospitals, 16 were general hospitals, and two were specialized referral hospitals. Overall, N = 19,418 employees were providing services in these hospitals. Considering the number of employees working in each selected hospital, sample sizes were allocated proportionally to the total number of employees working in each hospital. An independent sampling frame was prepared using hospitals’ human resource profiles to select the sample of employees allocated to each hospital. Participants were then selected using simple random sampling techniques assisted by Microsoft Office Excel spreadsheets.
Study Variables
Dependent variable: Employee performance
Independent Variables:
- Sociodemographic variables: age, sex, educational qualifications, years of service, marital status, and current job level
- Variables related to employee perception of transformational leadership style: idealized influence, inspirational motivation, intellectual stimulation, and individual consideration
- Variables related to employee perception of transactional leadership style: contingent reward, active management by exception, and passive management by exception
- Variables related to employee perception of laissez-faire leadership style: laissez-faire
- Variables related to supervisors’ and managers’ responses concerning their leadership approach: effectiveness, extra effort, satisfaction
Operational Definition
Performance level: Employee performance was measured and defined using two important job performance elements. The first element rated both the productivity and quality of employees’ performance using a 5-point Likert scale ranging from 1 (very low) to 5 (very high). The second performance element was measured by rating the productivity and quality of employees’ performance relative to their peers working in similar jobs. The scales were labelled and coded as follows: 1. very low; 2. low; 3. average; 4. high; and 5. very high. The performance scores of the four elements for each employee were added together to create an overall score. Based on overall scores, employee performance level was operationally defined into three scaled ordinal variables using the measure of relative standing. First, the overall scores were arranged in ascending order and their relative standing was calculated using percentiles. Accordingly, employees whose overall performance scores were above the 75th percentile were grouped together and rated as “high”, those between the 25th and 75th percentiles as “average”, and those below the 25th percentiles as “low”.
Favored and unfavored leadership styles: Leadership styles were assessed on the basis of employees’ perceptions; hence, their perceptions of the three types of leadership style were measured and defined using indicators under each style. Accordingly, the behavioral elements of transformational and transactional leadership styles were assessed using three indicators for each behavioral element, measured using a 5-point Likert scale ranging from 1 (strongly disagree) to 5 (strongly agree). Similarly, laissez-faire leadership style was measured and defined using six indicators on a 5-point Likert scale, ranging from 1 (strongly disagree) to 5 (strongly agree). The scales were labelled and coded as follows: 1. strongly disagree, 2. disagree, 3. neutral, 4. Agree, and 5. strongly agree. The responses for each behavioral element were then added independently to create an overall score. Based on the overall scores, employee perceptions were operationally divided into two categories using the median score. First, the overall scores were arranged in ascending order and their median values were determined. Accordingly, employees whose overall perception scores were below the median value were grouped together and rated as “unfavored” and those above the median value were grouped together and rated as “favored”.
Frequent and infrequent leadership styles: Leadership styles were also assessed based on leaders’ self-assessment, which was measured with indicators under each behavioral element of the three leadership styles. Accordingly, the behavioral elements of transformational and transactional leadership styles were assessed using four indicators for each behavioral element, measured using a 5-point Likert scale ranging from 1 (rarely) to 5 (always). Similarly, laissez-faire leadership style was measured and defined using four indicators on a 5-point Likert scale ranging from 1 (rarely) to 5 (always). Furthermore, four indicators were used to measure leaders’ effectiveness, three indicators were used to measure leaders’ extra efforts, and two indicators were used to measure leaders’ methods of satisfying employees under their supervision. The scales were labelled and coded as follows: 1. rarely, 2. sometimes, 3. often, 4. very often, and 5. always. The responses for each element were then added independently to create an overall score. Based on the overall scores, leaders’ self-assessment results were operationally divided into two categories using the median score. First, the overall scores were arranged in ascending order and their median values were determined. Second, leaders whose overall scores were below the median value were grouped together and rated as “frequent” and those above the median value were grouped together and rated as “infrequent”.
Data Collection Tools and Procedures
Data were collected from participants, their immediate supervisors and leaders randomly selected from a sample of 41 hospitals, using a self-administered questionnaire. The questionnaires were organized into four sections: demographic information; different leadership styles (transformational, transactional, and laissez-faire); self-assessment indices of leaders; and employee performance. The questionnaires were adapted from a review of different sources. The measurement scales used to measure different leadership styles were adapted from the multi-factor leadership questionnaire developed by Avolio and Bass (1995). This section contained a list of 24 questions measured on a five-point Likert scale, ranging from 1 (strongly disagree) to 5 (strongly agree). Five subscales were used to measure transformational leadership, two to measure transactional leadership, and three to measure laissez-faire leadership.
Hospital leaders were asked to self-assess their approach to employees under their supervision by responding to 45 questions. The variables were measured using a five-point Likert scale ranging from 1 (rarely) to 5 (always).
The response variable (employee performance) was measured using the scale recommended by Yousef (2000). As per the recommendation, employee performance was studied through dimensions such as “quality of performance” and “productivity” using four items measured on a five-point Likert scale. In this study, employee performance was defined using two important elements: “high productivity” and “high quality”. All measures used a 5-point Likert scale, ranging from 1 (very low) to 5 (very high). The questionnaire also included demographic variables of the employees.
Data Quality Assurance Measures
The reliability of the tools used to gather data was assessed. Accordingly, the reliability of all items and each leadership factor scale was reported to be between 0.74 and 0.94. The Cronbach’s alpha test was found to be 0.952 for questions measuring employees’ perception of leadership styles, 0.84 for questions on employee performance rate, and 0.95 for questions on leaders’ self-assessment.24,25 Before embarking on the main data collection activities, a pilot study was conducted using 5% of the questionnaire to evaluate its validity and practicability.
Data Processing and Analysis
The collected data were checked, entered into the Epi-Info version 7.2 software, and exported to SPSS version 20 for processing and analysis. Data-processing tasks, such as cleaning, computing, transforming, coding, recoding, and grouping of variables, were performed before the analysis. The characteristics of the participating employees across all variables were analyzed and summarized using descriptive statistics. Accordingly, frequency distributions were computed for categorical variables, and appropriate numerical summary measures (measures of central tendency and dispersion) were used to summarize the continuous variables after testing for the normality of data using the Shapiro–Wilk test. Employees’ job performance level was estimated based on proportion and a 95% confidence interval (CI).
Considering the polychotomous categories of outcome variables measured on an ordinal scale, ordinal logistic regression was used to model the association between employee performance level and associated factors. First, we assessed the regression assumptions required for the ordinal logistic regression model. Accordingly, based on the cross-tabulated analysis of the dependent and independent variables, no cells contained zero counts or small expected frequencies. The assumption of a parallel line between ordered categories was also tested, and the test results showed that the proportionality assumption of the model was fulfilled, with a p-value of 0.782. Then, a univariate regression analysis was performed to assess the crude association between employee performance level and each independent variable. At this level, the independent variables that showed a crude association with employee performance level (P-value <0.25) were selected as candidate variables for multivariable regression analysis, in which the associations were adjusted for potential confounding effects. All candidate variables were then subjected to multivariable regression analysis to identify factors significantly associated with employee performance level after adjusting for possible confounding variables in the final fitted regression model. The final model was developed using a standard model-building approach. In this approach, all candidate variables were simultaneously subjected to a multivariable regression model and, one by one, the worst variable with a large p-value was sequentially excluded until only a set of significant variables with a P-value of <0.05 remained.
Before determining the observed associations between the dependent and independent variables, the fitness of the model was evaluated using diagnostics. First, the presence of outliers in the fitted model was assessed using a case-wise plot and no outliers were found. Pearson’s chi-squared test was performed to evaluate the goodness of fit of the model by comparing disparities between observed and predicted values. The diagnostic results revealed that the model fit the data adequately, and there was no significant difference between observed and expected values (p = 0.248). To evaluate the proportion of variation in the dependent variable explained by the collective effects of independent variables, Nagelkerke R-square was computed, and the results showed that 11.3% of variation in employees’ performance level is explained by the collective effects of variable in the fitted model. Variance inflation factors (VIF) were used to assess multicollinearity among covariates in the fitted model. The results of the diagnosis showed that none of the covariates had a VIF value above five, which indicates the absence of collinearity among covariates. The final fitted model used strength of association, estimated using an adjusted odds ratio with a 95% confidence interval and a P-value of <0.05, as a cutoff point to identify statistical significance.
Results
Socio-Demographic Characteristics of Study Participants
Among study participants, 302 (73.7%) were male, 184 (44.5%) were in the 20–29 years age group, 235 (56.8%) were married, and, of employees, 300 (73.7%) were educated to Bachelor degree level. Regarding their employment profile, 242 (59.3%) had 1–5 years’ service experience, and 221 (53.8%) currently worked as health service providers (Table 1).
 |
Table 1 Socio-Demographic Characteristics of Employees Working in Selected Hospitals of Oromia Region, Ethiopia, August 1 to October 30, 2021 |
Employees’ Perceptions About Their Immediate Supervisor’s Leadership Approaches
Employees’ perceptions about their immediate supervisors’ approaches on the basis of three leadership styles (transformational, transactional, and laissez-faire) were assessed. Of these employees, 168 (46.8%) favored transformational leadership, 181 (45.6%) transactional leadership, and 196 (49.6%) laissez faire leadership. Regarding the four elements of the transformational leadership style, 179 (45.4%) employees favored the idealized influence of their immediate supervisors, 190 (47.5%) favored supervisor inspirational motivation, 187 (47.3%) favored intellectual stimulation, and 210 (53.2%) favored individual considerations. Regarding elements of the transactional leadership style, the study revealed that, among employees, 211 (51.8%) favored supervisors’ contingent rewards, and 192 (47.8%) favored supervisor management by exception (Table 2).
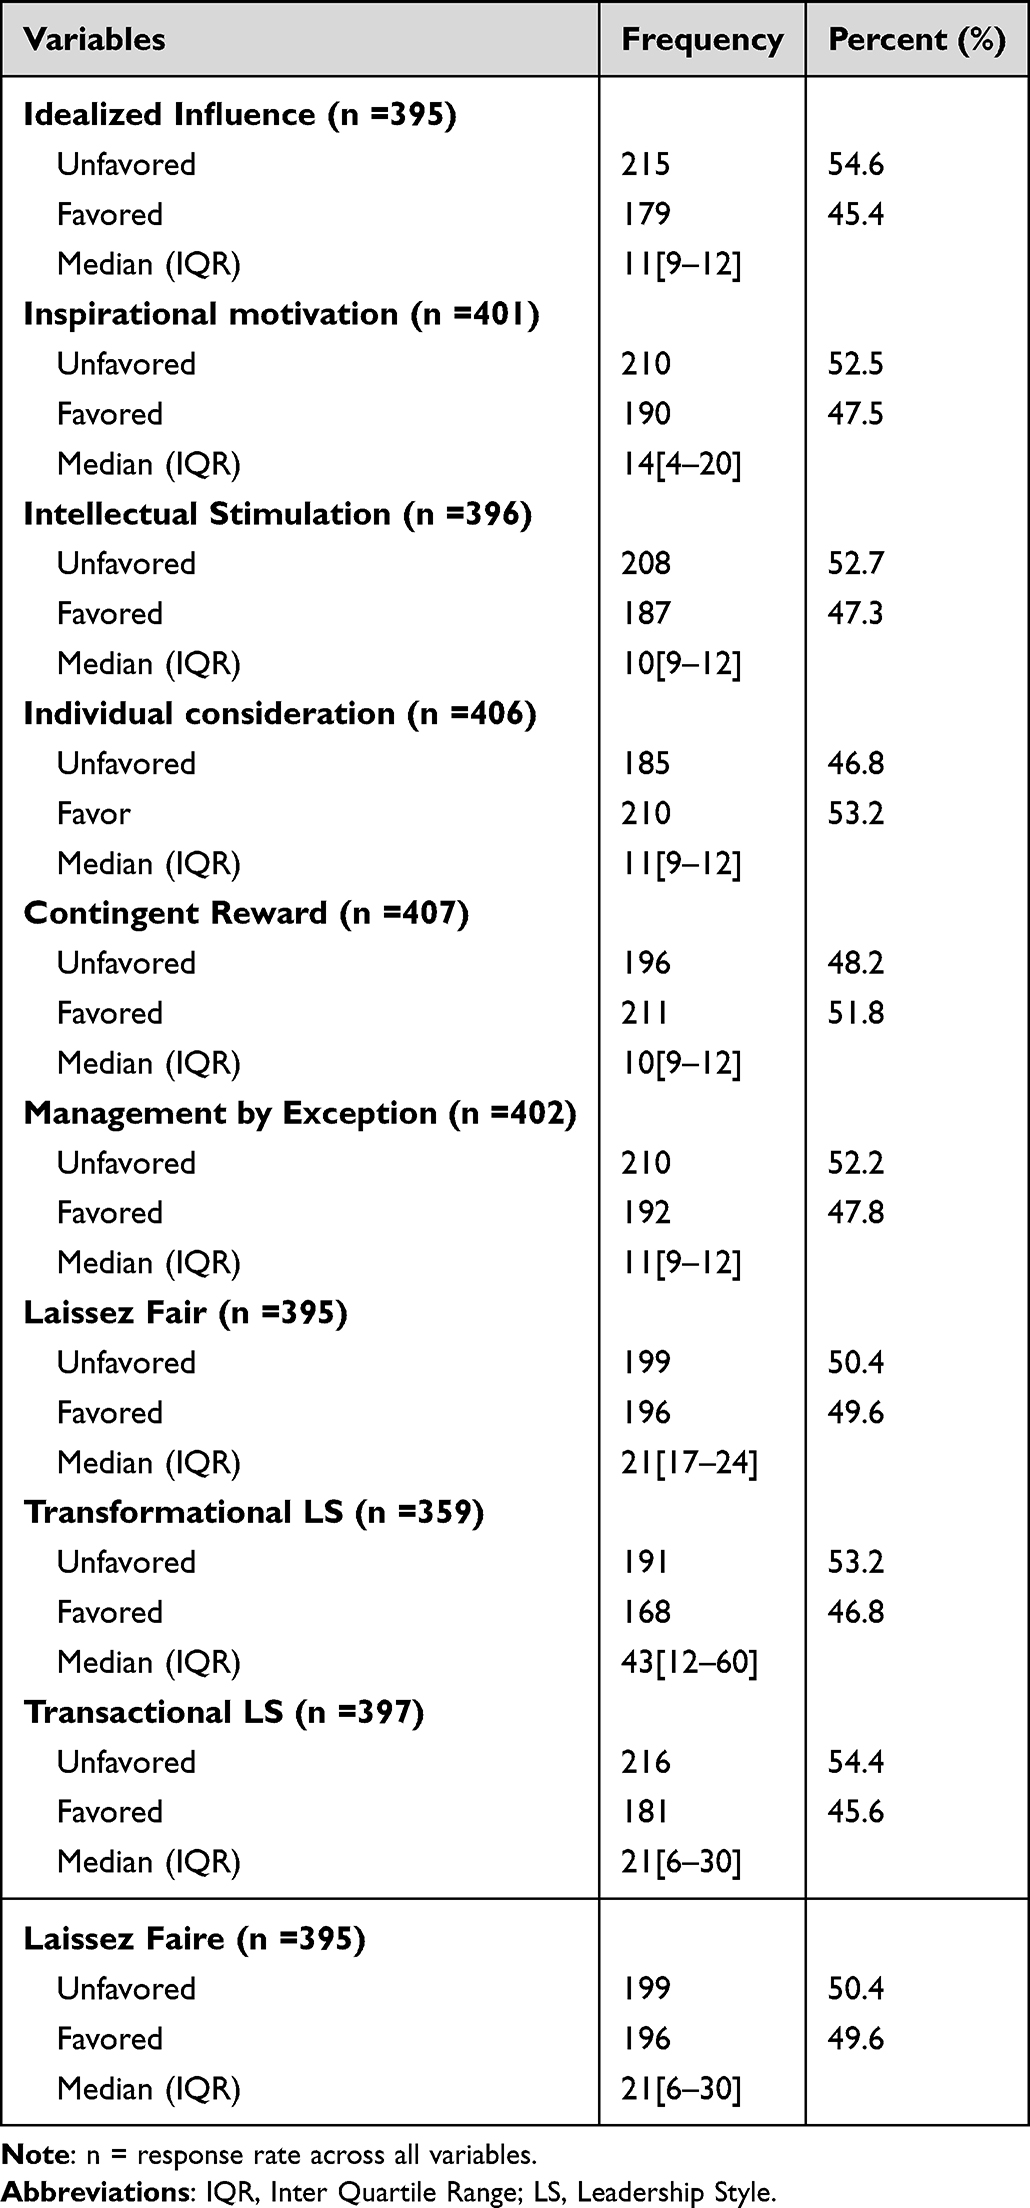 |
Table 2 Summary of Employees’ Perceptions About Their Immediate Supervisors’ Leadership Approaches, in Selected Hospitals of Oromia Region, Ethiopia, August 1 to October 30, 2021 |
Leaders’ Evaluations of Their Own Leadership Approaches Toward Employees
Leaders’ evaluation of their own leadership style in toward employees under their supervision were rated based on the different components of the transformational, transactional, and laissez-faire approaches. Regarding elements of the transformational leadership style, the study revealed that 147 leaders (48.5%) frequently exhibited attributes of an idealized influence on employees under their supervision. Among leaders, 135 (44.7%) frequently demonstrated idealized influence behaviors in their approach to employees. Among other components of the transformational leadership style, inspirational motivation was practiced frequently by 142 leaders (46.7%), intellectual stimulation by 154 leaders (50%), and individual considerations by 169 leaders (55.4%).
With regard to elements of the transactional leadership style, among leaders, 167 (55.1%) frequently practiced elements of contingent rewards, 151 (50.8%) passive management by exception, and 162 (53.8%) active management by exception. The study also revealed that elements of the laissez fair leadership styles were frequently practiced by 145 leaders (48.2%). Furthermore, among employees, 155 (50.3%) frequently exhibited elements of effectiveness, 163 (52.6%) extra effort, and 141 (45%) job satisfaction (Table 3).
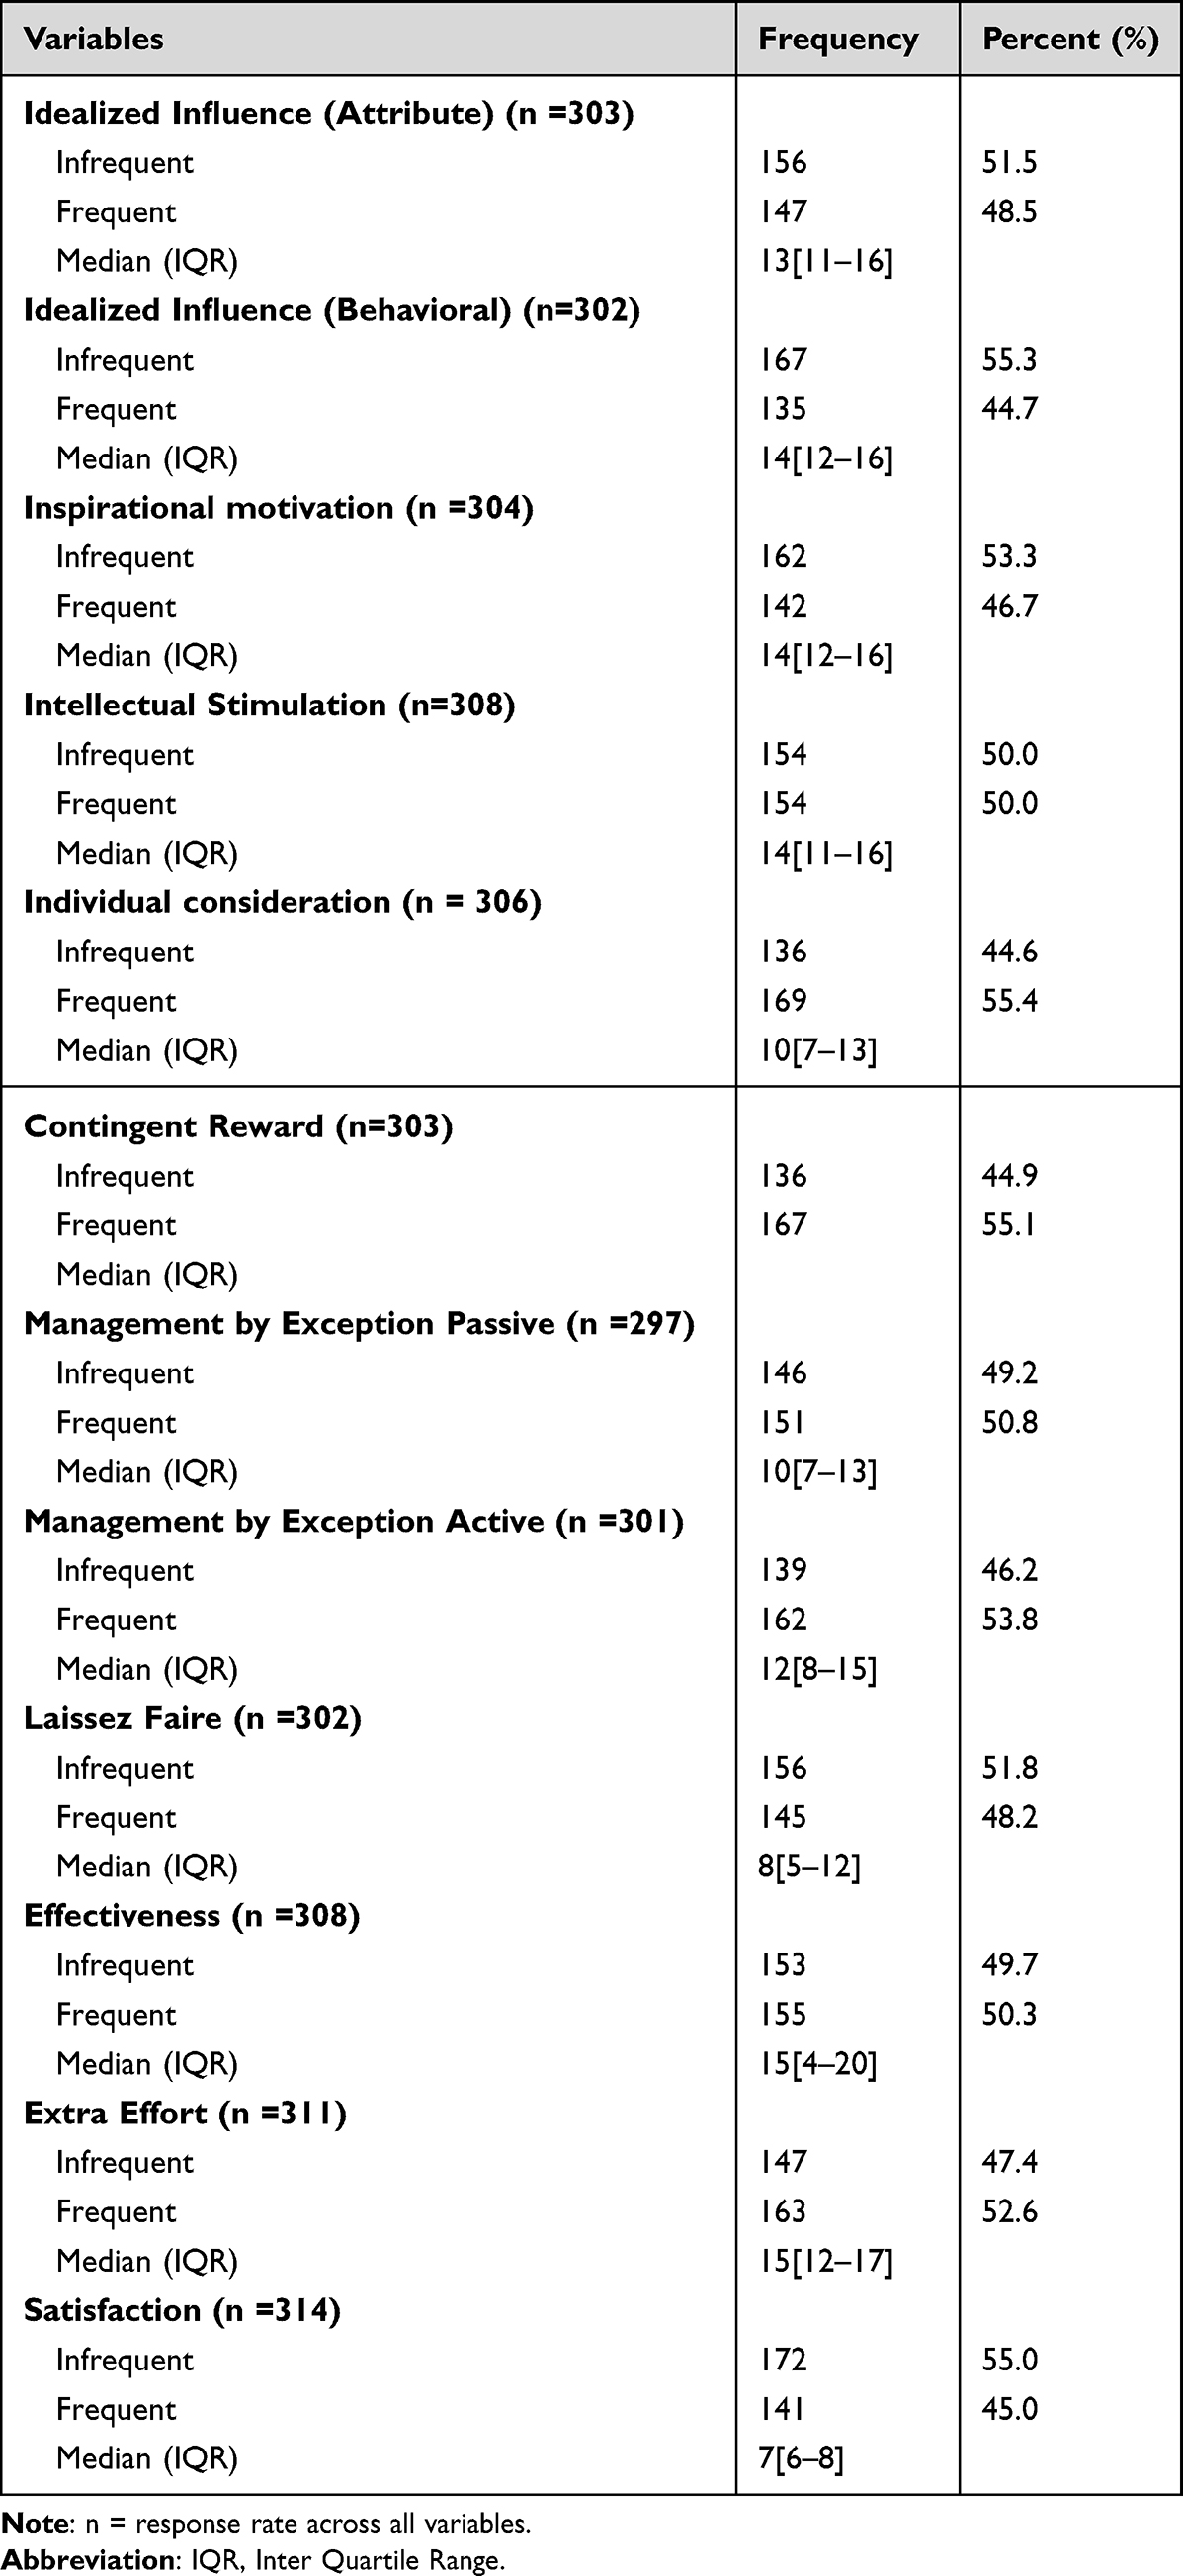 |
Table 3 Summary of the Leaders’ Evaluations of Their Own Leadership Approaches Toward Employees in Selected Hospitals of Oromia Region, Ethiopia, August 1 to October 30, 2021 |
Level of Employees’ Performance at Work
Employee performance level was determined based on measurements of productivity and quality of work. Accordingly, the proportion of employees who achieved the highest level of performance was estimated to be 31.01% (95% CI: 26.9%, 35.3%) and 28.85% [95% CI: 24.5%, 32.9%] achieved the lowest level of performance (Figure 1).
 |
Figure 1 Level of work performance among employees in selected hospitals of Oromia region, Ethiopia, 2021. |
Factors Influencing the Level of Employees’ Performance at Work
Here, the outcome variable is level of employees’ performance, measured using three categories rated as: 1. low performance, 2. average performance, and 3. high performance. The association between employee performance level and independent variables was modelled using ordinal logistic regression. Univariable ordinal logistic regression analysis was performed to identify potential candidate variables showing a crude association with employee performance level, at a P-value of <0.25. Accordingly, among the variables related to employees’ perception of their immediate supervisors’ leadership style, components of the transformational leadership approach, such as idealized influence of their immediate supervisors, supervisors’ inspirational motivations, intellectual stimulation, and individual considerations, were found to have a crude association. Among components of the transactional leadership style, supervisors’ contingent rewards and management by exception were found to have crude associations. The study also revealed that components of the laissez-faire leadership approach were found to have crude associations with employee performance level, at a P-value of <0.25. Similarly, based on leaders’ self-assessment reports, variables related to components of the transformational, transactional, and laissez faire styles had a crude association with employee performance level. Moreover, leaders’ effectiveness, extra effort, and employees’ satisfaction showed crude associations with employee performance level, at a P-value of <0.25. However, no sociodemographic variables were associated with employee performance.
All selected candidate variables were subjected to multivariate ordinal logistic regression analysis to test their independent associations after adjusting for all potential confounders. Accordingly, the results of the analysis revealed that the following components were found to have significant associations with employee performance (P-value <0.05): for the transactional leadership style, inspirational motivation and intellectual stimulation, for the laissez faire leadership style, leaders’ effectiveness level, and extra effort were found to have significant associations with employees’ performances (with P-value < 0.05).
Accordingly, the study discovered that the odds of achieving highest level of performance among employees experiencing idealized influence were 70% higher than those not experiencing this approach (AOR = 1.70; 95% CI: 1.12, 2.64). Similarly, the odds of achieving highest level of performance among employees experiencing intellectual stimulation were 60% higher than those not experiencing this approach (AOR = 1.60; 95% CI: 1.04, 2.48). Finally, the odds of achieving highest level of performance among employees experiencing the laissez-faire leadership approach were 2.49 fold higher than employees not experiencing this approach (AOR = 2.49; 95% CI: 1.71, 3.62).
Furthermore, the study discovered that the odds of achieving highest level of performance among employees who had leaders who were frequently effective in fulfilling their job-related needs, represented them with higher authority, and fulfilled organizational requirements were 2.09 fold higher than those with leaders who were infrequently effective (AOR = 2.09; 95% CI: 1.20,3.63). Similarly, the odds of achieving highest level of performance among employees who had leaders who frequently exerted extra effort in motivating them to do more than estimated, heightened their aspiration to succeed, and increased their enthusiasm were 2.11 fold higher than those with leaders who exerted extra effort less frequently (AOR = 2.11; 95% CI: 1.22, 3.68) (Table 4).
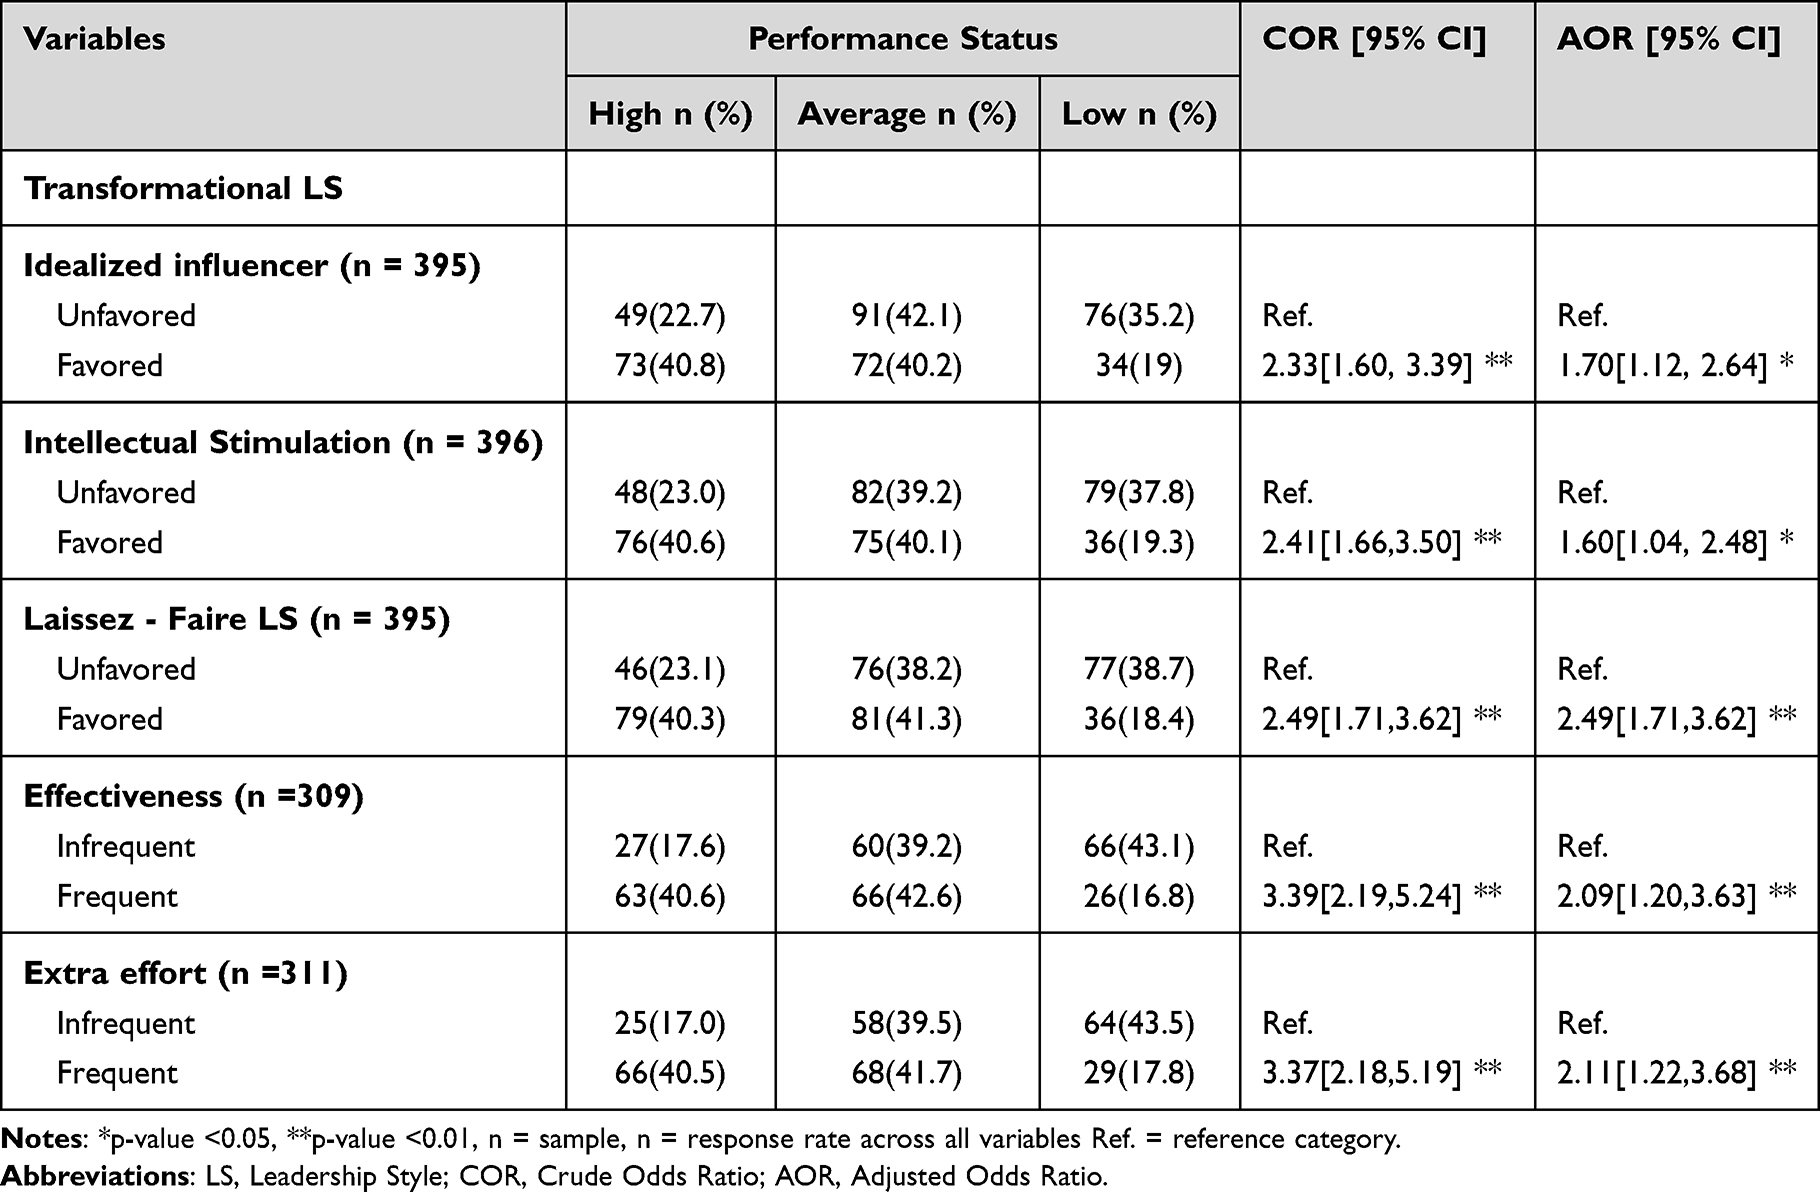 |
Table 4 Factors Influencing the Level of Employees’ Performance at Work in Selected Hospitals of Oromia Region, Ethiopia, August 1 to October 30, 2021 |
Discussion
This study examined the effects of leadership style on job performance among employees providing health services in hospitals in the Oromia region of Ethiopia. According to the current study, the transformational leadership approach was found to be significantly associated with employee performance in healthcare provision. Working under a transformational leader demonstrating two behavioral elements, idealized influence and intellectual stimulation, significantly increased the chance of being the highest job performer among health service providers. In contrast to idealized influence and intellectual stimulation behaviors, the other components of transformational leadership, including inspirational motivation and individual consideration, did not show a significant association with employee performance. These findings are in line with similar studies conducted among employees working in hospitals in Saudi Arabia and multinational corporations in Malaysia.26,27 Several studies have explored possible reasons for the significant effect of transformational leadership on employee performance. Hargis, Watt, and Piotrowski found that intellectual stimulation enables employees to understand, conceptualize, and comprehend their problems. Transformational leaders are capable of motivating their employees, making them capable of analyzing and solving their problems in unusual ways.28,29 Moreover, some studies have shown that transformational leaders have a significant positive influence on employees’ well-being, including quality of work life, burnout, and organizational commitment, both independently and in combination. Furthermore, the transformational leadership style has a significant positive impact on employees’ job satisfaction. Hence, employees who experience a better quality work environment, less burnout, good organizational commitment, and better job satisfaction not only influence their own work performance but also that of their co-workers through supervision, promotion, reward, and support.29–31 Furthermore, Effective work performance can be significantly influenced by employee engagement. Employee engagement significantly influenced by transformational leadership style, according to numerous studies. According to these empirical findings, emotional intelligence of transformational leader plays a significant moderating role in level of employees’ engagement.32,33 The level of involvement among employees also affects their productivity at work. Accordingly, an engaged employees are emotionally invested in their work, put forth personal energy, and “bring in” their personal selves during professional performance at workplace. Engaged workers devote their physical, mental, and emotional self to their work when performing their duties.34
In the current study, an insignificant association was observed between transactional leadership style and employees’ work performance. Accordingly, a transactional leadership style with behavioral components including contingent rewards and both active and passive approaches to management by exception did not have a significant influence on job performance. These findings are supported by a study on the impact of transformational and transactional leadership styles on employee performance in Malaysia and a similar study conducted in the district of the northern province of Sri Lanka.35,36 In the transactional leadership style, leaders use rewards and punishments to improve employees’ job compliance. Some studies suggest that rewards and punishments could improve employees’ job compliance and performance only in rare circumstances, such as in emergency medical units where health care is provided only to critically ill patients.37 Moreover, some studies have found that rewards and punishments could cause excessive worry and stress that interfere with employees’ performance. Furthermore, rewards might not be what employees value. Therefore, if rewards cannot fulfill employees’ expectations, they do not motivate them to achieve a higher performance level.35,38
Moreover, the current study showed a significant relationship between employee performance and laissez-faire leadership style. Accordingly, employees working under laissez-faire leaders have an increased chance of being the highest performers in health service delivery settings compared to their counterparts. The positive association shown in the current study was similar to that observed in studies conducted in Pati, Central Java, which analyzed the effects of transformational and transactional leadership styles on the performance of healthcare providers.39 Controversial evidence and theories regarding the influence of laissez-faire leadership styles on employee performance also exist. Some empirical findings suggest that the laissez-faire leadership style negatively influences employee performance. By contrast, some empirical findings suggest that the laissez-faire leadership style has a positive influence on employee performance.40,41 A possible reason for the inverse relationship between laissez-faire leadership and employee performance could be that refraining from getting involved when organizational problems arise and avoiding decision making could negatively impact employees’ commitment and lead them to feel obliged to commit to delegation. In contrast, the positive aspect of laissez-faire leadership style is autonomy-supportive leadership, which can cultivate a sense of self-determination among employees. Similarly, while micro-level management or monitoring behaviors can be perceived as violations of autonomy, the non-involvement of a leader allows subordinates to be free from controlled motivation or a sense of external pressure.40,42
Furthermore, the study discovered that the chance of being a higher order performer was associated with being an employee working under the supervision of leaders who were frequently effective in fulfilling employees’ job-related needs, representing them with higher authority, and fulfilling organizational requirements. Similarly, the chance of being a higher order performer was associated with being an employee working under the supervision of leaders who frequently exerted extra effort in motivating them to do more than expected, heighten their aspiration to succeed, and increase their enthusiasm compared to those being supervised by leaders who exert extra effort less frequently. Numerous empirical studies support the apparent relationships found in this investigation. According to expectation theory, when employees are satisfied with the support they receive from their managers and immediate supervisors, expectations and rewards are more appropriately aligned, which encourages them to put in more effort.43–45 Similarly, the theory of attitudinal commitment states that workers motivated by rewards and recognition by their managers and immediate supervisors are inclined to exert more effort at work. Some studies revealed that when workers are motivated with their managers and immediate supervisors, they are more inclined to go above and beyond and are driven to work more.34 Furthermore, rewards and recognition are significant antecedent factors that greatly influenced employees’ engagement at work. Such engagement also influences how workers perform with extra effort at work.46 Engaged workers “bring in” their personal self during job performance, invest personal energy, and have an emotional connection to their work. When doing their roles, engaged employees invest their physical, mental, and emotional selves into the process. Employee engagement can be a key driver of success on workplace.32
There are limitations on this study. First, since the employee evaluates their level of work performance and leadership styles, any discrepancies in the attitudes of the employees under various profiles could potentially affect the data’s validity. Additionally, managers and supervisors self-assessed their own leadership styles and ways to mentoring subordinates in order to evaluate certain leadership components. As such, self-desirability bias is likely to have an impact on the data. However, as this method would not totally eliminate the possibility of respondent’s bias, additional approaches that take these biases into account could be taken into consideration.
Second, a quantitative research methodology was employed in the study, adapting the well-known multi-factor leadership survey questionnaire created by Avolio and Bass (1995). The measurement of different facets of leadership styles were made using 24 indicators, each with a five-point Likert scale from 1 (strongly disagree) to 5 (strongly agree) and 45 indicators that measured the leadership techniques from the perspectives of managers and supervisors with a five-point Likert scale, ranging from 1 (sometimes) to 5 (often).24 The employees’ performance was evaluated by four items with five-point Likert scales from 1 (extremely low) to 5 (very high). The feature researches are better to add qualitative methodology to the study in order to expand on the understanding of workers’ job performance as it relates to the underlying factors that determine the nature of the relationship between employees’ work performance and leadership styles.
Despite its limitations, this study offered a novel approach to modeling employee performance levels in relation to leadership styles by using ordinal regression analysis without changing the original measurement scale used to assess the response variable. Including a wide range of hospitals in the region will aid in the creation of reliable generalizations. These findings will further help the field of leadership studies while also providing fresh insights and starting points for future research that the regional health system might use to create health system reform programs.
Conclusions
Based on the results of the current study, employee performance in healthcare settings was significantly and positively influenced by transformational and laissez-faire leadership styles. Transformational leaders providing idealized influence and intellectual stimulation significantly influence employee performance. Similarly, employee performance is influenced by leaders who are frequently effective in fulfilling their needs, representing them with officials, fulfilling organizational requirements, exerting extra effort in motivating them, heightening their aspirations to succeed, and increasing their enthusiasm.
In contrast, the other components of transformational leadership, including inspirational motivation and individual consideration, were not significantly associated with employee performance. Moreover, transactional leadership style did not have a significant relationship with employee performance. Among transactional leaders, behavioral elements, including contingent rewards and both active and passive approaches to management by exception, did not have a significant influence on job performance.
Abbreviations
AOR, Adjusted Odds Ratio; CR, Contingency Reward; COR, Crude Odds Ratio; GDP, Gross Domestic Product; IC, Individual Consideration; II, Idealized Influence; IM, Inspirational Motivation; IS, Intellectual Stimulation; MBE, Management by Exception; MLQ, Multifactor Leadership Questionnaire; MMR, Mothers Mortality Rate; NGO, Non- Governmental Organization; OR, Odds Ratio; UWES, Urchtect Work Engagement Scale; WHO, World Health Organization.
Data Sharing Statement
The data for the current study were obtained from the study participants and are available, upon formal request, from the principal investigator, Dr. Zeleke Amana.
Ethics Approval and Informed Consent
The research was carried out as a component of a doctoral dissertation offered as a collaborative postgraduate program by Vision International University, USA, and Grace Graduate School, Ethiopia. In Ethiopia, the institutional ethical board of the educational program’s host institutions grants ethical permission for research undertaken by PhD students who enroll in postgraduate programs from different affiliations. Hence, the ethical approval was obtained from the Institutional Ethical Review Board (IERB) of Vision International University, USA, and Grace Graduate School, Ethiopia. Subsequently, a letter of cooperation was obtained from the Oromia Health Bureau and submitted to the concerned institutions, including hospitals. The participants were informed and requested to participate in the study using a written consent form constituting the required ethical principles. Accordingly, participants were informed about the objectives of the study and the benefits and risks of participation. The autonomy of the participants was exercised by ensuring their right to refuse to participate in the study or to discontinue the interview process at any time. Participants’ confidentiality was ensured by avoiding any unique identifiers that could potentially disclose their information. The collected data will not be used for any other purpose except for the objectives of this study.
Acknowledgments
We gratefully acknowledge Vision International University, USA in collaboration with the Grace Graduate School for providing indispensable support for this crucial study. We also acknowledge the Oromia Health Bureau for other necessary support as needed. Moreover, all healthcare providers working in the selected hospitals and participants are acknowledged for their genuine cooperation during the entire course of the study.
Author Contributions
All authors made a significant contribution to the work reported, whether in the conception, study design, execution, acquisition of data, analysis, and interpretation, or in all these areas, took part in drafting, revising, or critically reviewing the article; gave final approval of the version to be published; have agreed on the journal to which the article has been submitted; and agree to be accountable for all aspects of the work.
Funding
There is no funding to report.
Disclosure
The authors declare that they have no competing interests.
References
1. Volckmann R. Integral leadership and diversity—definitions, distinctions and implications. Int Leader Rev. 2012;12(3):1–21.
2. Bennis WG, Townsend R Reinventing leadership: strategies to achieve a new style of leadership and empower your organisation; 1995.
3. Silva A. What is leadership? J Busin Stud Quarter. 2016;8(1):1.
4. Bolden R. What is Leadership? Centre for Leadership Studies, University of Exeter; 2004.
5. Kruse K What is leadership. Forbes magazine. 2013;3.
6. Blake RR, Mouton JS. How to choose a leadership style. Train Develop J. 1982;1:8.
7. Crispen C, Michael OS, Tendai M. Leadership style, employee motivation and commitment: empirical evidence from a consolidated retail bank operating in a depressed economy. Afr J Bus Manage. 2011;5(20):8337–8346. doi:10.5897/AJBM11.1005
8. Bass BM, Stogdill RM. Bass & Stogdill’s Handbook of Leadership: Theory, Research, and Managerial Applications. Simon and Schuster; 1990.
9. Smith BS, Squires V. The role of leadership style in creating a great school. SELU Res Rev J. 2016;1(1):65–78.
10. Nanjundeswaraswamy TS, Swamy DR. Leadership styles. Adv Manage. 2014;7(2):57.
11. Val C, Kemp J. Leadership Styles. Pathways. 2012;24(3):28–31.
12. Marques J. The changed leadership landscape: what matters today. J Manage Develop. 2015;34(10):1310–1322. doi:10.1108/JMD-02-2015-0010
13. Bass BM, Riggio RE. The transformational model of leadership. Lead Organ. 2010;2(1):76–86.
14. Patterson KA. Servant Leadership: A Theoretical Model. Regent University; 2003.
15. Hay I. Transformational leadership: characteristics and criticisms. E J Organ Learn Leader. 2006;5:2.
16. Jyoti J, Bhau S. Impact of transformational leadership on job performance: mediating role of leader–member exchange and relational identification. Sage Open. 2015;5(4):2158244015612518. doi:10.1177/2158244015612518
17. Covey S. Developing tomorrow’s transformational leaders today. Transformat Leader Rep. 2007;2:1.
18. Dvir T, Eden D, Avolio BJ, Shamir B. Impact of transformational leadership on follower development and performance: a field experiment. Acad Manage J. 2002;45(4):735–744. doi:10.2307/3069307
19. Pawar A. Transformational leadership: inspirational, intellectual and motivational stimulation in business. Int J Enhan Res Manage Comput Appl. 2016;5(5):14–21.
20. Morrison JL. Leadership: theory and practice. J Educ Bus. 2007;83(2):116. doi:10.3200/JOEB.83.2.116-120
21. World Health Organization. Everybody’s Business--Strengthening Health Systems to Improve Health Outcomes: WHO’s Framework for Action. World Health Organization; 2007.
22. Manyazewal T. Using the World Health Organization health system building blocks through survey of healthcare professionals to determine the performance of public healthcare facilities. Arch Public Health. 2017;75(1):1–8. doi:10.1186/s13690-017-0221-9
23. Aarons GA, Conover KL, Ehrhart MG, Torres EM, Reeder K. Leader–member exchange and organizational climate effects on clinician turnover intentions. J Health Organiz Manage. 2021;35(1):68–87. doi:10.1108/JHOM-10-2019-0311
24. Avolio BJ, Bass BM. Multifactor Leadership Questionnaire (TM). Menlo Park, CA: Mind Garden, Inc; 2004.
25. Antonakis J. The Validity of the Transformational, Transactional, and Laissez-Faire Leadership Model as Measured by the Multifactor Leadership Questionnaire (MLQ 5X). Walden University; 2001.
26. Almutairi DO. The mediating effects of organizational commitment on the relationship between transformational leadership style and job performance. Int J Busi Manage. 2016;11(1):231. doi:10.5539/ijbm.v11n1p231
27. Dastane DO. Impact of leadership styles on employee performance: a moderating role of gender. Austr J Busin Manage Res. 2020;5(12):27–52. doi:10.52283/NSWRCA.AJBMR.20200512A03
28. Hargis MB, Watt JD, Piotrowski C. Developing leaders: examining the role of transactional and transformational leadership across business contexts. Organ Develop J. 2011;29(3):51.
29. Risambessy A, Swasto B, Thoyib A, Astuti ES. The influence of transformational leadership style, motivation, burnout towards job satisfaction and employee performance. J Basic Appl Sci Res. 2012;2(9):8833–8842.
30. Elshout R, Scherp E, van der Feltz-Cornelis CM. Understanding the link between leadership style, employee satisfaction, and absenteeism: a mixed methods design study in a mental health care institution. Neuropsychiatr Dis Treat. 2013;9:823–837. doi:10.2147/NDT.S43755
31. Kara D, Uysal M, Sirgy MJ, Lee G. The effects of leadership style on employee well-being in hospitality. Int J Hospitality Manage. 2013;34:9–18. doi:10.1016/j.ijhm.2013.02.001
32. Khan MW, Altaf M. Important dimensions influencing employee engagement in organizations of Pakistan. J Busin Manage Res. 2015;9(1):270–275.
33. Milhem M, Muda H, Ahmed K. The effect of perceived transformational leadership style on employee engagement: the mediating effect of leader’s emotional intelligence. Found Manage. 2019;11(1):33–42. doi:10.2478/fman-2019-0003
34. Matzler K, Renzl B. The relationship between interpersonal trust, employee satisfaction, and employee loyalty. Total Qual Manag Bus. 2006;17(10):1261–1271. doi:10.1080/14783360600753653
35. Raveendran T. Does transactional leadership style predict performance of development officers? Sri Lanka J Busin Stud Finance. 2021;1(1):1–15.
36. Hoxha A. Transformational and transactional leadership styles on employee performance. Int J Human Soc Sci Invent. 2019;8(11):46–58.
37. Alharbi AY. Leadership styles of nurse managers and their effects on nurse and organisational performance, issues and problems. Int J Inf Res Rev. 2017;4(9):4516–4525.
38. Howell JM, Avolio BJ. Transformational leadership, transactional leadership, locus of control, and support for innovation: key predictors of consolidated-business-unit performance. J Appl Psychol. 1993;78(6):891. doi:10.1037/0021-9010.78.6.891
39. Veliu L, Manxhari M, Demiri V, Jahaj L. The influence of leadership styles on employee’s performance. Management. 2017;31:2.
40. Yang I. Positive effects of laissez-faire leadership: conceptual exploration. J Manage Develop. 2015;34(10):1246–1261. doi:10.1108/JMD-02-2015-0016
41. Silva S, Mendis B. Relationship between transformational, transaction and laissez-faire leadership styles and employee commitment. Euro J Busin Manage. 2017;9(7):13–21.
42. Lorena AQ, Hariasih M. The impact of laissez faire leadership style and communication on employee performance at retail companies in Sidoarjo, Indonesia. Indones J Law Econom Rev. 2019;5:10. doi:10.21070/ijler.2019.V5.308
43. Mulki JP, Caemmerer B, Heggde GS. Leadership style, salesperson’s work effort and job performance: the influence of power distance. J Person Selling Sales Manage. 2015;35(1):3–22. doi:10.1080/08853134.2014.958157
44. Vieira VA, Perin MG, Sampaio CH. The moderating effect of managers’ leadership behavior on salespeople’s self-efficacy. J Retailing Consum Serv. 2018;40:150–162. doi:10.1016/j.jretconser.2017.09.010
45. Iqbal J, Shabbir MS, Zameer H, Khan IA, Sandhu MA. Antecedents and consequences of employee engagement: evidence from corporate sector of Pakistan. Paradigms. 2017;11(1):78. doi:10.24312/paradigms110113
46. Salanova M, Agut S, Peiró JM. Linking organizational resources and work engagement to employee performance and customer loyalty: the mediation of service climate. J Appl Psychol. 2005;90(6):1217. doi:10.1037/0021-9010.90.6.1217
 © 2024 The Author(s). This work is published and licensed by Dove Medical Press Limited. The full terms of this license are available at https://www.dovepress.com/terms.php and incorporate the Creative Commons Attribution - Non Commercial (unported, v3.0) License.
By accessing the work you hereby accept the Terms. Non-commercial uses of the work are permitted without any further permission from Dove Medical Press Limited, provided the work is properly attributed. For permission for commercial use of this work, please see paragraphs 4.2 and 5 of our Terms.
© 2024 The Author(s). This work is published and licensed by Dove Medical Press Limited. The full terms of this license are available at https://www.dovepress.com/terms.php and incorporate the Creative Commons Attribution - Non Commercial (unported, v3.0) License.
By accessing the work you hereby accept the Terms. Non-commercial uses of the work are permitted without any further permission from Dove Medical Press Limited, provided the work is properly attributed. For permission for commercial use of this work, please see paragraphs 4.2 and 5 of our Terms.